Dynatrace

Version: 1.1
Updated: Jul 11, 2023
Dynatrace is a cutting-edge solution that offers full-stack monitoring, enabling organizations to track their IT infrastructure's performance and security. Its AI-powered capabilities provide actionable insights to optimize operations and mitigate risks. This integration offers enriched cybersecurity management, allowing users to search and manage security problems, observe problems over time, and automate the retrieval of latest issues. It also provides insights into logs, events, and metrics, while offering AI-powered security advice.
Actions
- Close Problem (Containment) - Closes the specified problem and adds a closing comment.
- Create Problem Comment (Containment) - Adds a new comment on the specified problem.
- Get Events (Enrichment) - Lists events based on the parameters provided.
- Get Problems Daemon (Daemon) - Automatically returns the latest problems.
- Get Problems (Enrichment) - Lists the problems (and their details) observed by Dynatrace during a relative period of time.
- Get Security Advice (Enrichment) - Lists recommendations related to security problems using AI.
- Mute Security Problem (Containment) - Mutes the specified security problem. Muted problems are hidden from the list of problems in the UI.
- Search Logs (Enrichment) - Lists all log records based on the parameters provided.
- Search Metrics (Enrichment) - Lists all metrics based on the parameters provided.
- Search Metrics Daemon (Daemon) - Automatically returns the latest metrics.
- Search Security Problems (Enrichment) - Lists all security problems based the parameters provided.
- Search Security Problems Daemon (Daemon) - Automatically returns latest security problems.
- Unmute Security Problem (Containment) - Unmutes the specified security problem.
Data format
Timeframe
You can use one of the following formats for timeframe:
- Timestamp in UTC milliseconds.
- Human-readable format of 2021-01-25T05:57:01.123+01:00. If no time zone is specified, UTC is used. You can use a space character instead of the T. Seconds and fractions of a second are optional.
- Relative timeframe, back from now. The format is now-NU/A, where N is the amount of time, U is the unit of time, and A is an alignment. The alignment rounds all the smaller values to the nearest zero in the past. For example, now-1y/w is one year back, aligned by a week. You can also specify relative timeframe without an alignment: now-NU. Supported time units for the relative timeframe are:
- m: minutes
- h: hours
- d: days
- w: weeks
- M: months
- y: years
Event Selector
Defines the scope of the query. Only events matching the specified criteria are included in the response.
- Event ID: eventId("id-1", "id-2").
- ID of related entity: entityId("id-1", "id-2").
- Event status: status("OPEN") or status("CLOSED"). You can specify only one status.
- Management zone ID: managementZoneId("123", "321").
- Event type: eventType("event-type"). You can specify only one event type. You can fetch the list of possible event types with the GET event types call.
- Correlation ID: correlationId("id-1", "id-2").
- Happened during maintenance (true, false): underMaintenance(true).
- Notifications are suppressed (true, false): suppressAlert(true).
- Problem creation is suppressed (true, false): suppressProblem(true).
- Frequent event (true, false): frequentEvent(true).
- Event property: property.<key>("value-1", "value-2").
To set several criteria, separate them with commas (,). Only results matching all criteria are included in the response.
Entity Selector
The entity scope of the query. You must set one of these criteria:
- Entity type: type("TYPE")
- Dynatrace entity ID: entityId("id"). You can specify several IDs, separated by a comma (entityId("id-1","id-2")). All requested entities must be of the same type.
You can add one or several of the following criteria. Values are case-sensitive and the EQUALS operator is used unless otherwise specified.
- Tag: tag("value"). Tags in [context]key:value, key:value, and value formats are detected and parsed automatically. Any colons (:) that are part of the key or value must be escaped with a backslash(), otherwise, it will be interpreted as the separator between the key and the value. All tag values are case-sensitive.
- Management zone ID: mzId(123)
- Management zone name: mzName("value")
- Entity name: entityName("value"). By default this filters for entities, whose name contains the given value and is not case sensitive. The following modifications are available:
- entityName.equals: changes the operator to EQUALS.
- entityName.startsWith: changes the operator to BEGINS WITH.
- entityName.in: enables you to provide multiple values. The EQUALS operator applies.
- caseSensitive(entityName("value")): takes any entity name criterion as an arguments and makes the value case-sensitive.
- Health state (HEALTHY,UNHEALTHY): healthState("HEALTHY")
- First seen timestamp: firstSeenTms.<operator>(now-3h). Use any timestamp format from the from/to parameters. The following operators are available:
- lte: earlier than or at the specified time
- lt: earlier than the specified time
- gte: later than or at the specified time
- gt: later than the specified time
- Entity attribute: <attribute>("value1","value2") and <attribute>.exists(). To fetch the list of available attributes, execute the GET entity type request and check the properties field of the response.
- Relationships: fromRelationships.<relationshipName>() and toRelationships.<relationshipName>(). The criterion takes an entity selector as an attribute. To fetch the list of available relationships, execute the GET entity type request and check the fromRelationships and toRelationships fields.
- Negation: not(<criterion>). Inverts any criterion except for type.
For more information, see Entity selector in Dynatrace Documentation.
To set several criteria, separate them with a comma (,). For example, type("HOST"),healthState("HEALTHY"). Only results matching all criteria are included in response.
The length of the string is limited to 10,000 characters.
The number of entities that can be selected is limited to 10000.
Metric Selector
You can specify multiple metric keys separated by commas (for example, metrickey1,metrickey2). To select multiple metrics belonging to the same parent, list the last part of the required metric keys in parentheses, separated by commas, while keeping the common part untouched. For example, to list the builtin:host.cpu.idle and builtin:host.cpu.user metric, write: builtin:host.cpu.(idle,user).
You can select a full set of related metrics by using a trailing asterisk (*) wildcard. For example, builtin:host.* selects all host-based metrics and builtin:* selects all Dynatrace-provided metrics.
You can set additional transformation operators, separated by a colon (:). See Metrics selector transformations in Dynatrace Documentation for additional information on available result transformations and syntax.
Only aggregation, merge, parents, and splitBy transformations are supported by this endpoint.
If the metric key contains any symbols you must quote (") the key. The following characters inside of a quoted metric key must be escaped with a tilde (~):
- Quotes (")
- Tildes (~)
For example, to query the metric with the key of ext:selfmonitoring.jmx.Agents: Type "APACHE" you must specify this selector:
"ext:selfmonitoring.jmx.Agents: Type "APACHE""
To find metrics based on a search term, rather than metricId, use the text query parameter instead of this one.
Log Search
The log search query.
The query must use the Dynatrace search query language.
The query has a limit of 20 relations (logical operators between simple expressions (AND, OR) or comparison operators (=, !=, <, <=, >, >=) in simple expressions).
Dynatrace documentation
More information can be found here.
Dynatrace configuration
To be authenticated to use the Dynatrace API, you need a valid access token. To generate an access token follow these steps:
- In the "Dynatrace menu", select Access tokens.
- Select Generate new token.
- Enter a name for your token.
Dynatrace doesn't enforce unique token names. You can create multiple tokens with the same name. Be sure to provide a meaningful name for each token you generate. Proper naming helps you to efficiently manage your tokens and perhaps delete them when they're no longer needed. - Select the required scopes for the token.
- Select Generate.
- Copy the generated token to the clipboard. Store the token in a password manager for future use.
note
You can only access your token once upon creation. You cannot reveal it afterwards.
Configure Dynatrace in Automation Service and Cloud SOAR
Before you can use this automation integration, you must configure its authentication settings so that the product you're integrating with can communicate with Sumo Logic. For general guidance, see Configure Authentication for Automation Integrations.
How to open the integration's configuration dialog
- Access App Central and install the integration. (You can configure at installation, or after installation with the following steps.)
- Go to the Integrations page.
Classic UI. In the main Sumo Logic menu, select Automation and then select Integrations in the left nav bar.
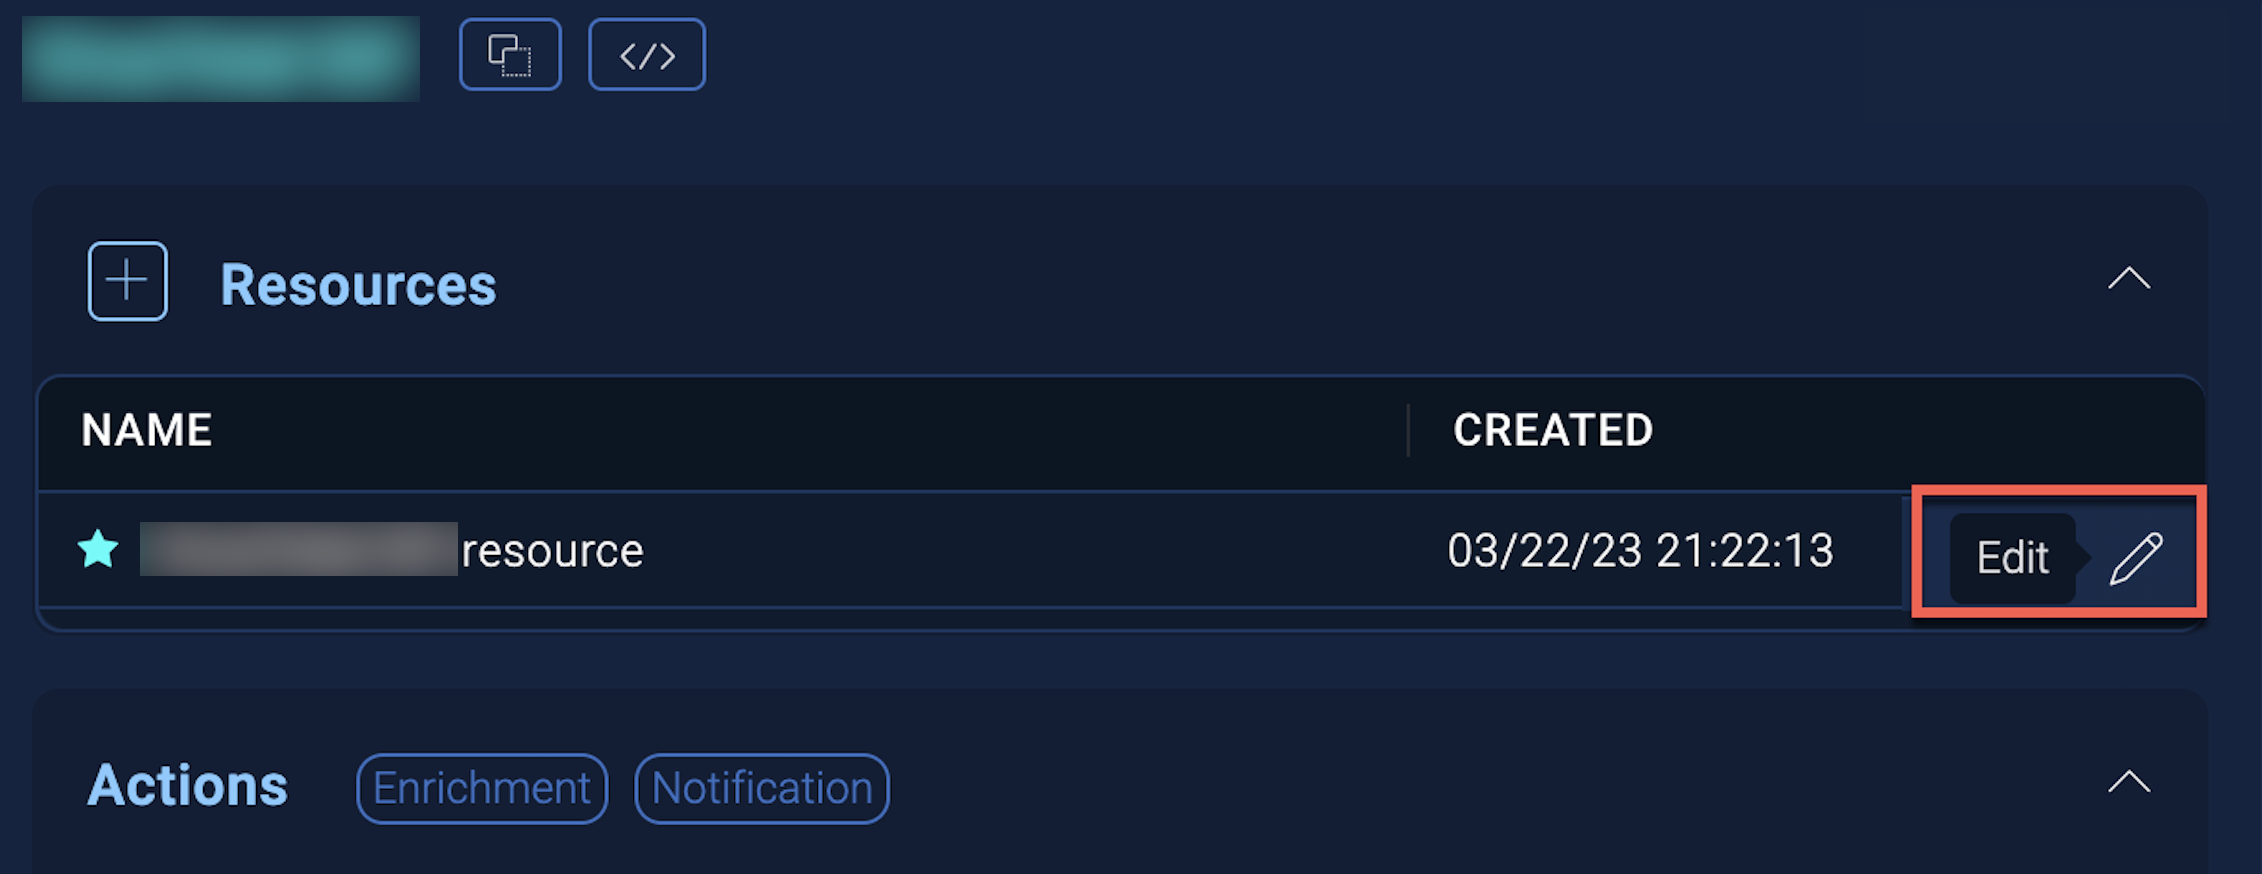
New UI. In the main Sumo Logic menu, select Automation > Integrations. You can also click the Go To... menu at the top of the screen and select Integrations. - Select the installed integration.
- Hover over the resource name and click the Edit button that appears.
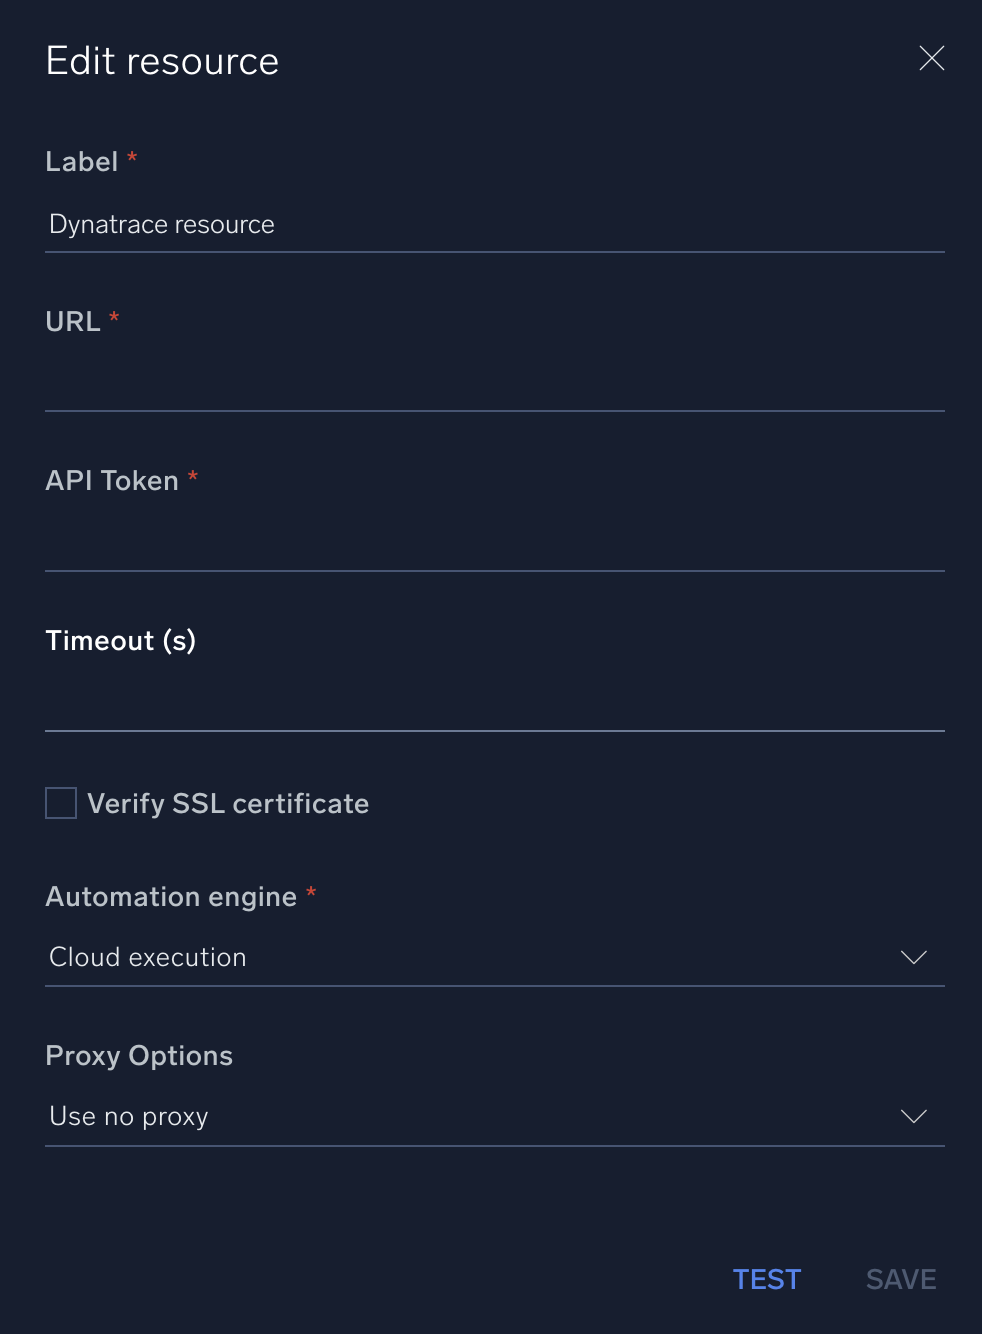
In the configuration dialog, enter information from the product you're integrating with. When done, click TEST to test the configuration, and click SAVE to save the configuration:
-
Label. Enter the name you want to use for the resource.
-
URL. Enter your Dynatrace server URL.
-
API Token. Enter the Dynatrace API token you created earlier.
-
Connection Timeout (s). Set the maximum amount of time the integration will wait for a server's response before terminating the connection. Enter the connection timeout time in seconds (for example,
180). -
Verify Server Certificate. Select to validate the server’s SSL certificate.
-
Automation Engine. Select Cloud execution for this certified integration. Select a bridge option only for a custom integration. See Cloud or Bridge execution.
-
Proxy Options. Select whether to use a proxy. (Applies only if the automation engine uses a bridge instead of cloud execution.)
- Use no proxy. Communication runs on the bridge and does not use a proxy.
- Use default proxy. Use the default proxy for the bridge set up as described in Using a proxy.
- Use different proxy. Use your own proxy service. Provide the proxy URL and port number.
For information about Dynatrace, see Dynatrace documentation.
Change Log
- May 9, 2022 - First upload
- July 11, 2023 (v1.1) - Updated the integration with Environmental Variables