Troubleshoot Playbooks
You can run playbooks in automations for monitors, Cloud SIEM, or Cloud SOAR. If a playbook has a problem when it runs in an automation, an error message often displays in the playbook providing information about the problem.
To test a playbook before using it in an automation, see Test a playbook.
Test nodes in a playbook
The playbook Test Mode toggle lets you test individual nodes of a playbook without needing to complete the entire flow. Testing individual nodes helps you improve your playbooks' reliability and shorten configuration time. You can provide mock values for variables used in the node, and run the results to see the output and any errors. The results provide informative messages to help you troubleshoot problems.
When you test nodes, keep in mind:
- You can test action, condition, user choice, and task nodes. You cannot test filter or nested playbook nodes.
- A single-node test does not execute downstream nodes. Only the selected node runs using the provided input. You cannot view the previous or past test node run executions.
- Invalid JSON or missing required fields will block the test and show an error in the Output panel.
- Before you can test a node, any node configuration changes need to be saved to the playbook draft. When you test a node, clicking SAVE & RUN TEST saves the node configuration to the same draft before executing.
- Testing nodes counts against your action limit quota.
To test a node:
- Select a playbook.
- Click the Edit button at the bottom of the screen to make a draft of the playbook.
- Click the Edit button on a node.
- Click the Test Mode toggle at the top of the Edit Node dialog. An Input panel appears to the left, and an Output panel appears to the right.
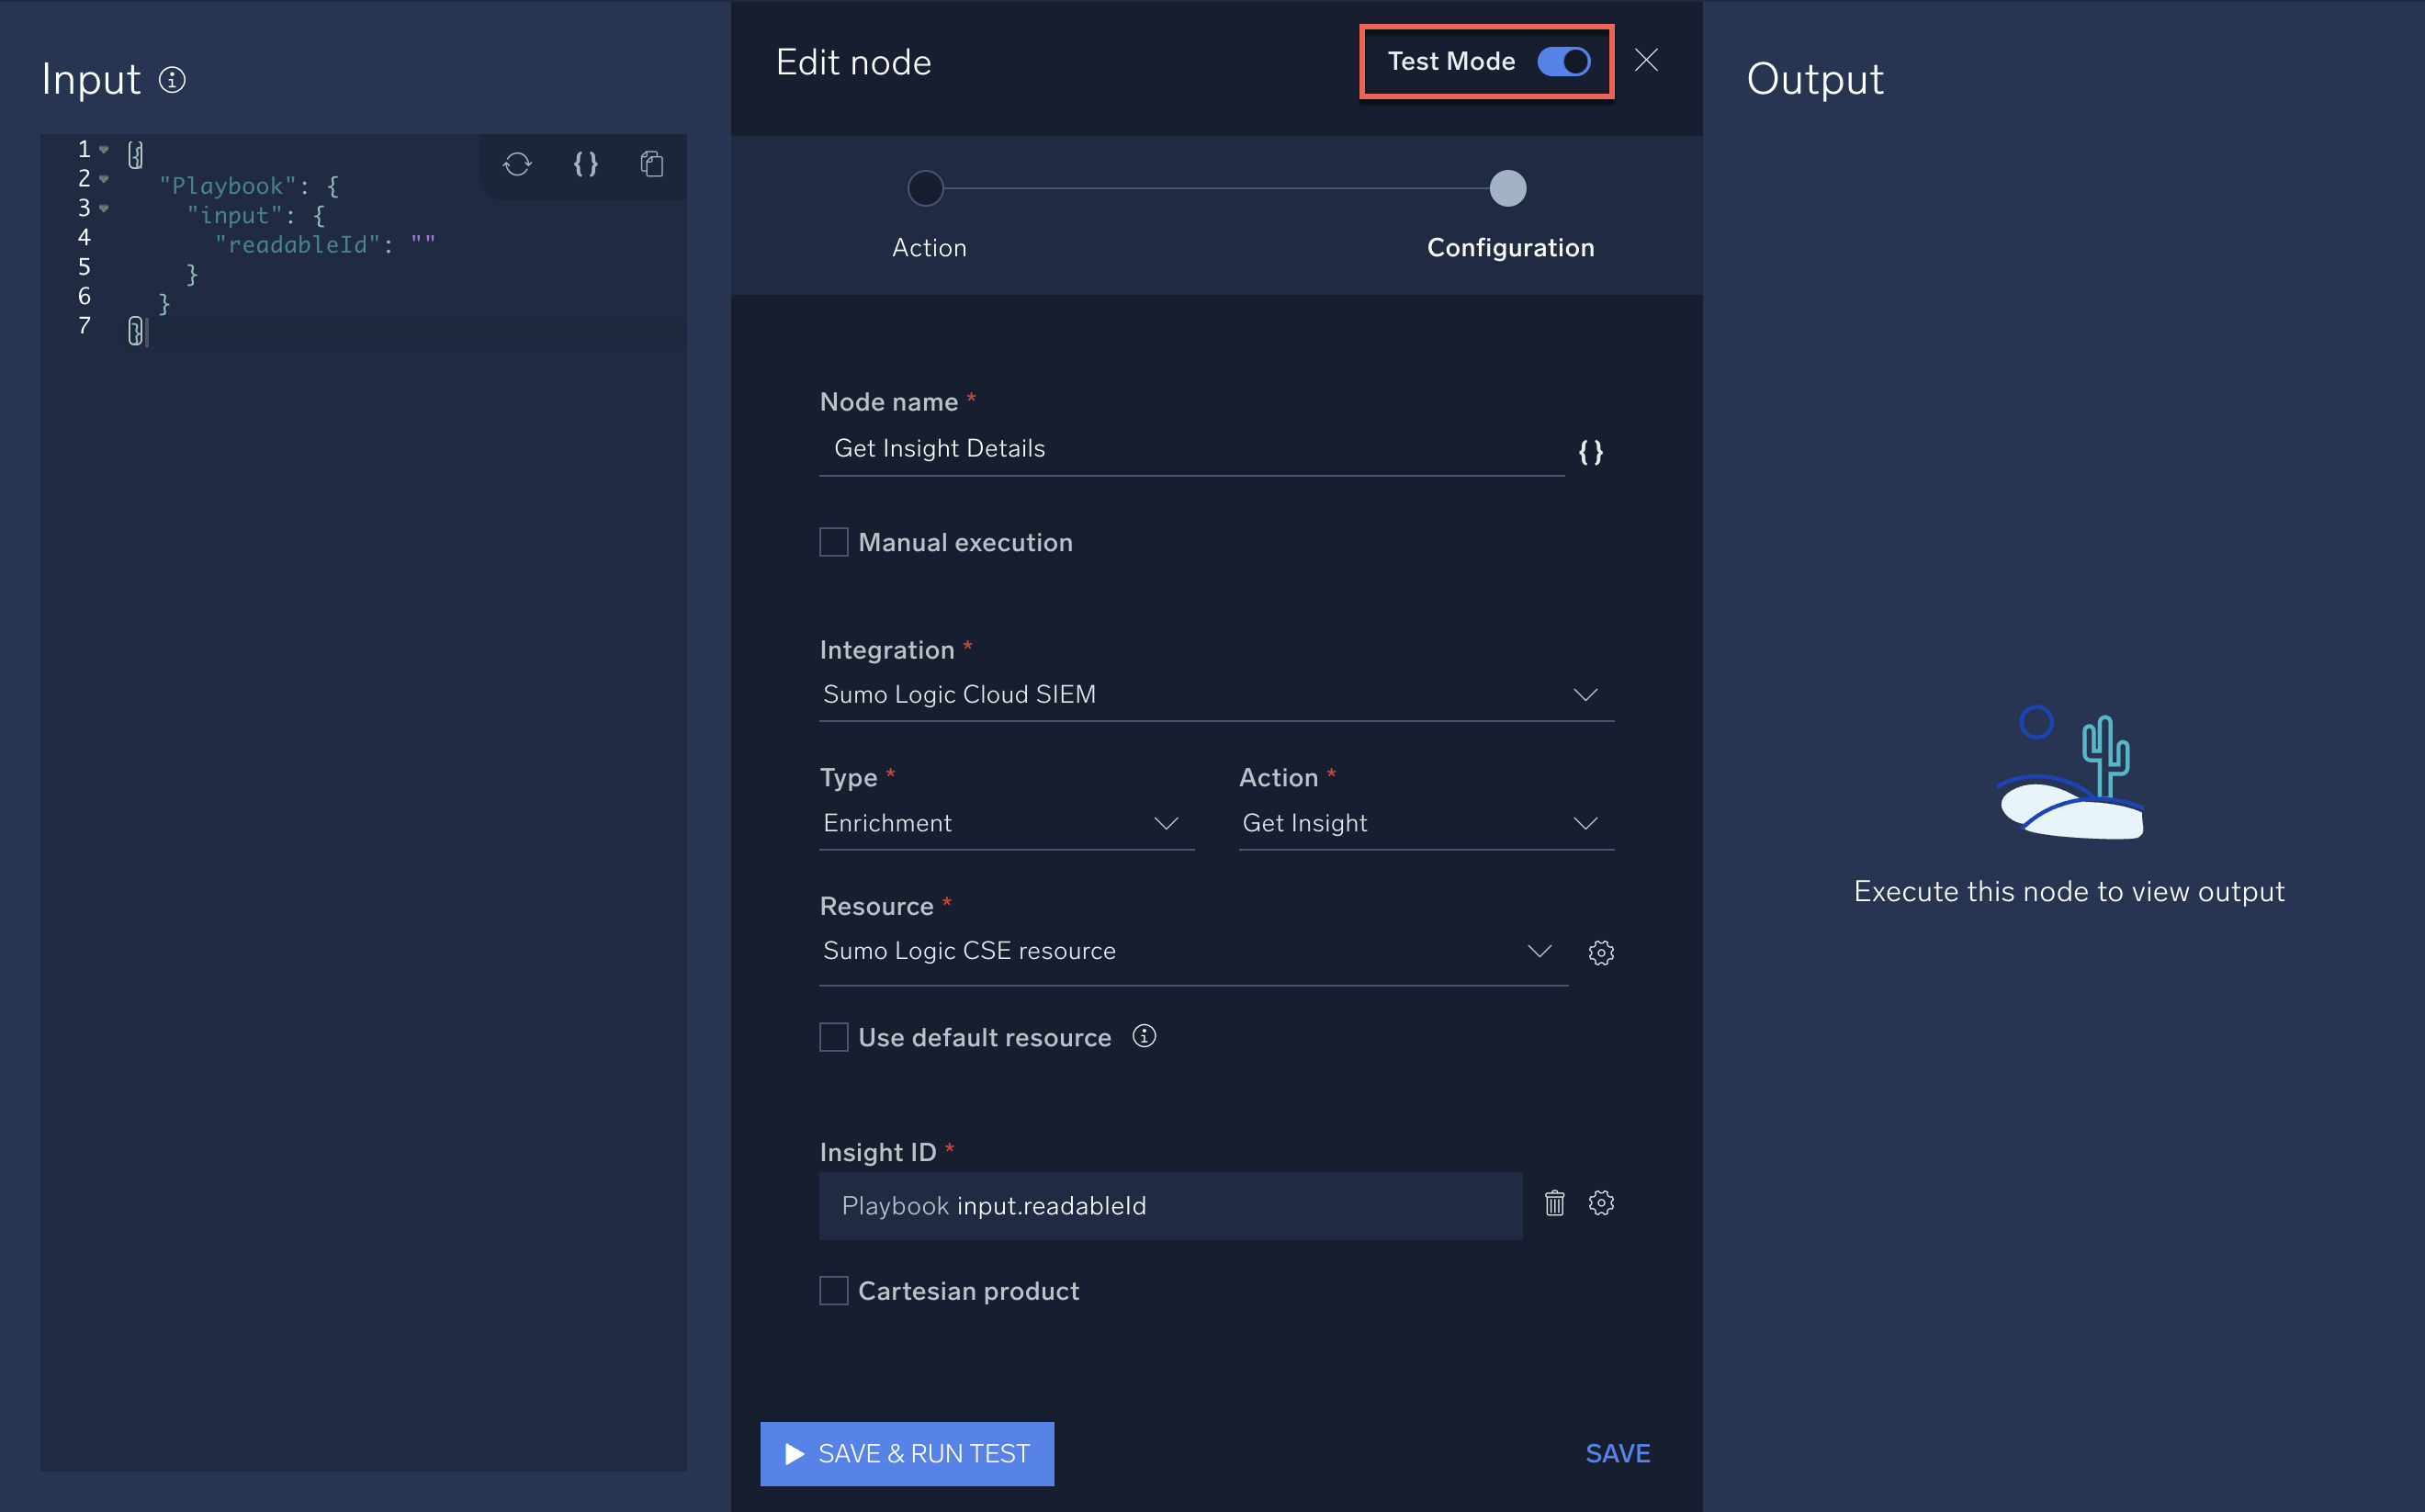
- In the Input panel, enter variables to test the node. When you click SAVE & RUN TEST, results of the test appear in the Output panel.
Ensure that you enter valid variables for the kind of inputs you need to test. Following are examples with different node types:- Action
In the following example that uses input from insights, we provide an insight ID. The output shows the result of the action.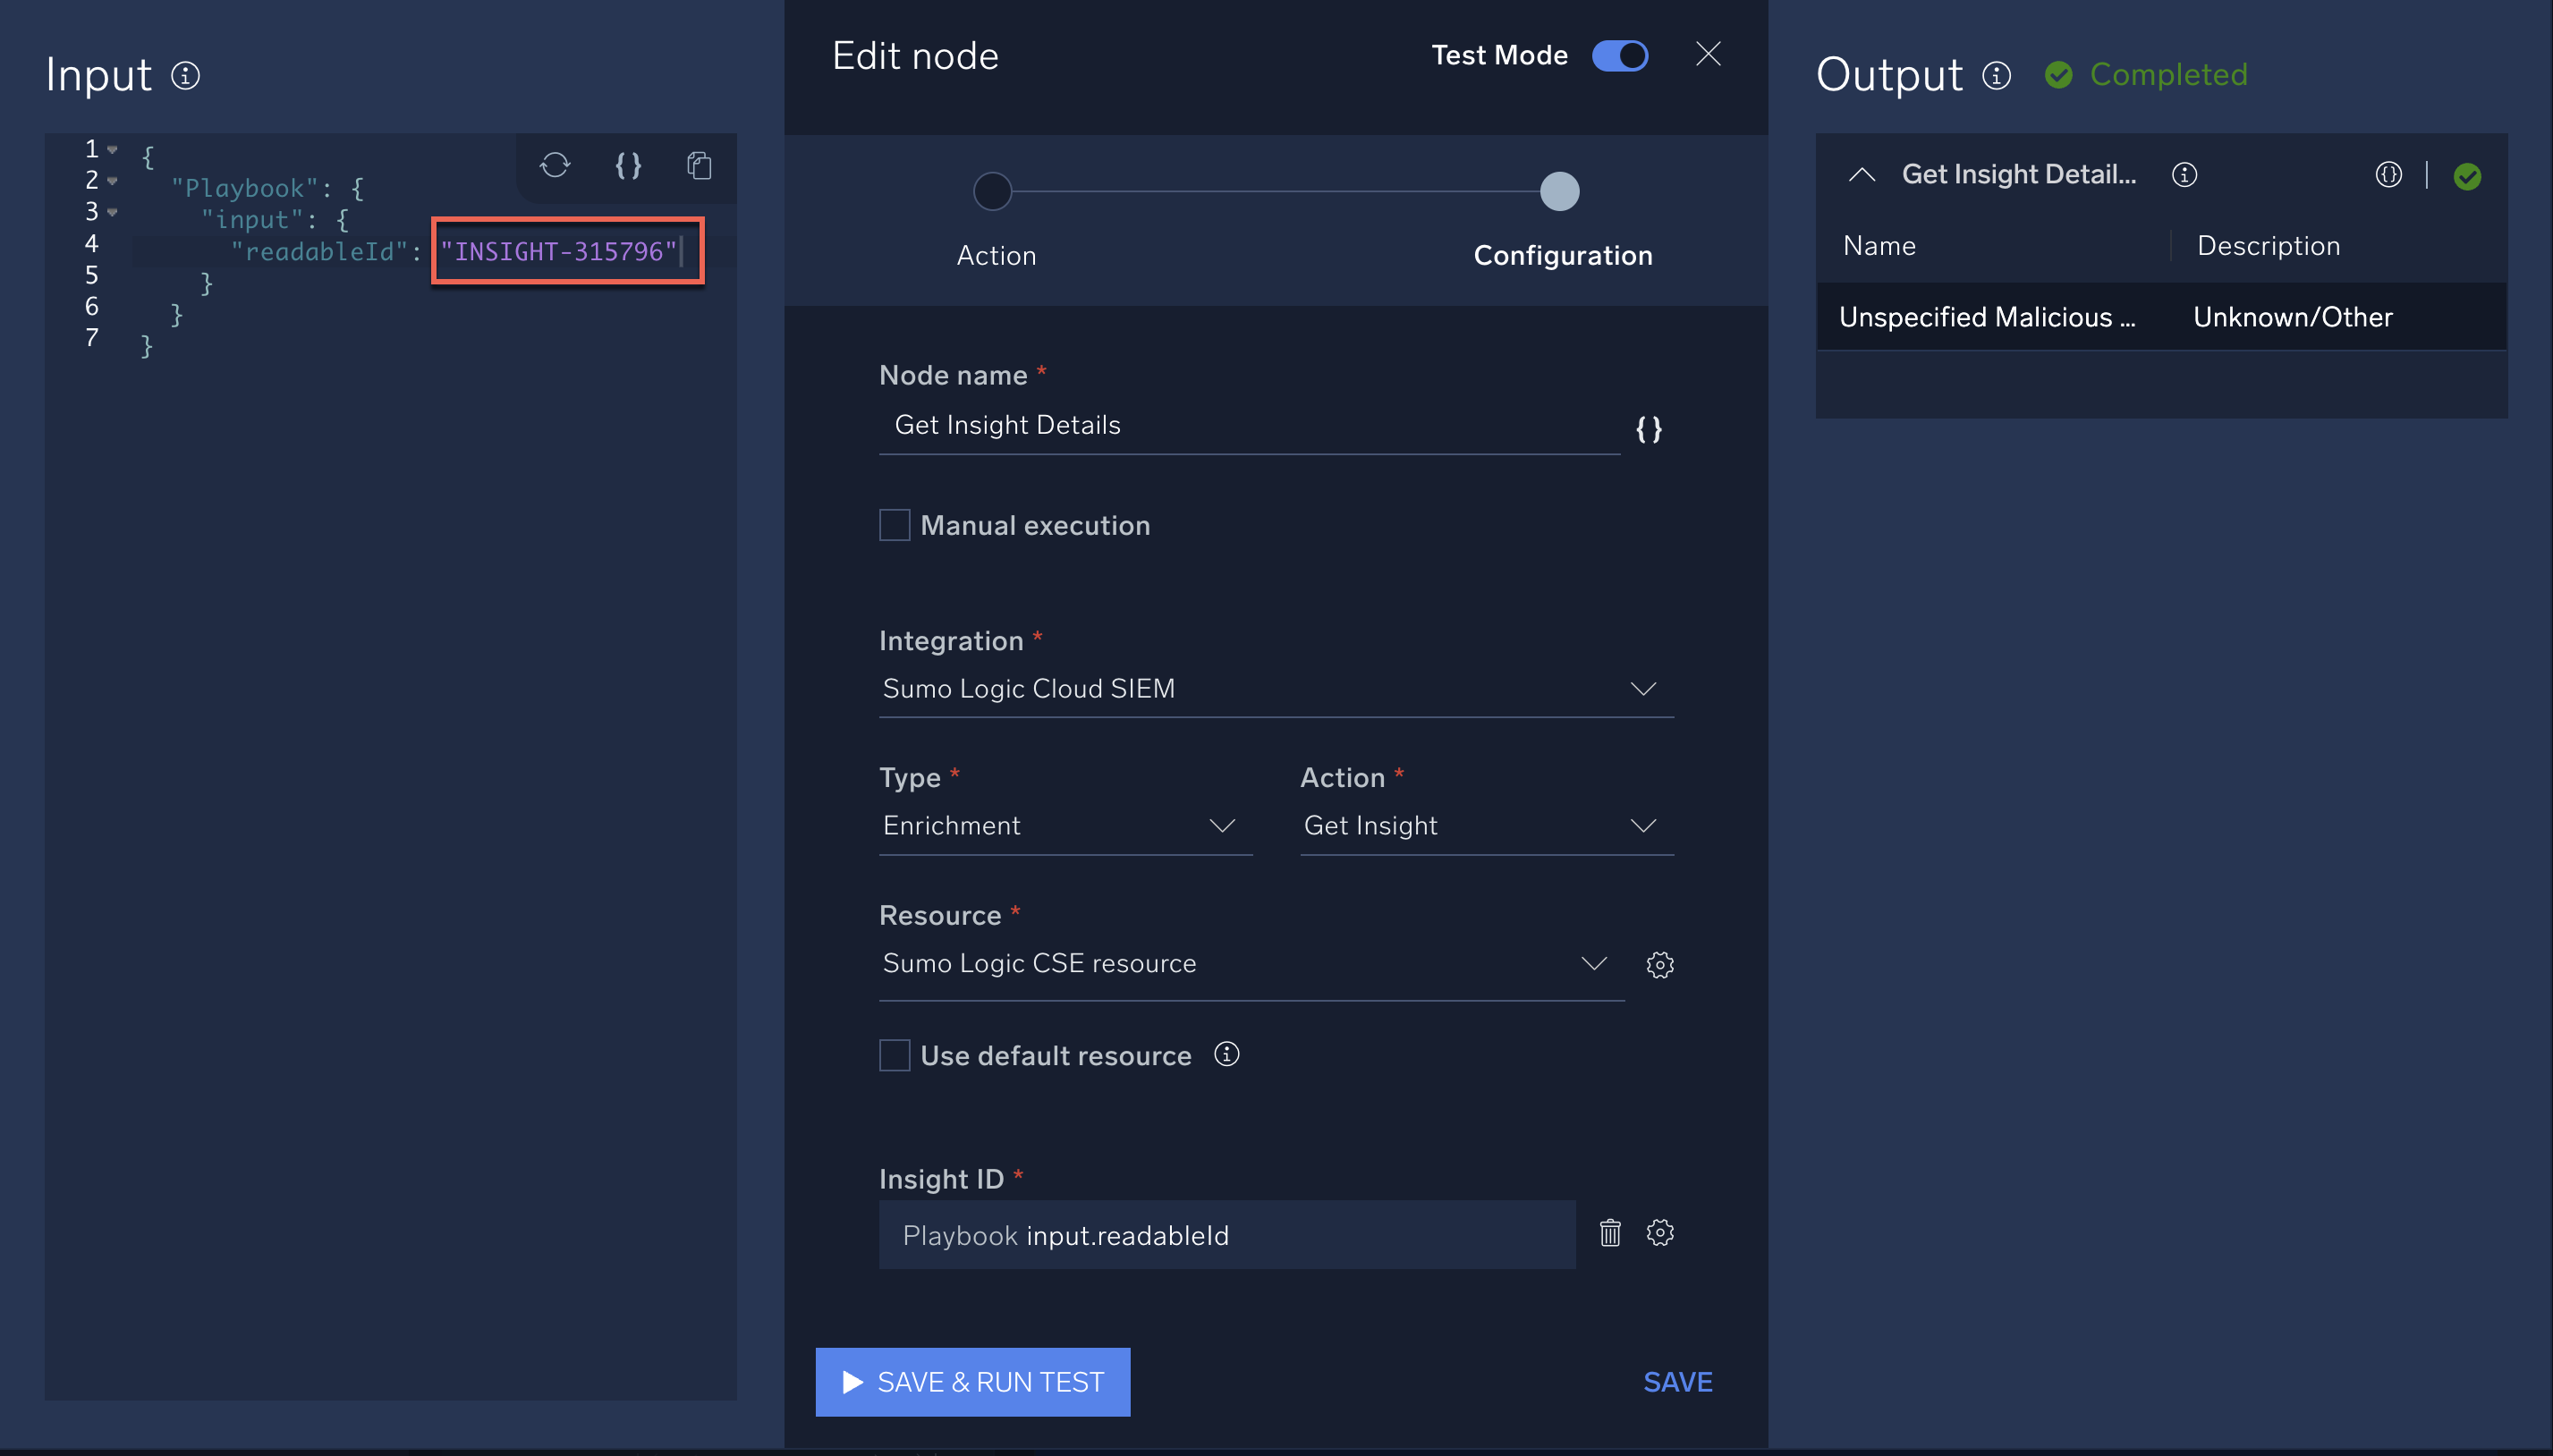
- Condition
In the following example that uses input from reputation vendors, we provide reputation scores. The output shows the result of the condition.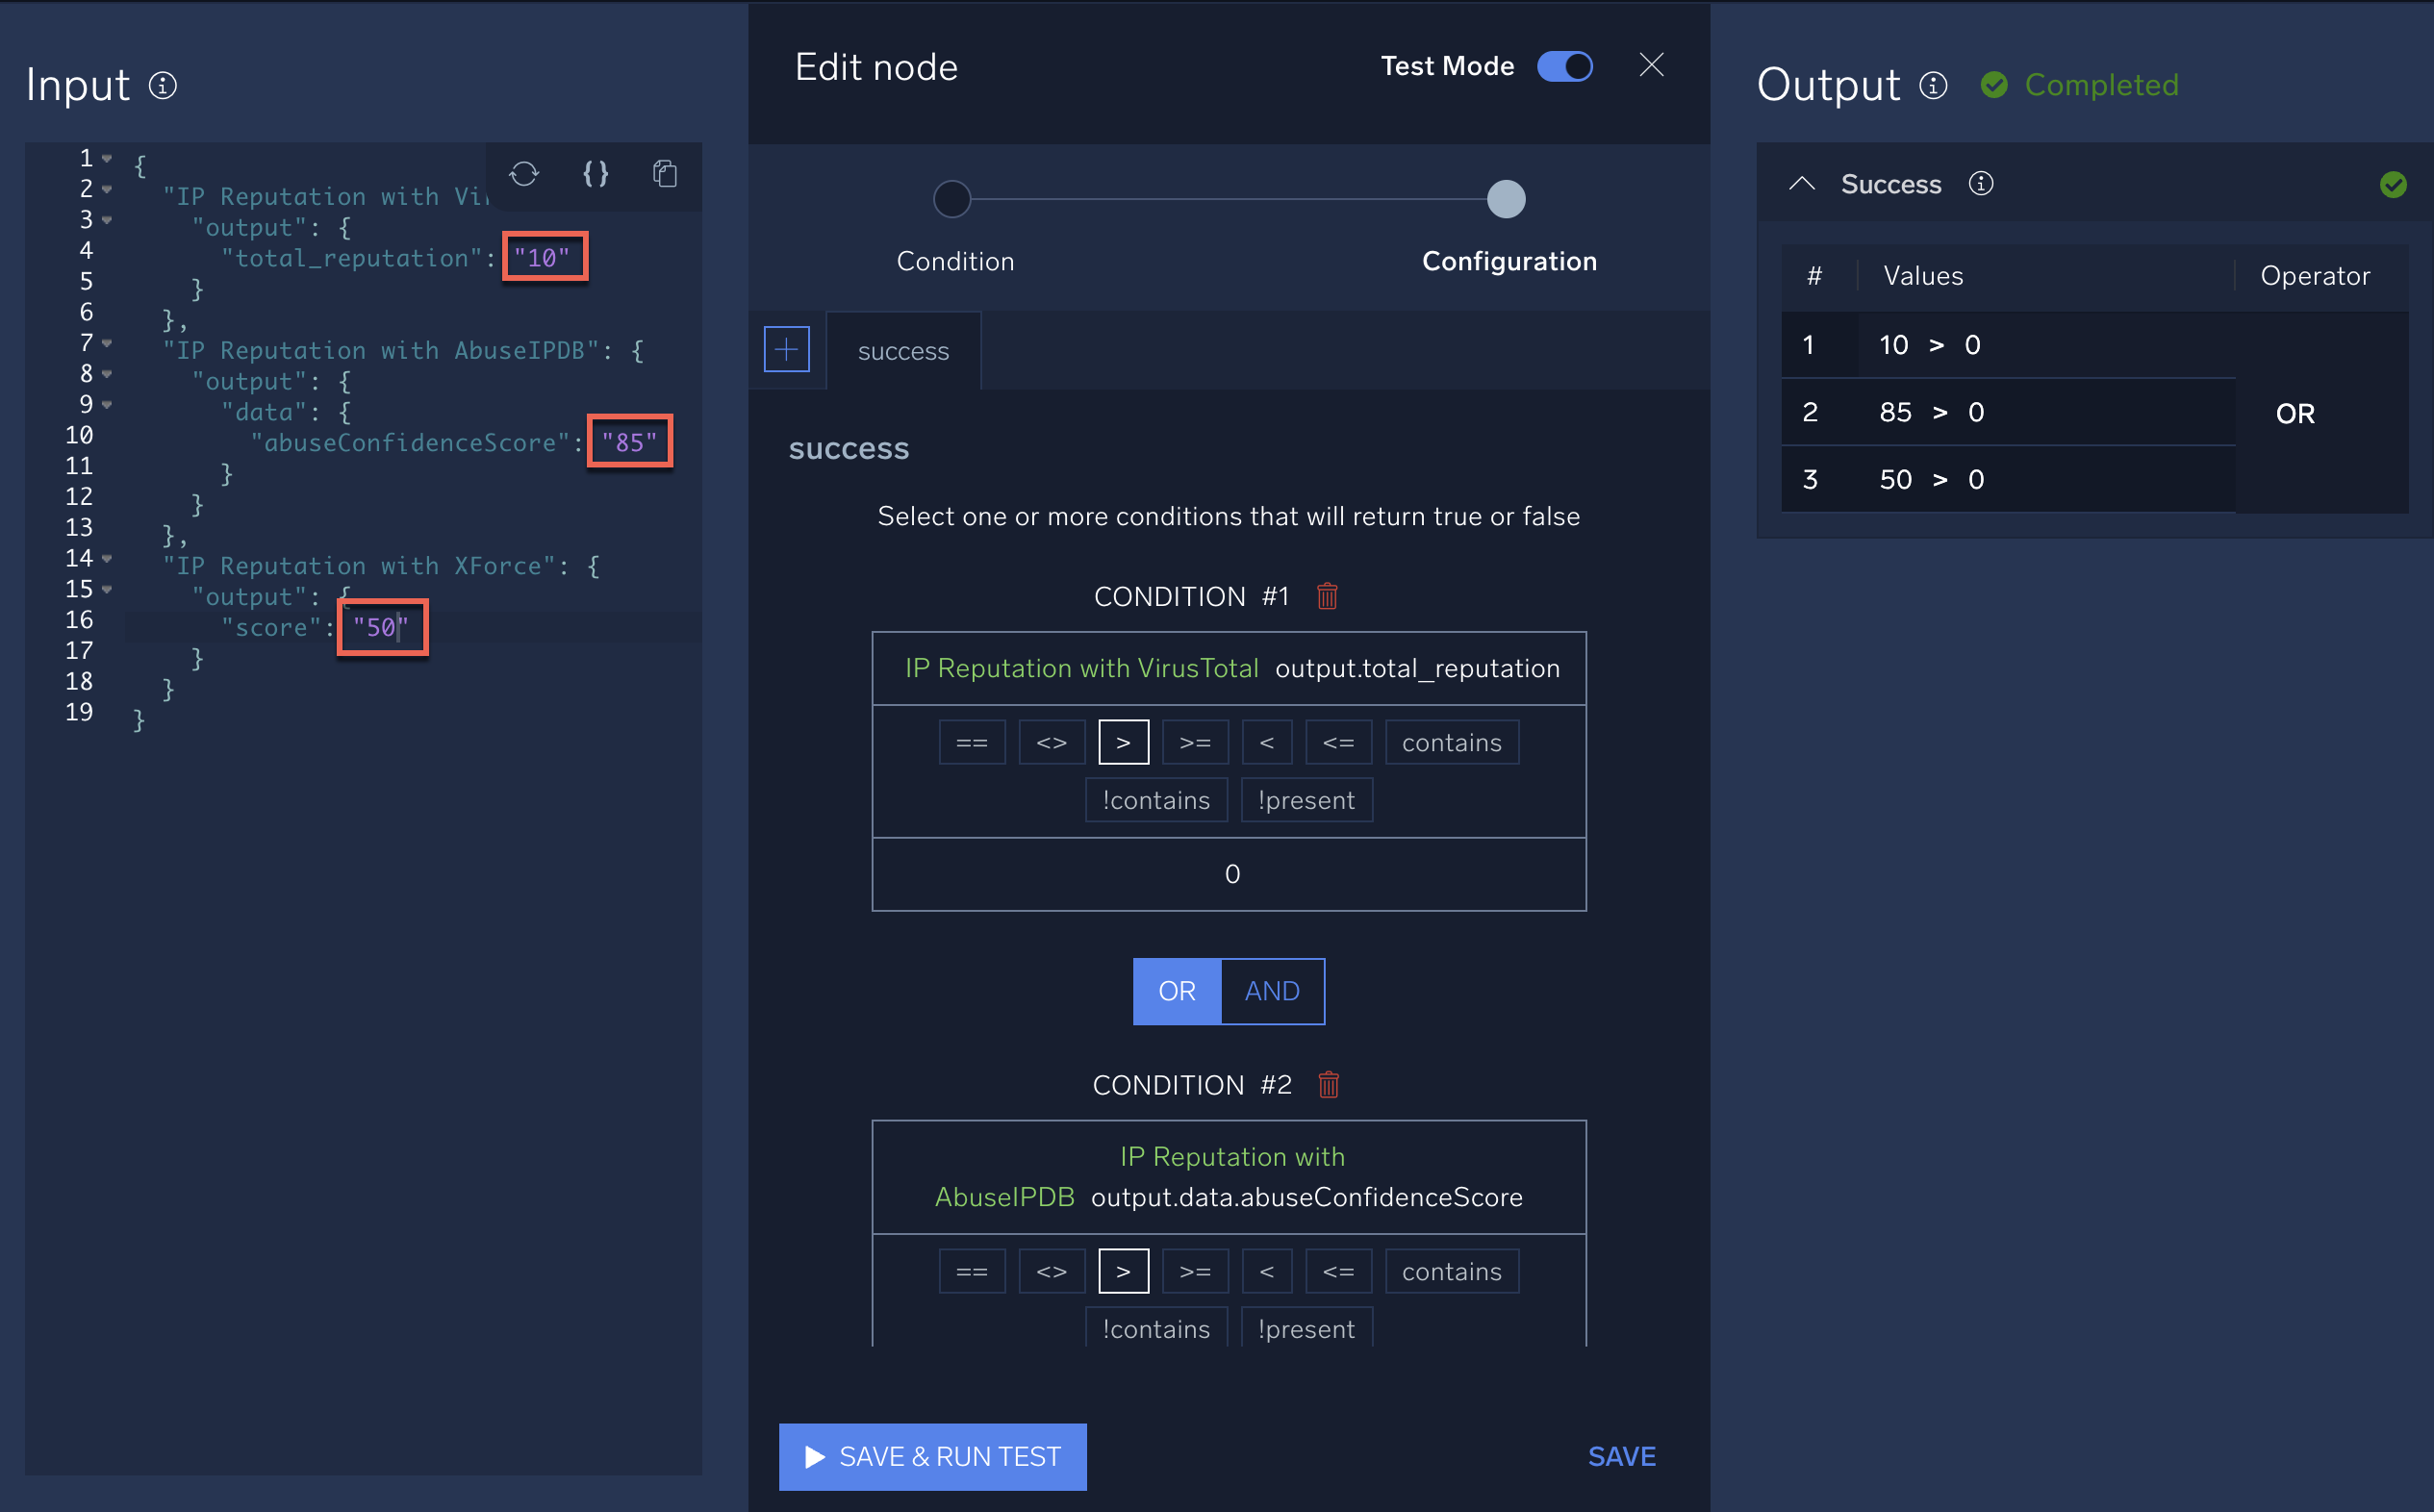
- User choice
In the following example that uses user input data, we provide an email address. The output provides the resulting user choice. Click the user choice options to test whether they work as expected.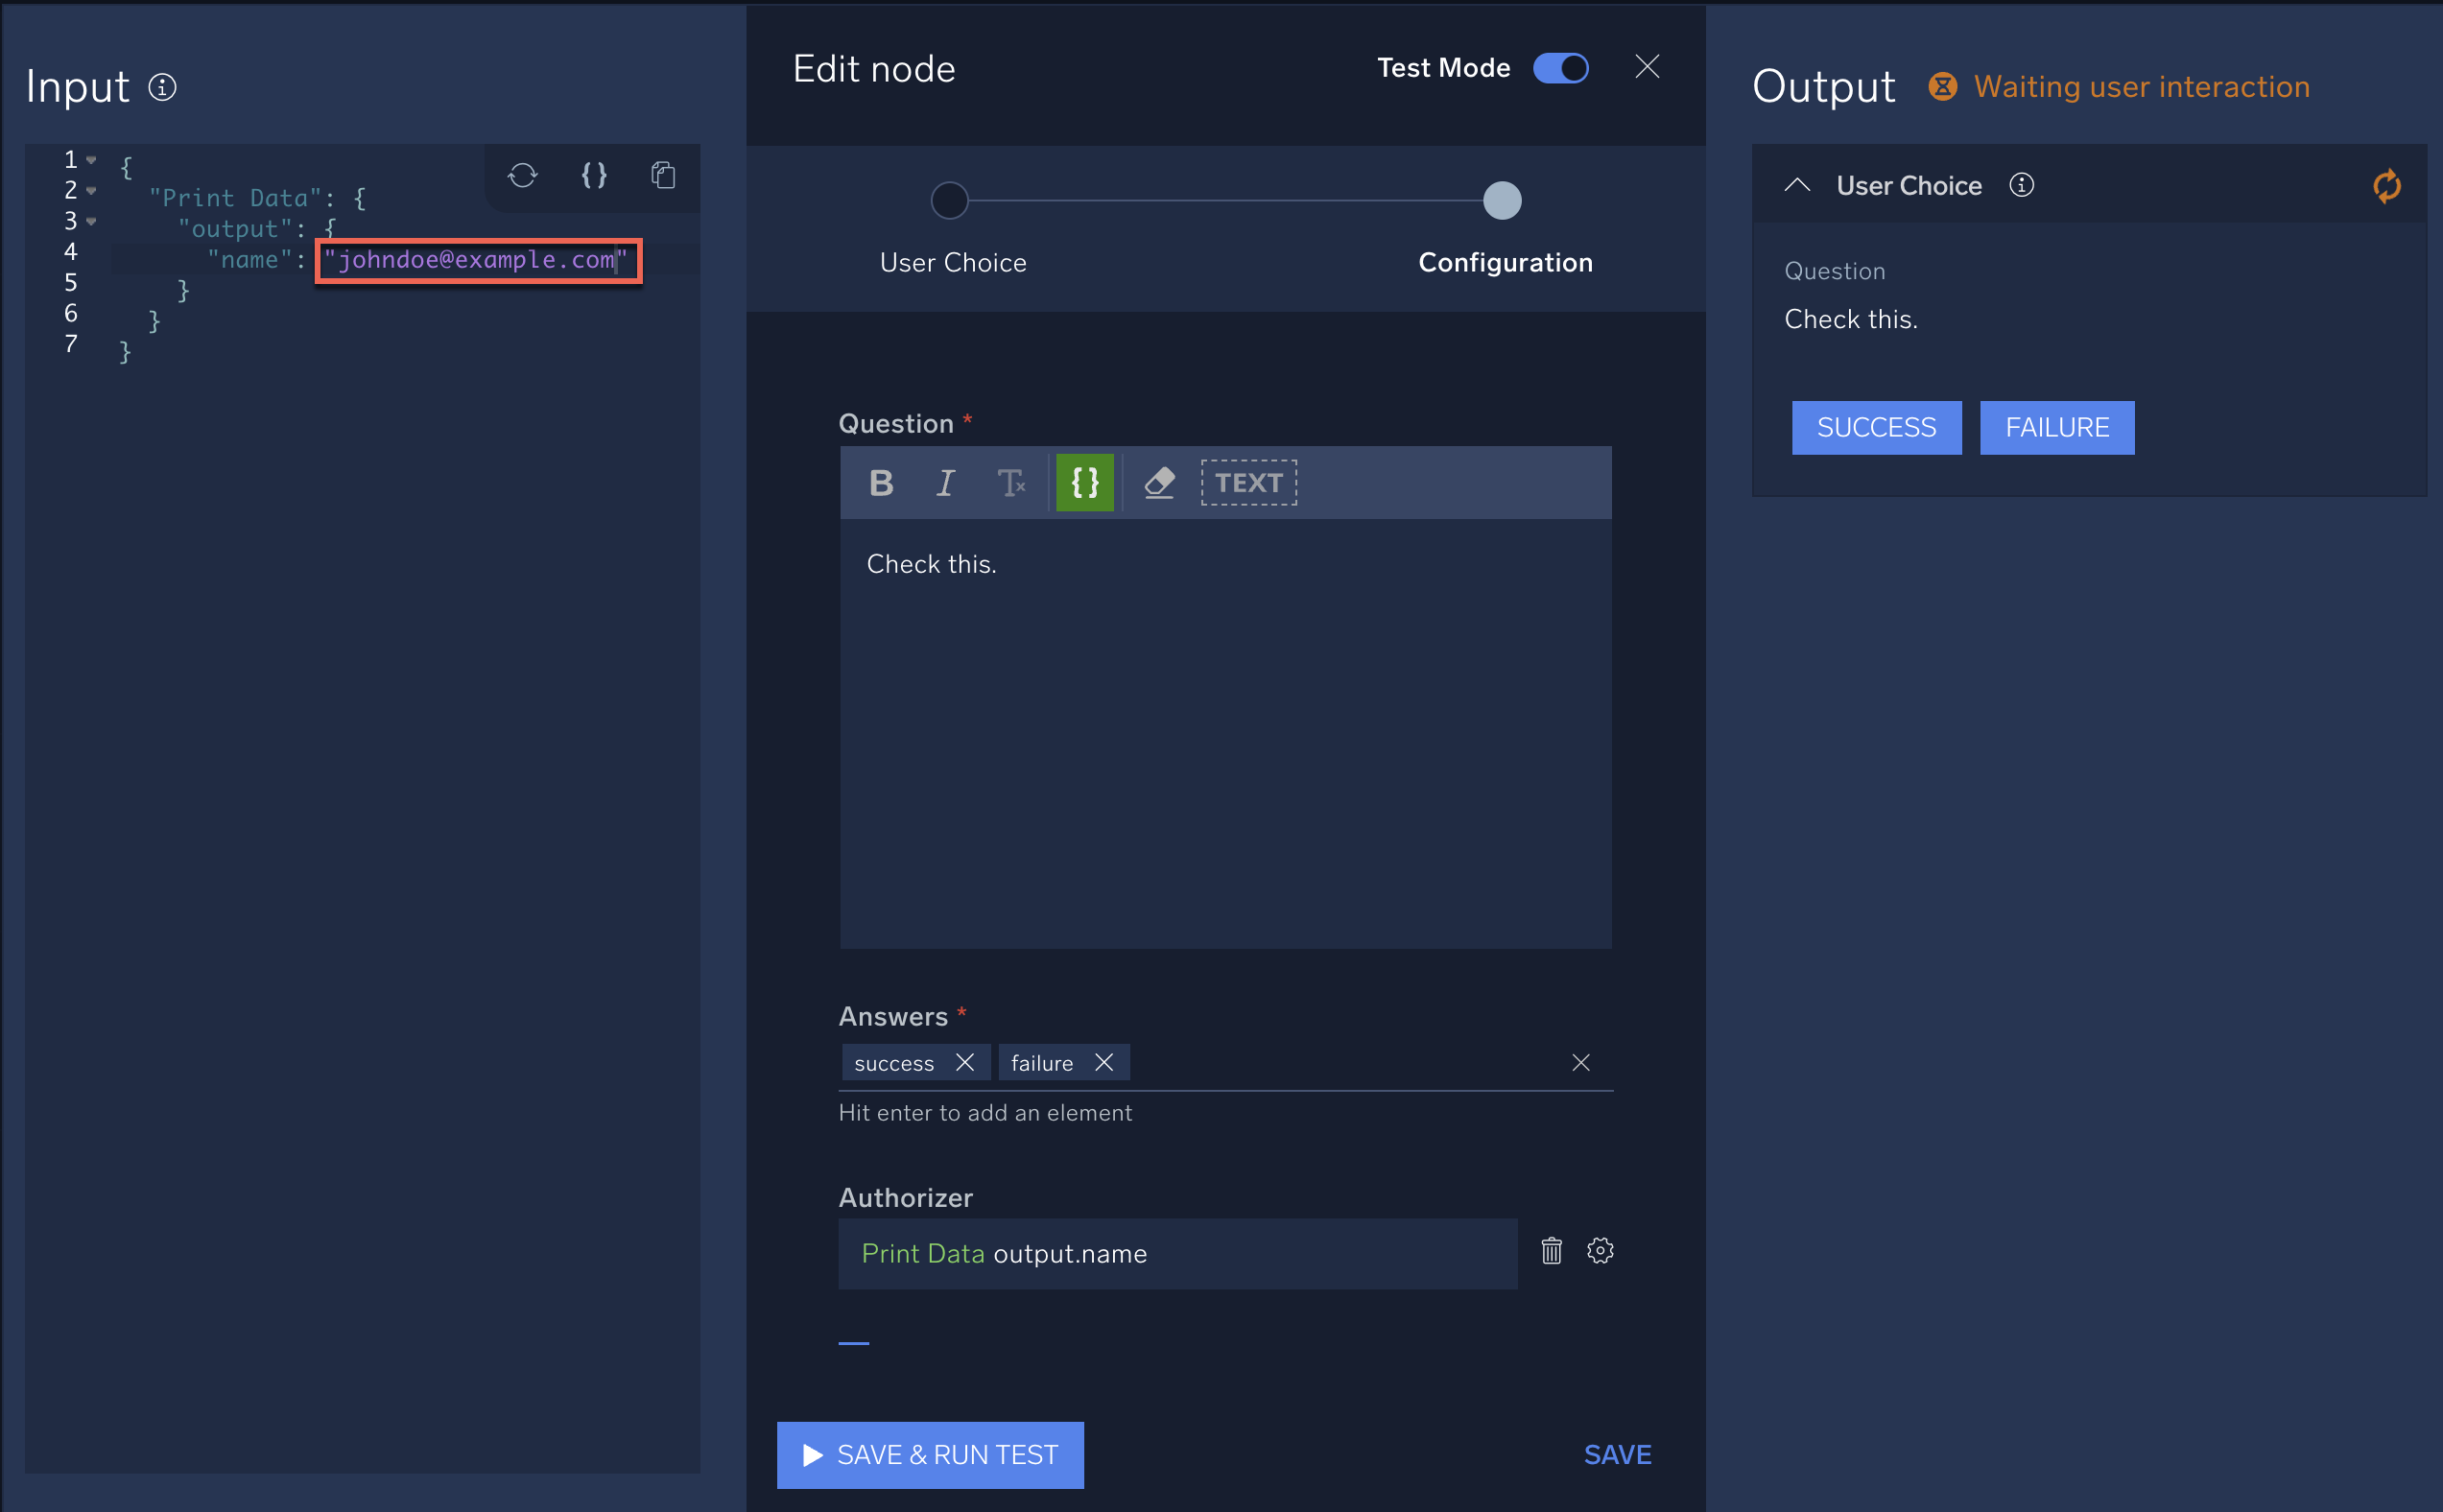
- Task
In the following example that uses incident input data, we provide a mock template name. The output provides the resulting task. Click the task options to test whether they work as expected.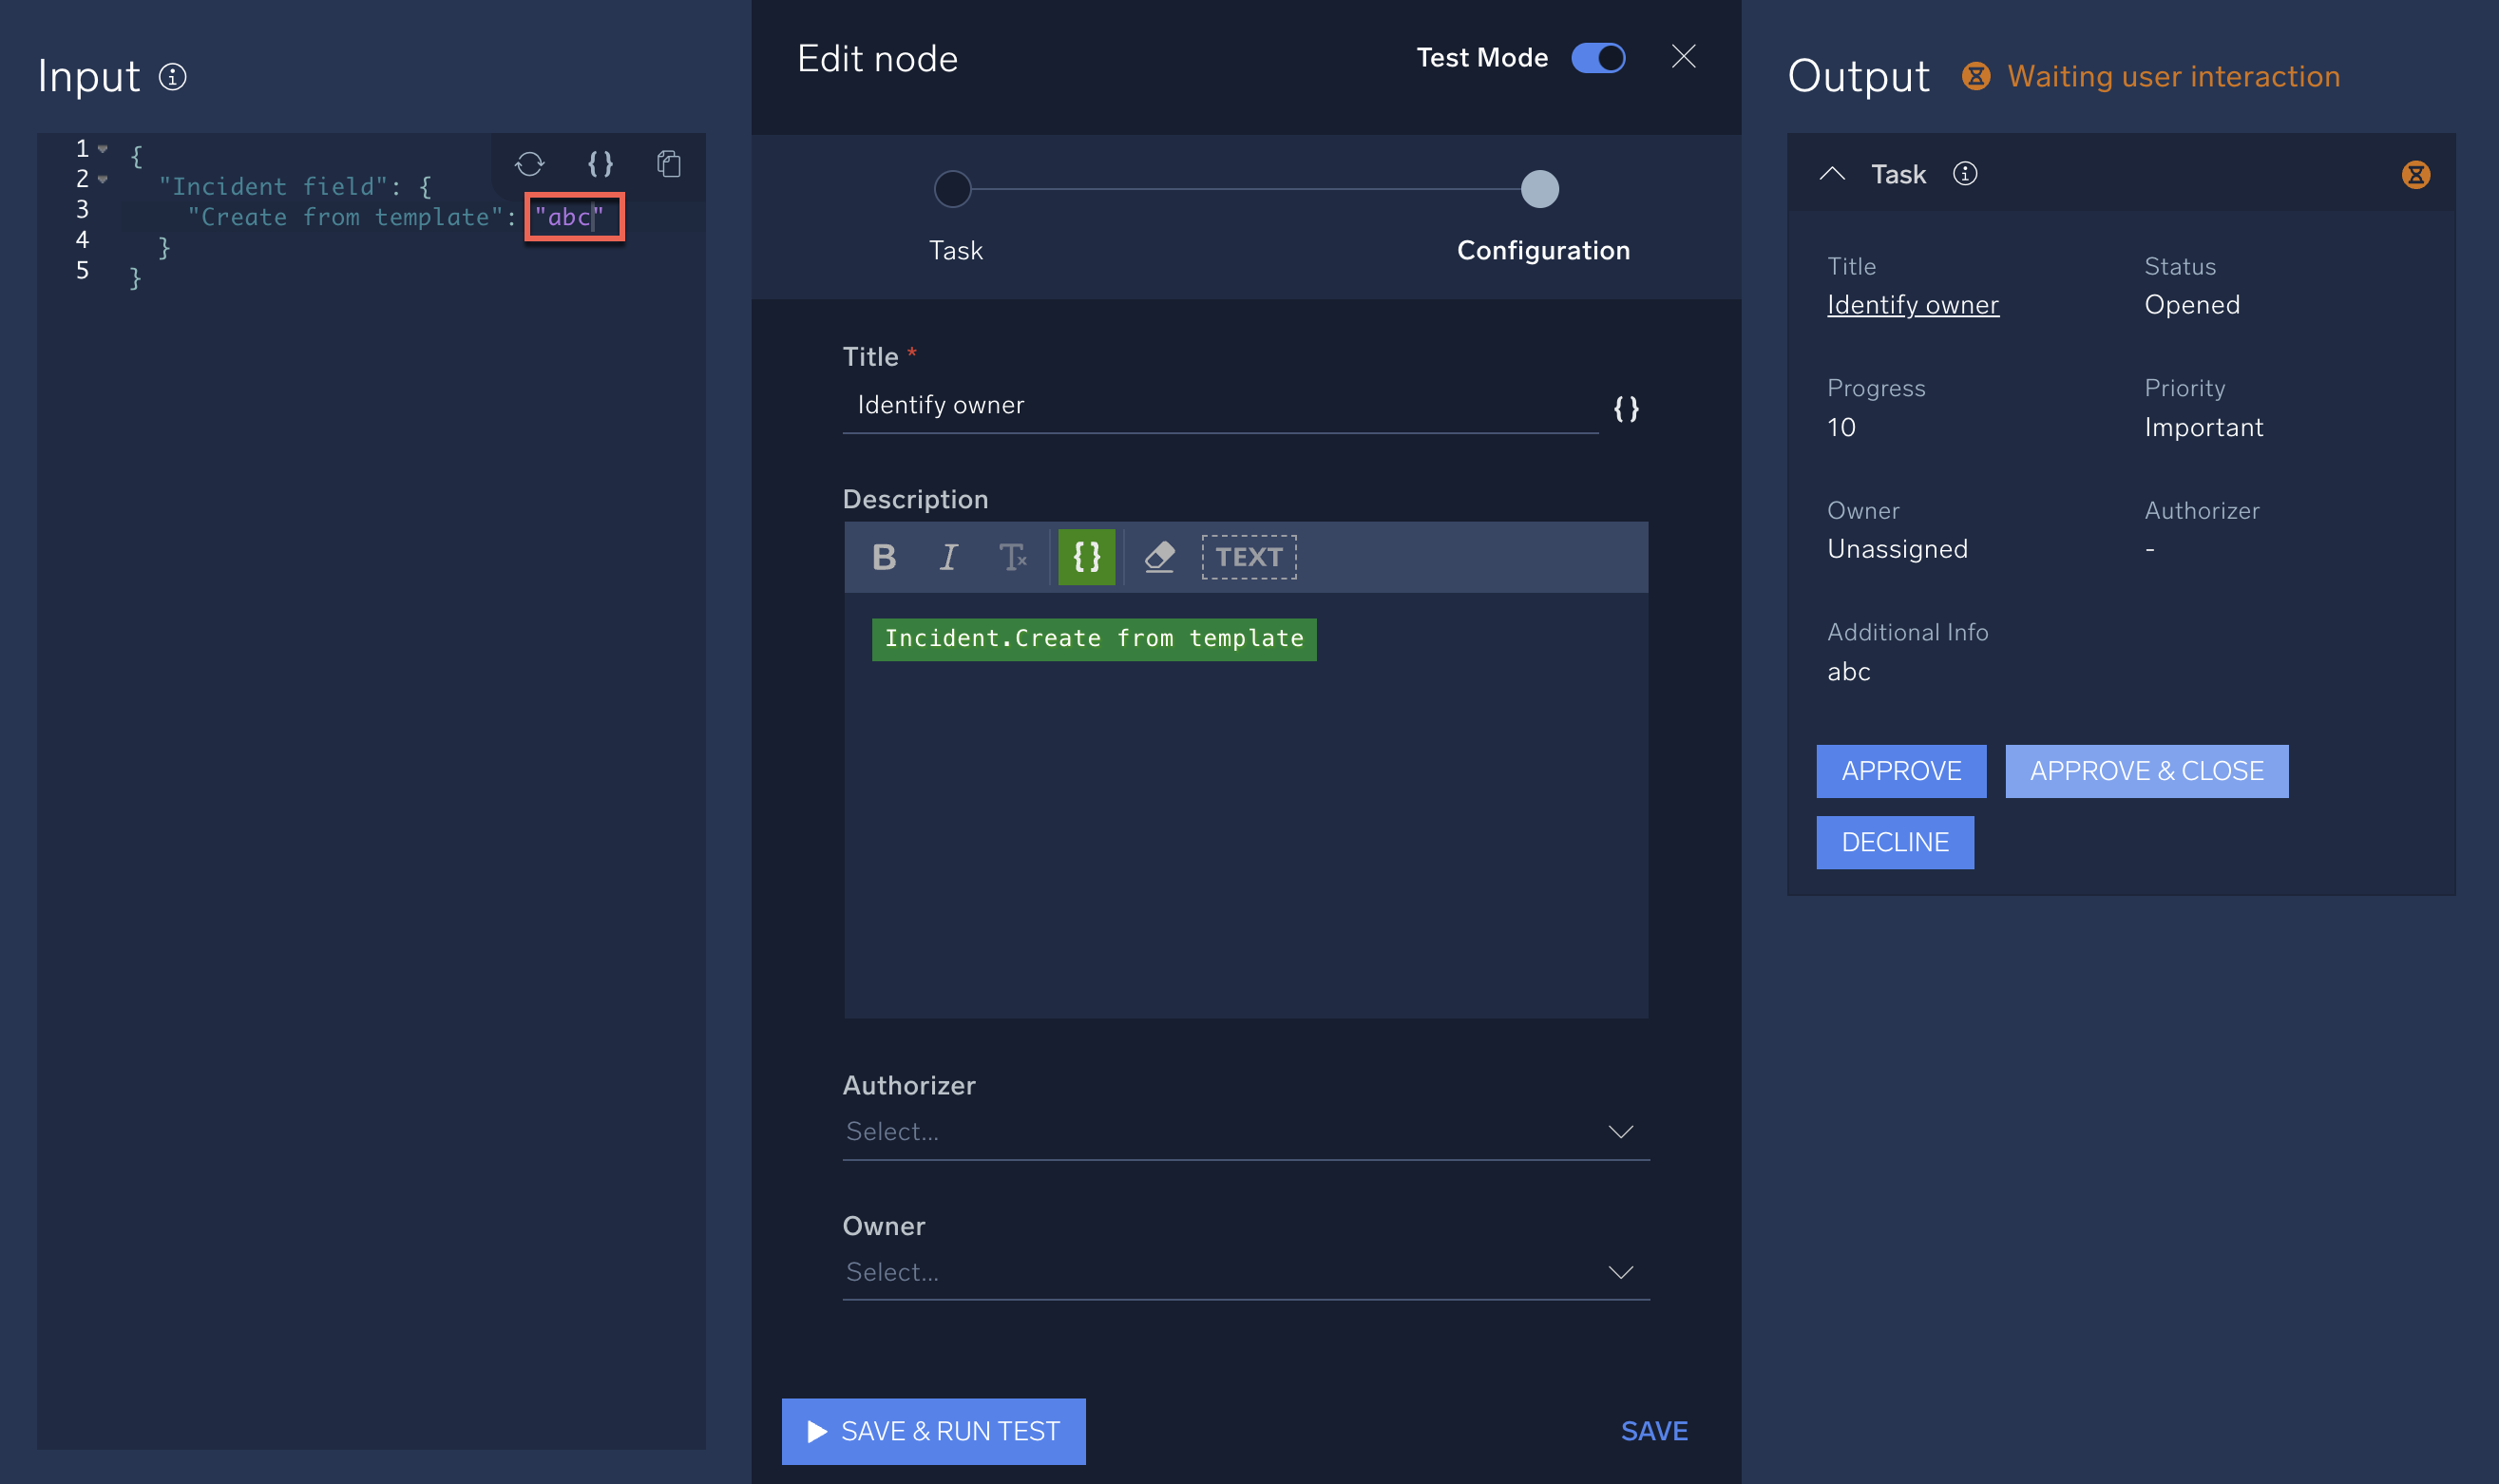
- Action
- Examine the results in the Output panel and take any action needed to troubleshoot node operation:
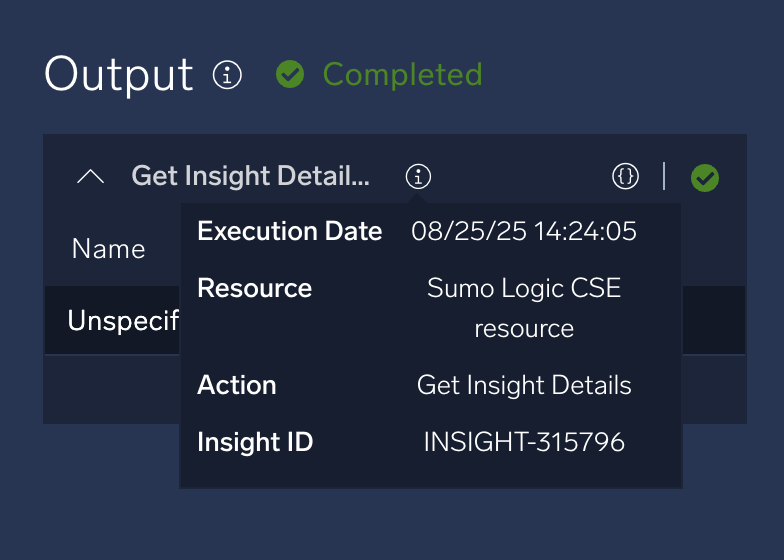
- Click the information button
 to see information on the test run:
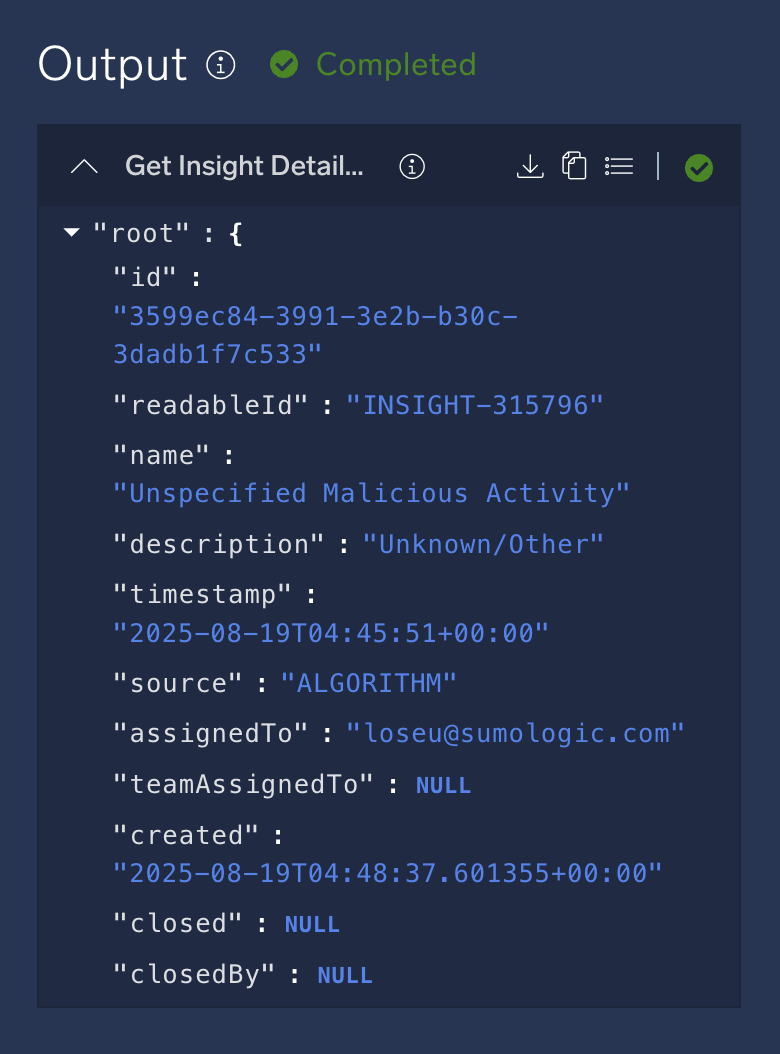
- Click the JSON details button
 to see the JSON output:
- Click the information button
- Continue testing the node and making changes as needed in the node's configuration. When done, click Save.
- Test each node in your playbook that has the Test Mode button (action, condition, user choice, and task). In each node, enter variables in the Input panel and examine the results in the Output panel to ensure the node works correctly.
After you're done testing individual nodes, test the entire playbook to ensure it runs end-to-end (see Test a playbook).
Test a playbook
You can test a playbook to verify that it works properly. The test results show the outcome as if the playbook actually ran.
- Select a playbook.
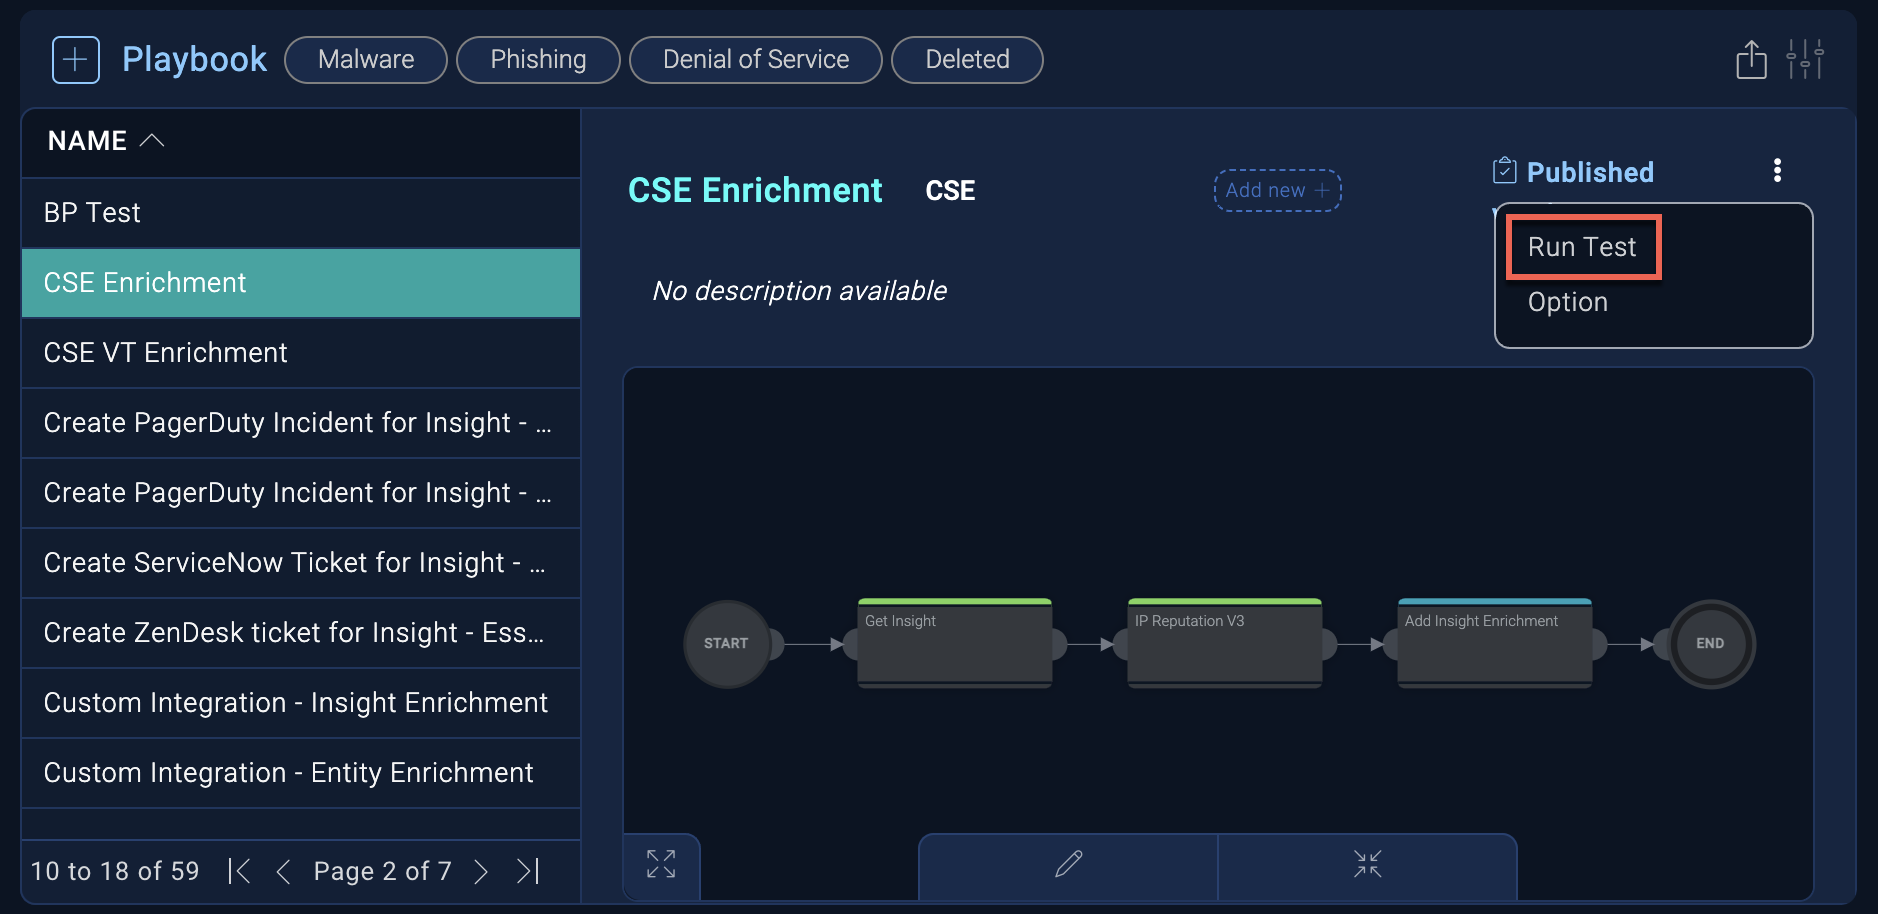
- Click the kebab button in the upper-right corner of the UI.
- Select Run Test.
- In the Test playbook dialog, enter the requested information and click Run.
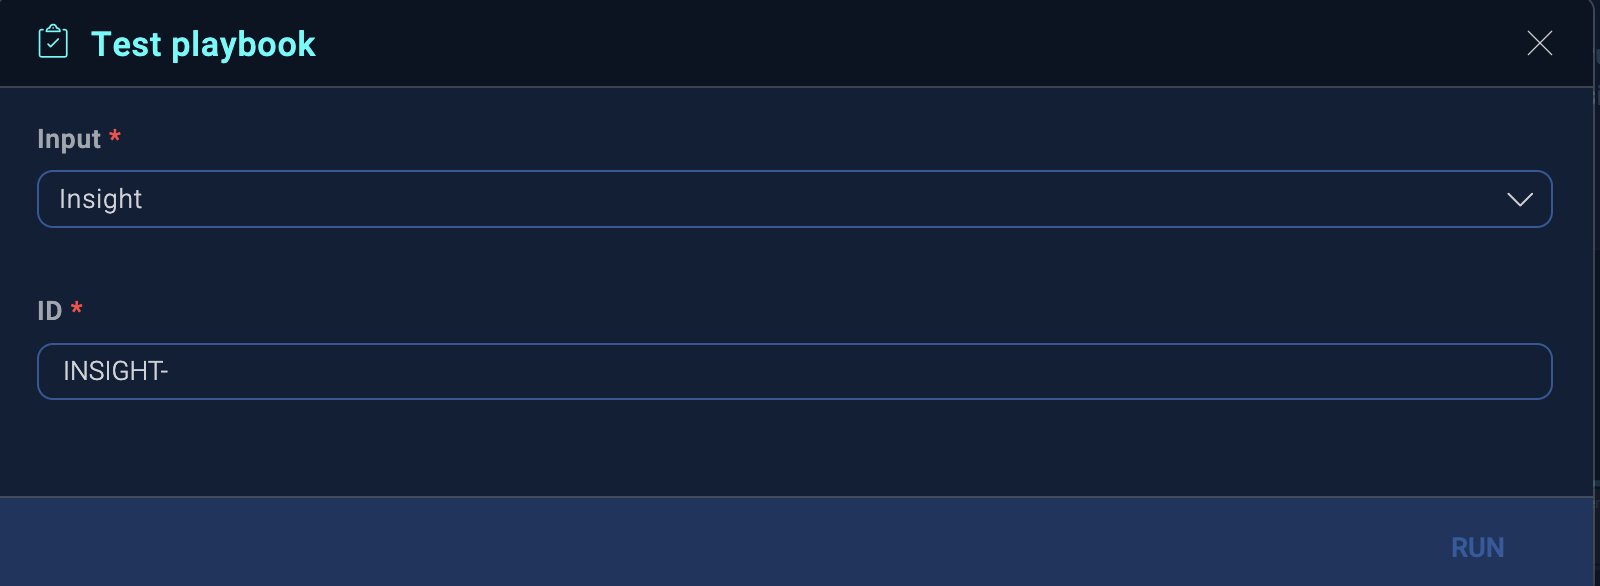
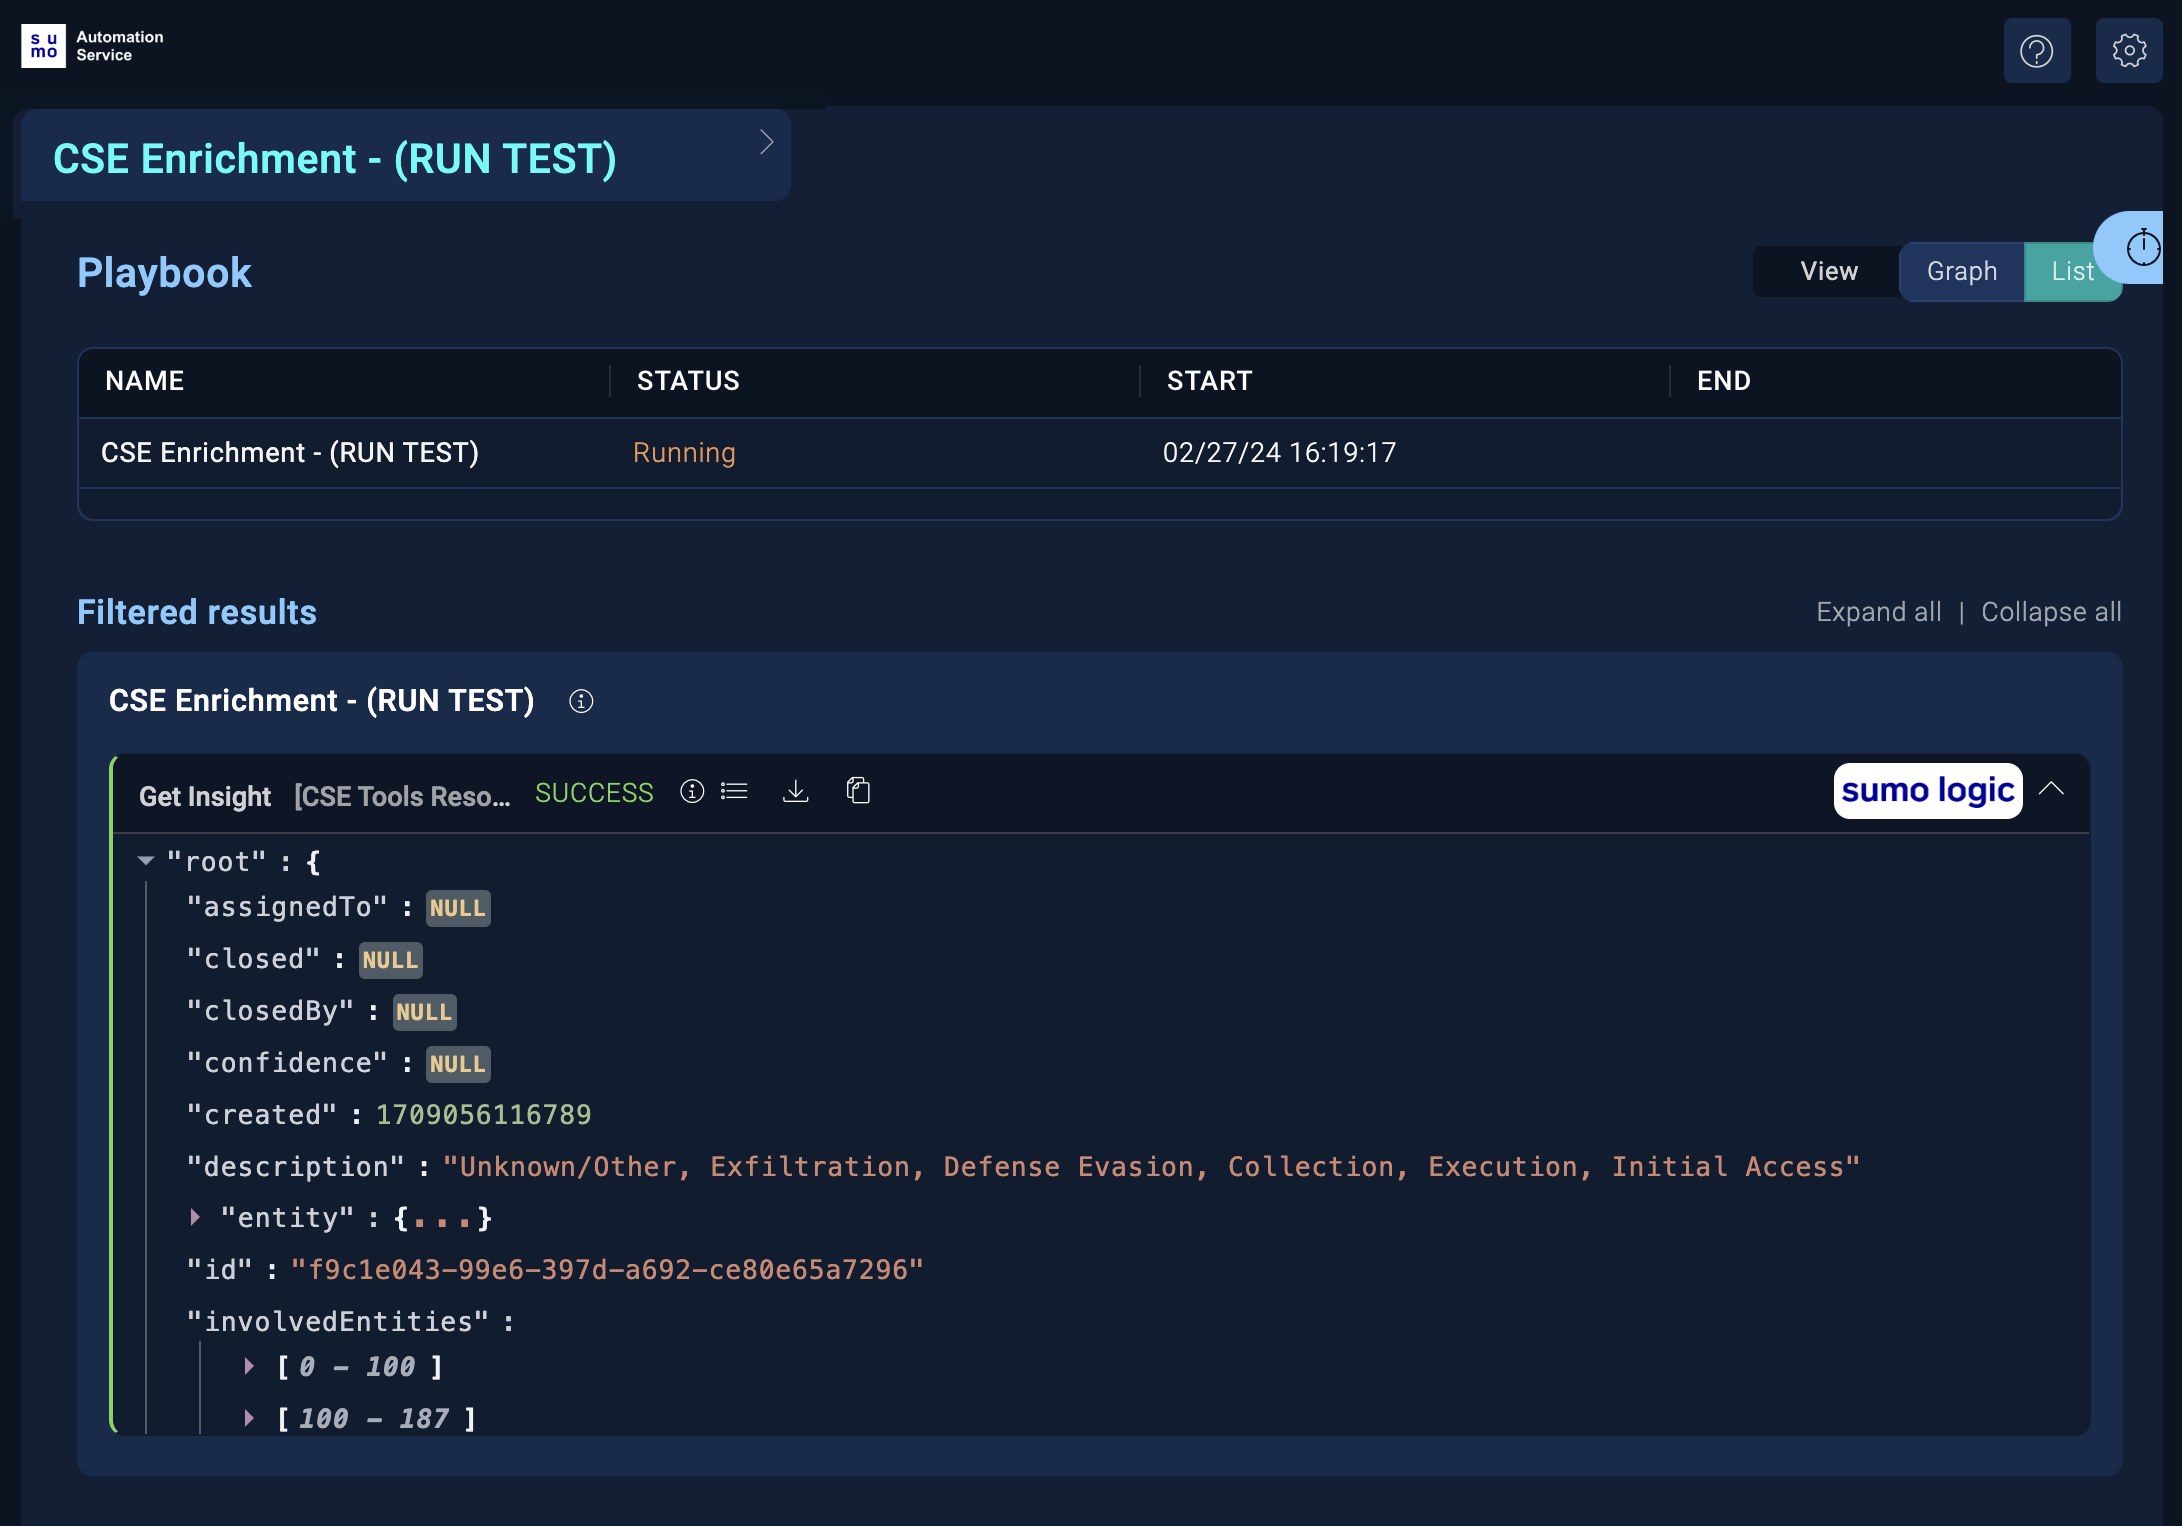
- The results of the test are displayed in a new window labeled with the playbook name and (RUN TEST).
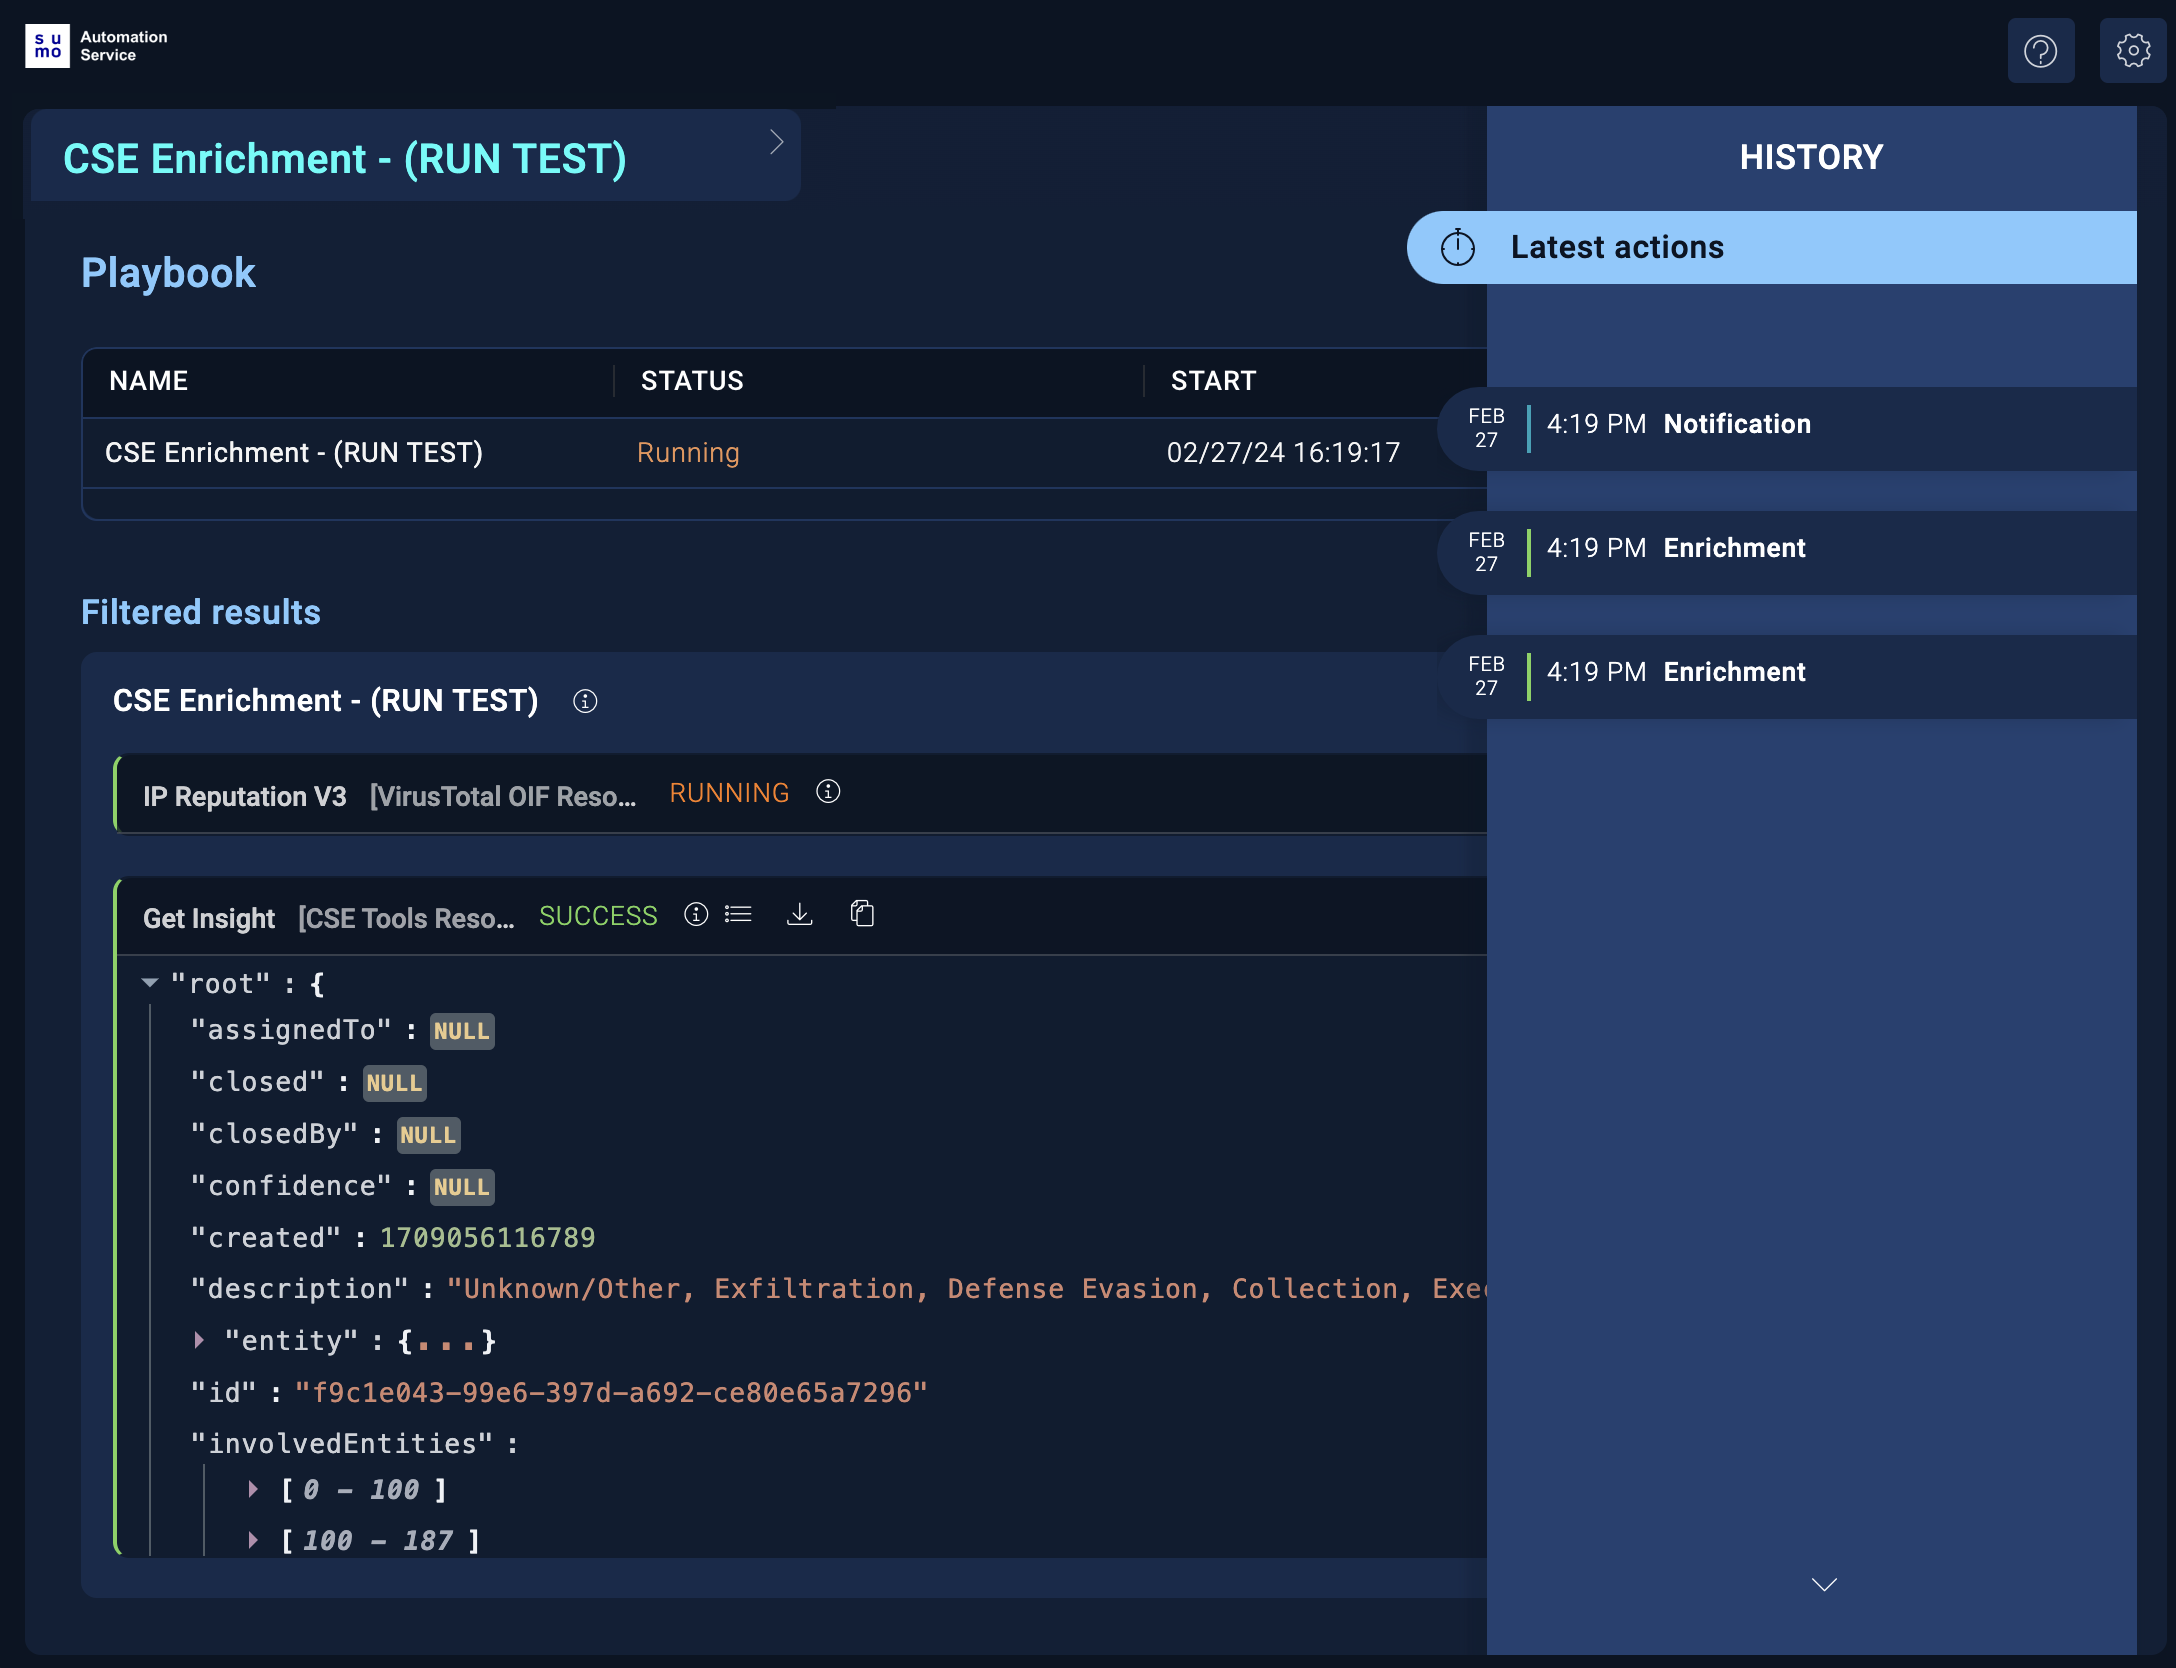
- Click the clock icon in the upper-right corner to see the testing history. Select Latest actions to see test results for all the actions on the playbook, or select items on the list to see results for individual actions.
Open playbooks that require investigation
Open a playbook from an alert
- Access the alert list.
- Open an alert that uses a playbook.
- On the alert details page, click the Playbooks button to see automated playbooks attached to the alert.
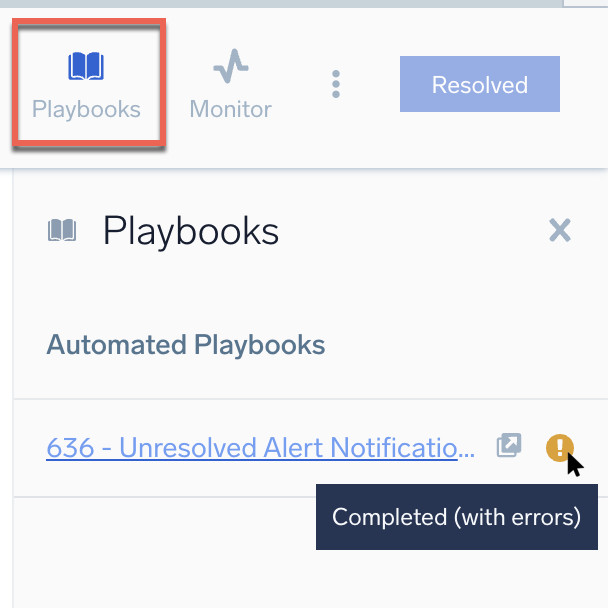
- Hover your mouse over the icon to the right of the playbook to see its status. In the example above, the playbook completed with errors.
- To investigate the problem, click the playbook name. The playbook opens in the Automation Service and any issues display in the results section.
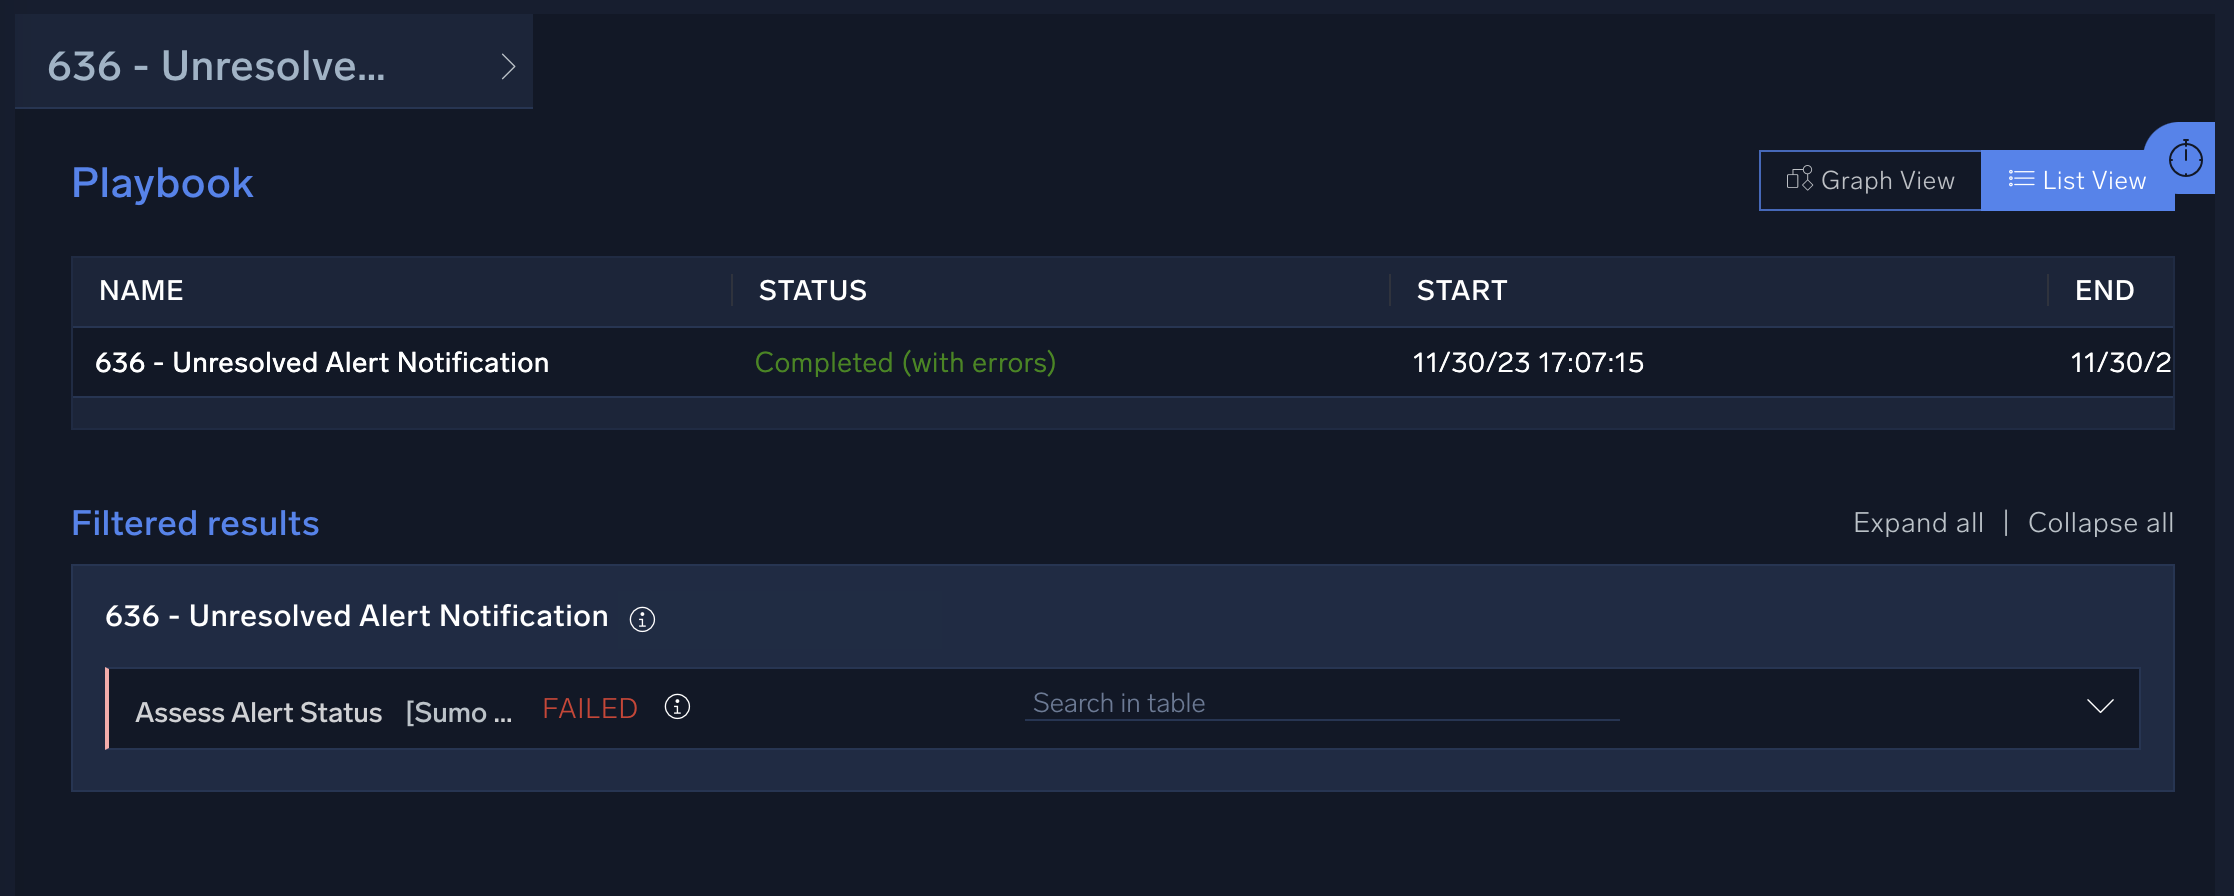
Proceed to Investigate playbook problems below to look into playbook problems.
Open a playbook from Cloud SIEM
- Open an Insight or Entity that uses playbooks (that is, that has automations).
- Click the Automations button at the top of the page to view the automations on the Insight or Entity.
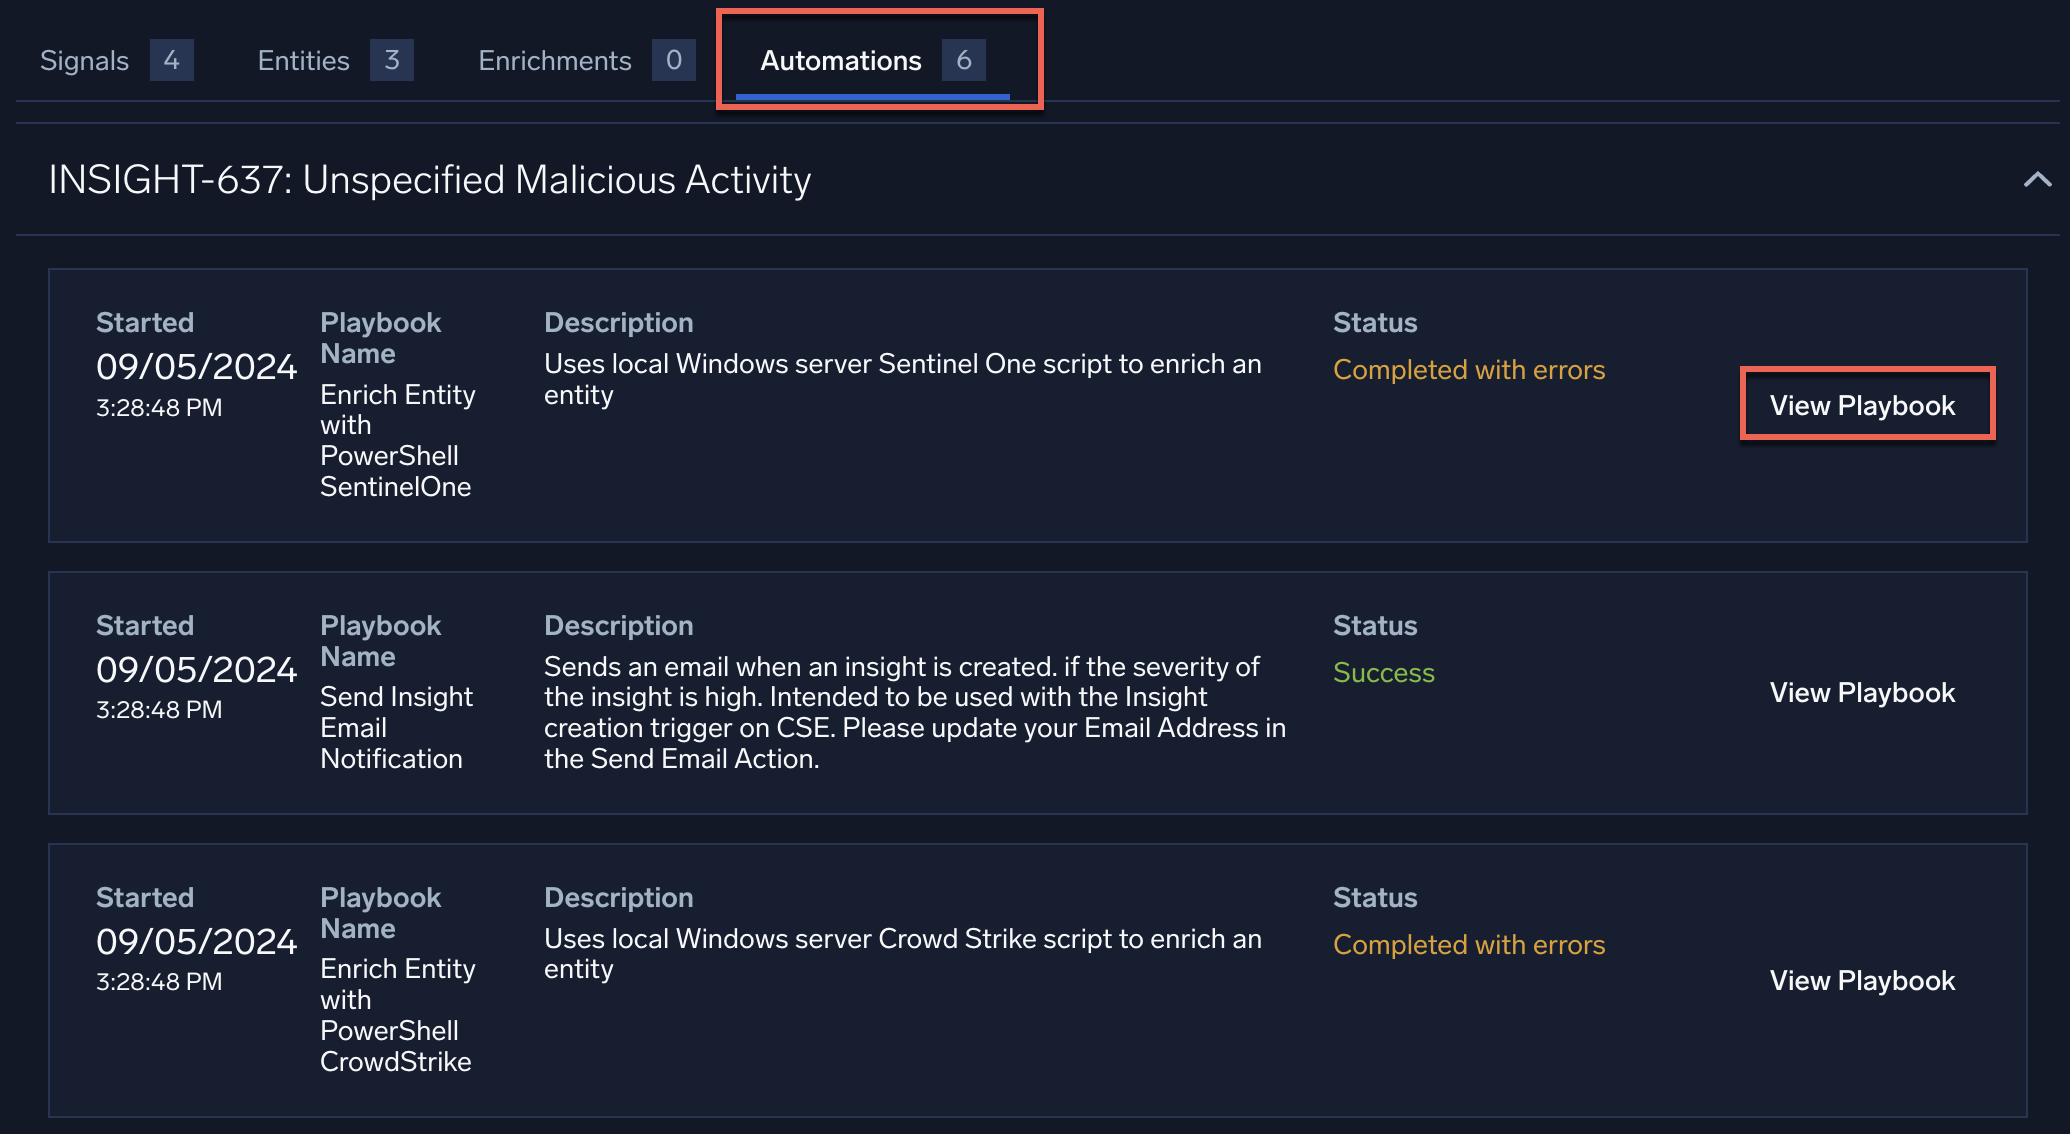
- Click View Playbook for a playbook you want to investigate. In the example above, the playbook we want to investigate completed with errors. The playbook opens in the Automation Service, and the issues display in the results section.
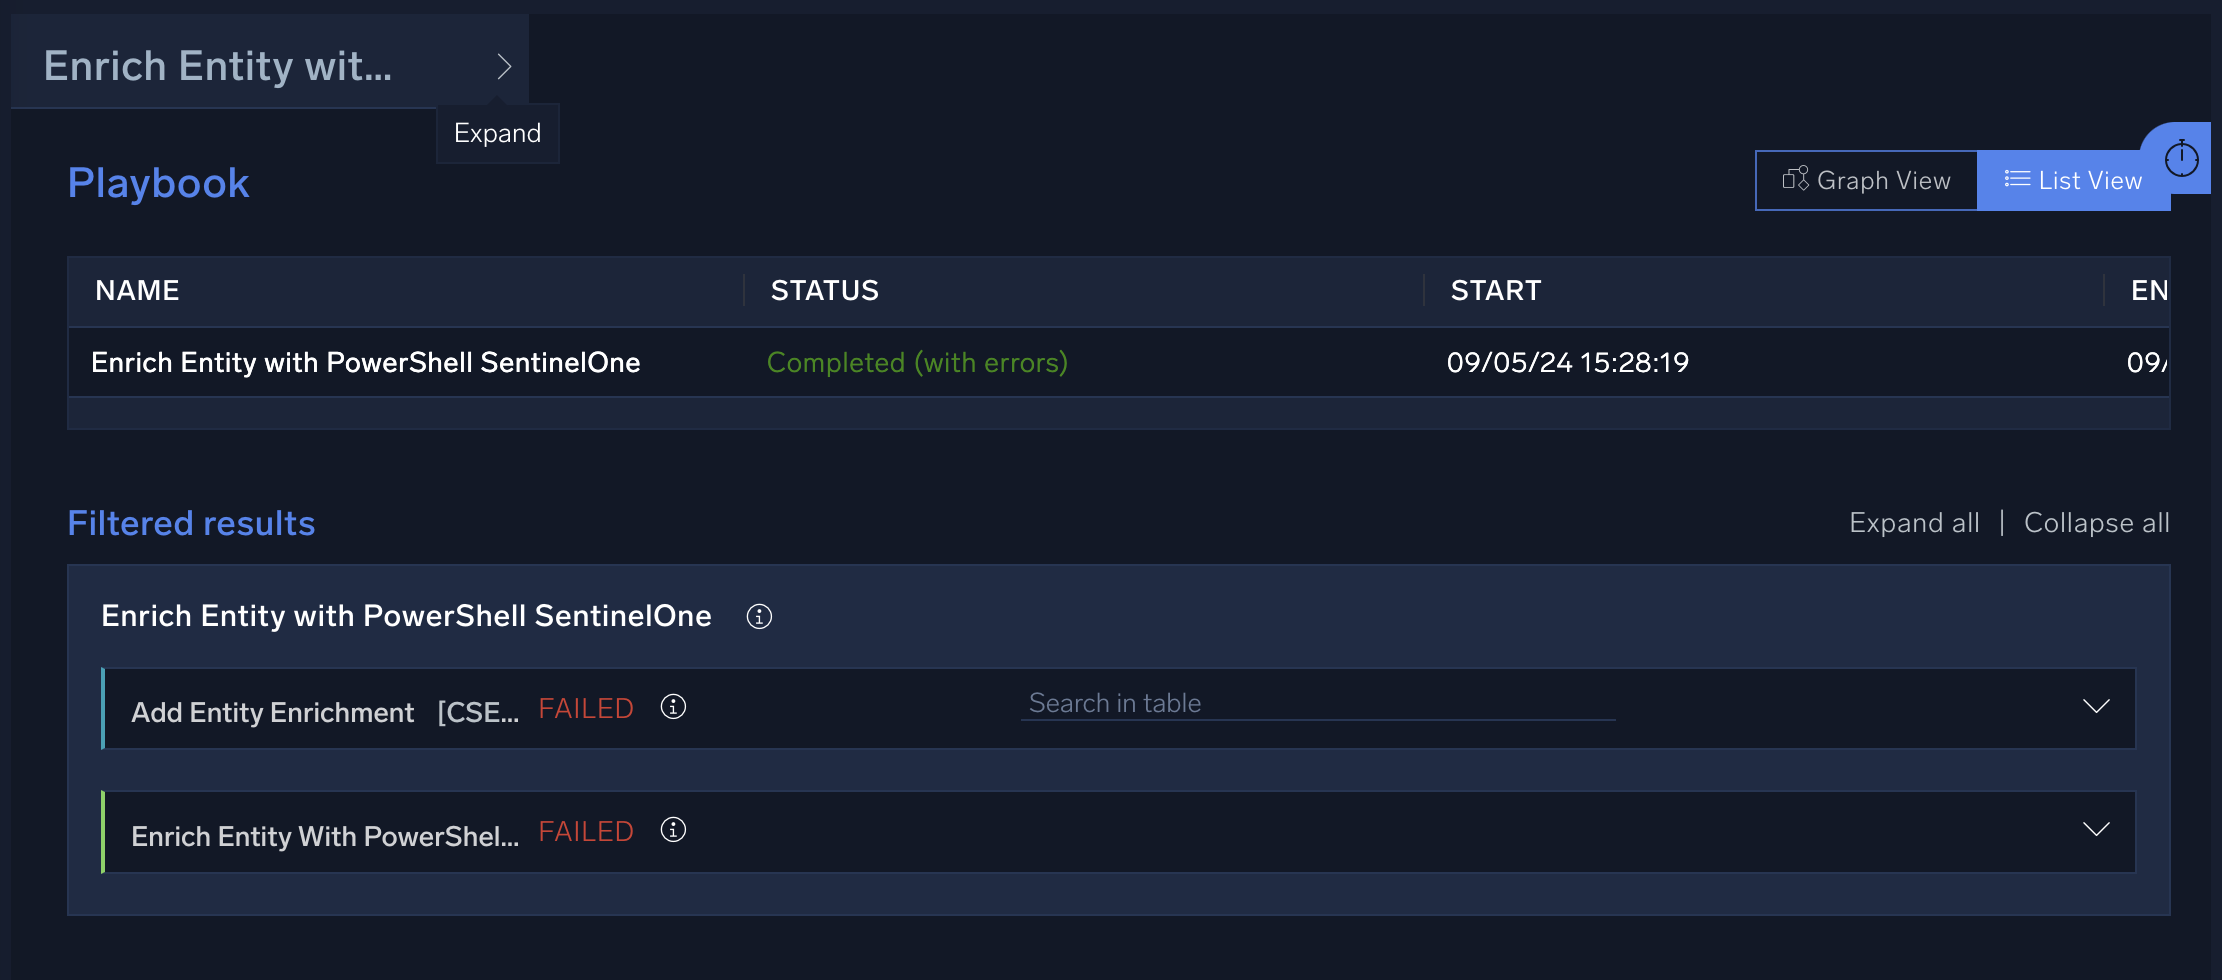
Proceed to Investigate playbook problems below to look into playbook problems.
Open a playbook from Cloud SOAR
- Open an Incident.
- On the incident details page, select Operations > Playbooks. Playbooks appear that have run for the incident.
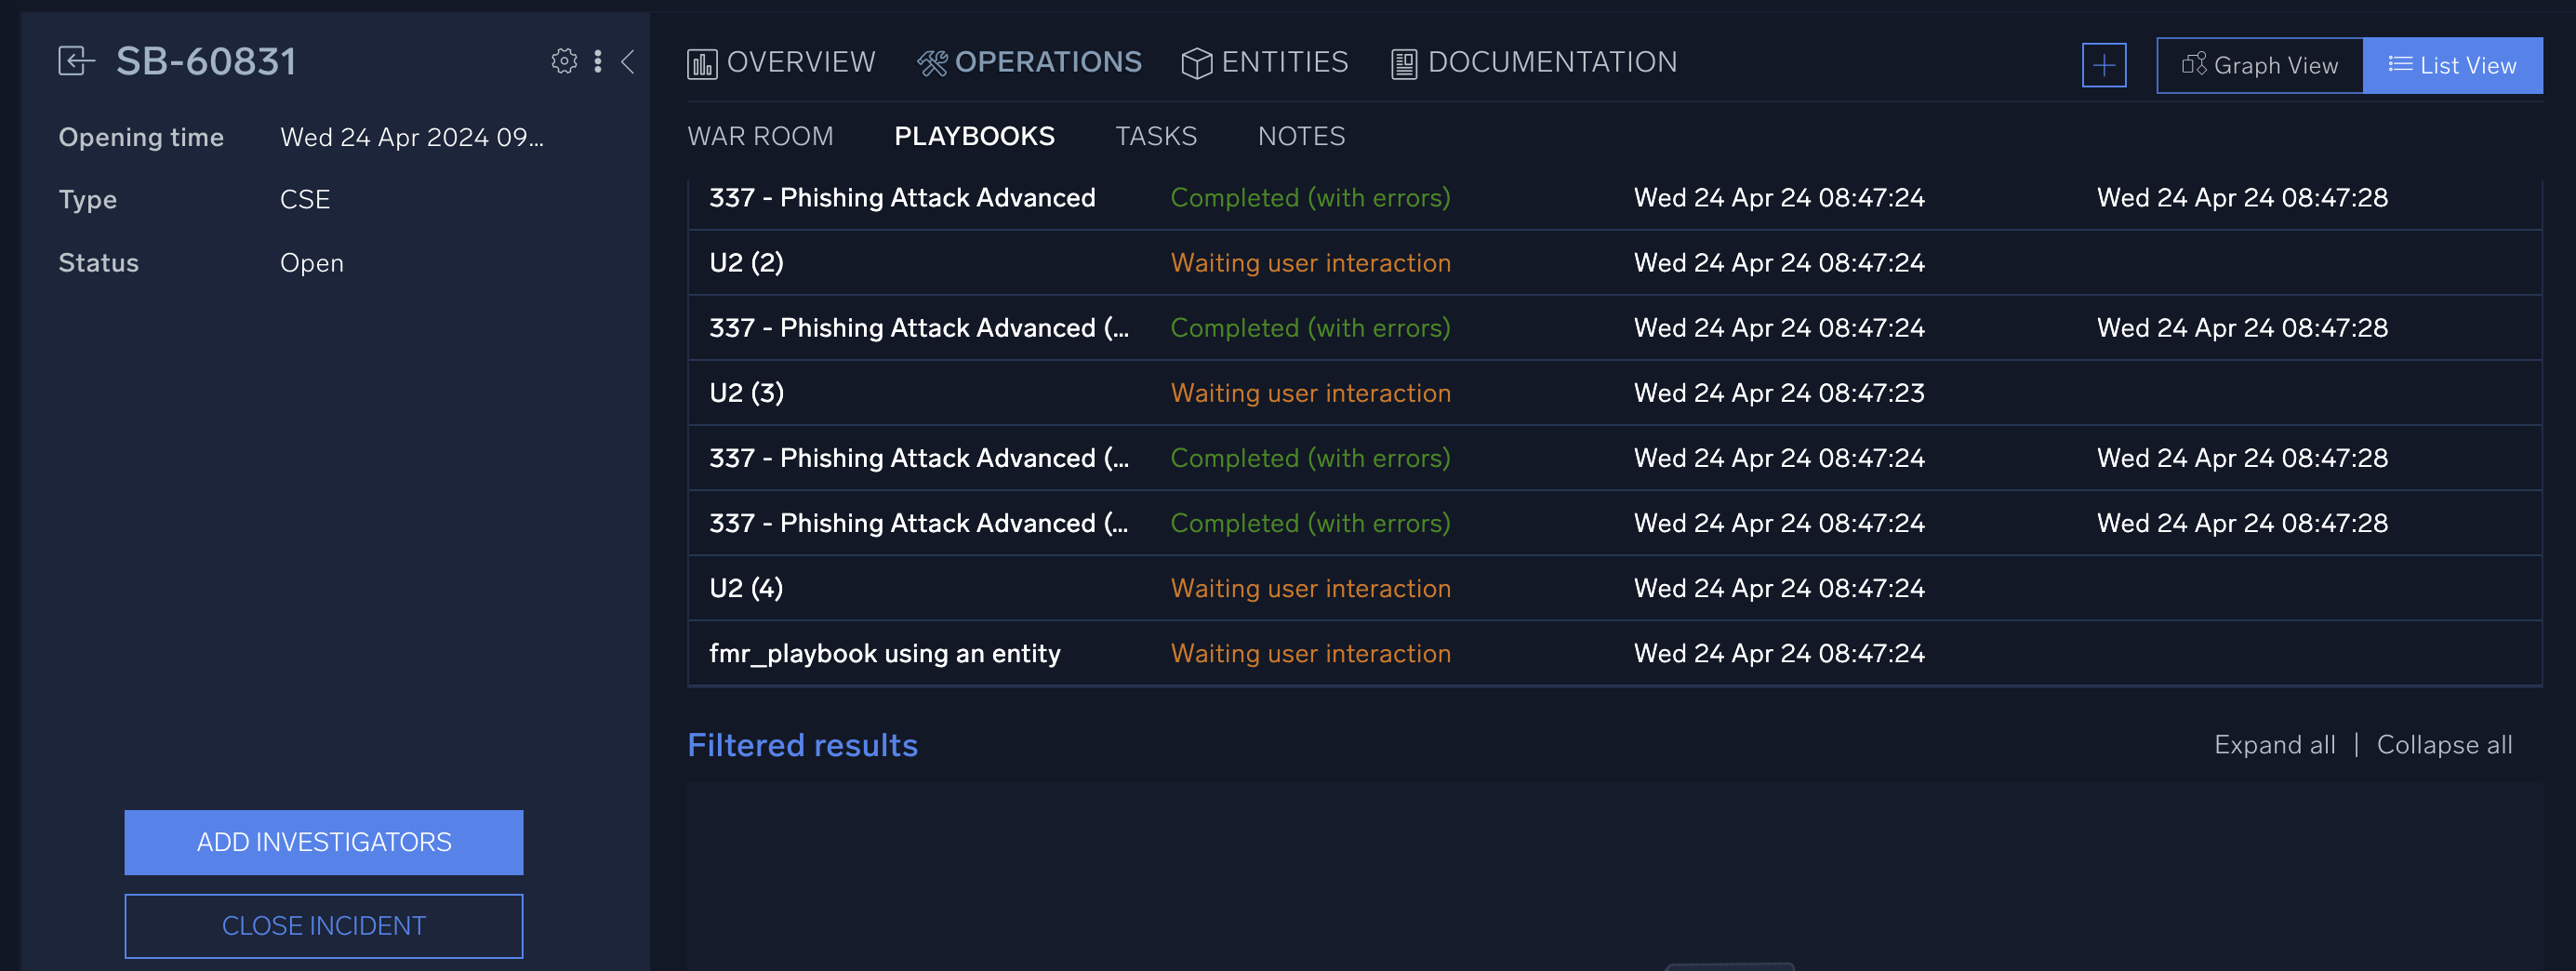
- Click Graph View in the upper-right and click > to page through the playbooks.
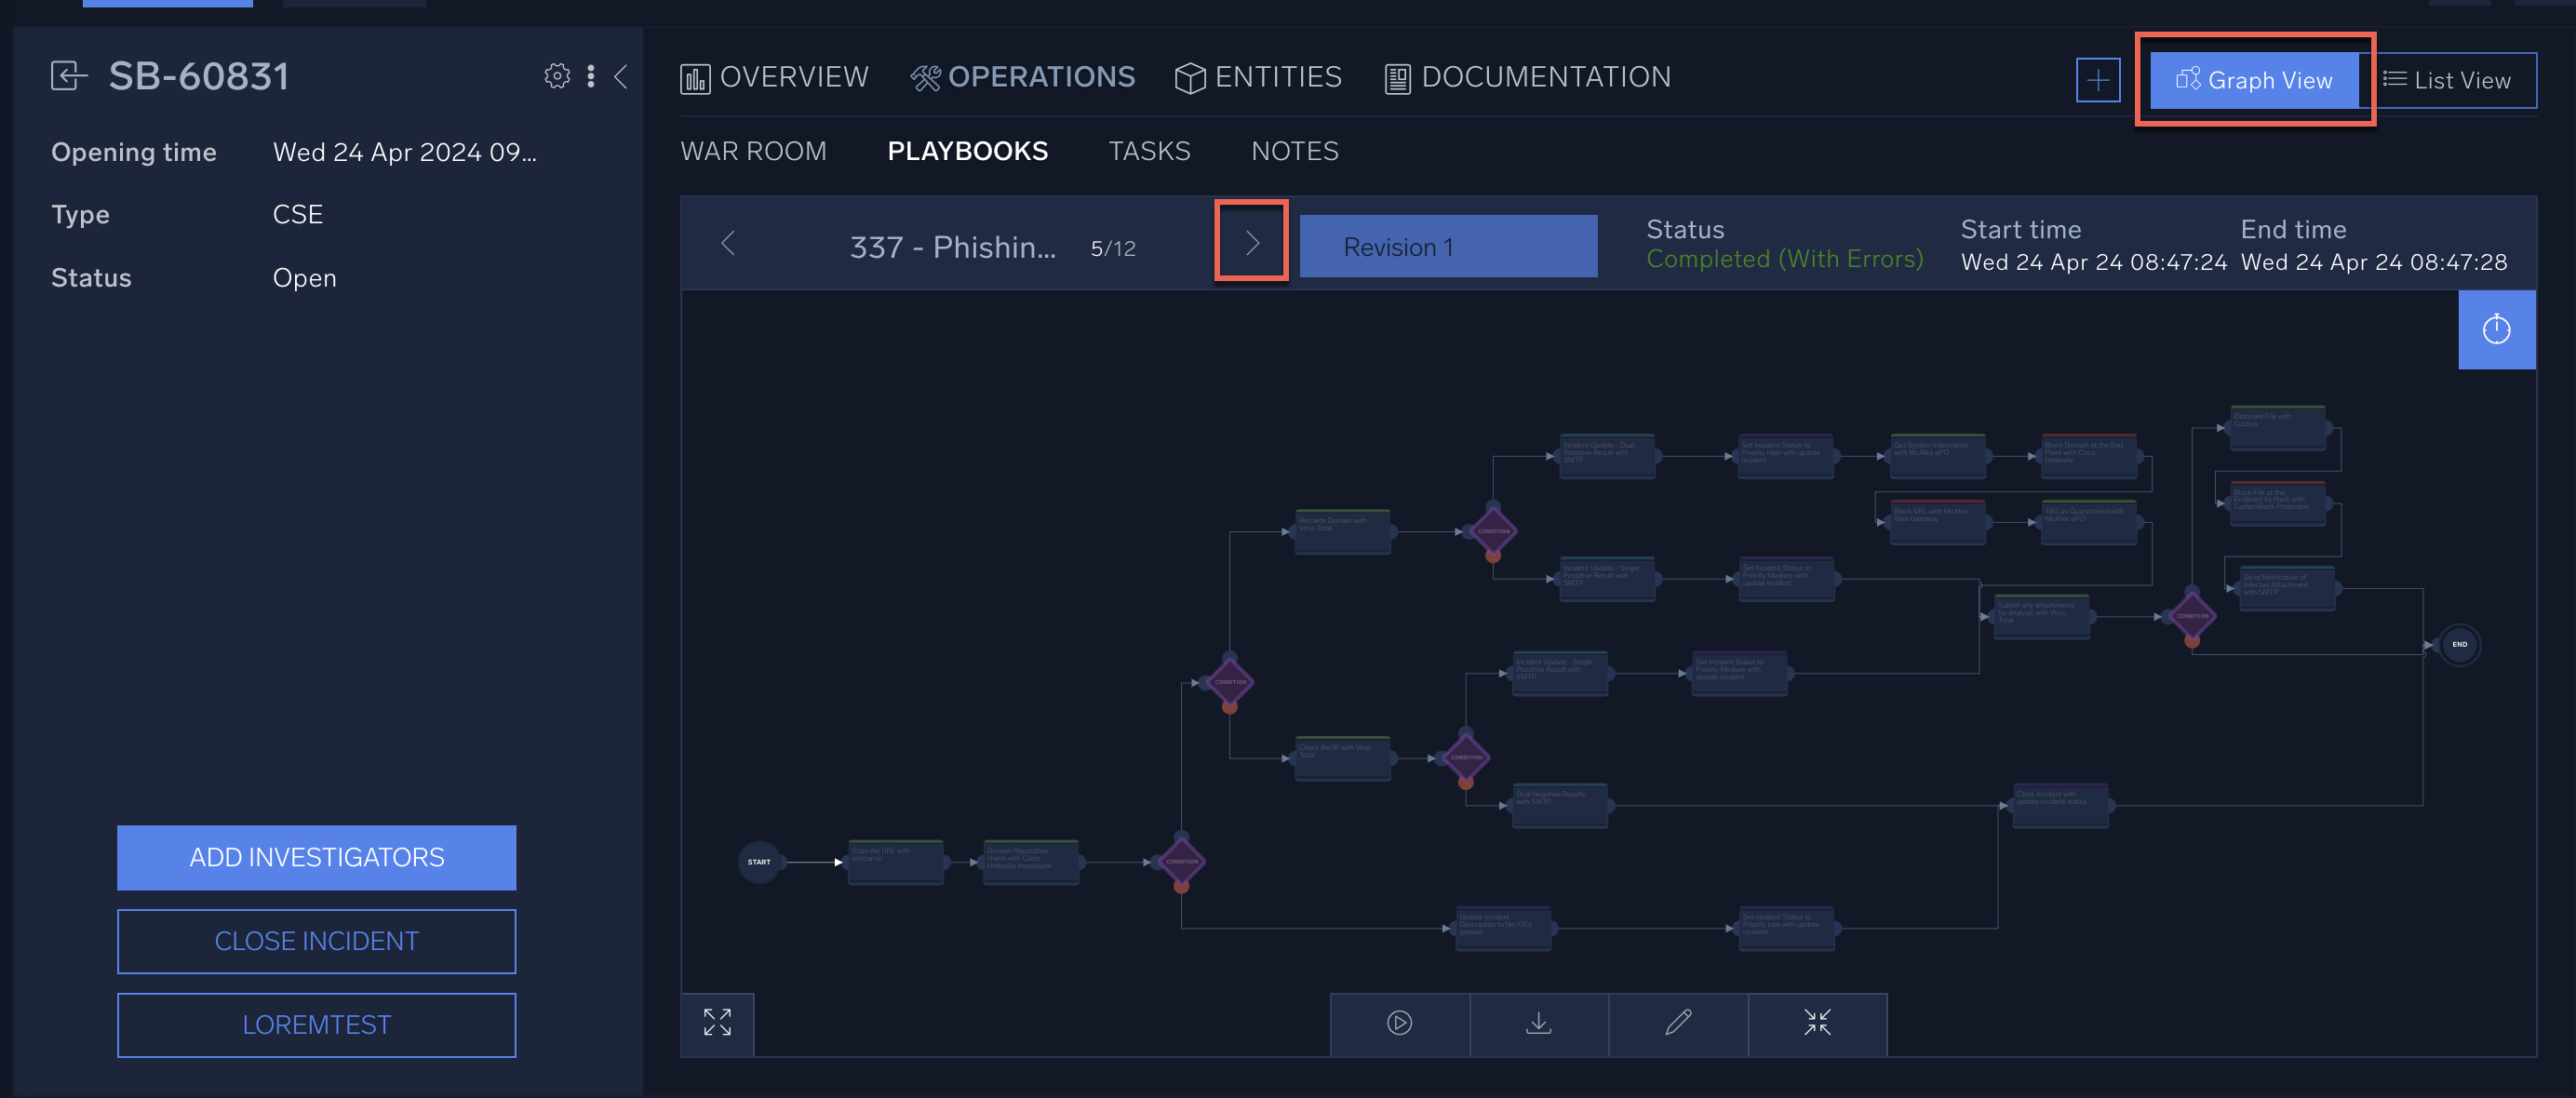
- Click a node on the playbook that displays an error.
Proceed to Investigate playbook problems below to look into playbook problems.
Investigate playbook problems
After you have opened a playbook that requires investigation, follow the steps below to investigate problems with the playbook.
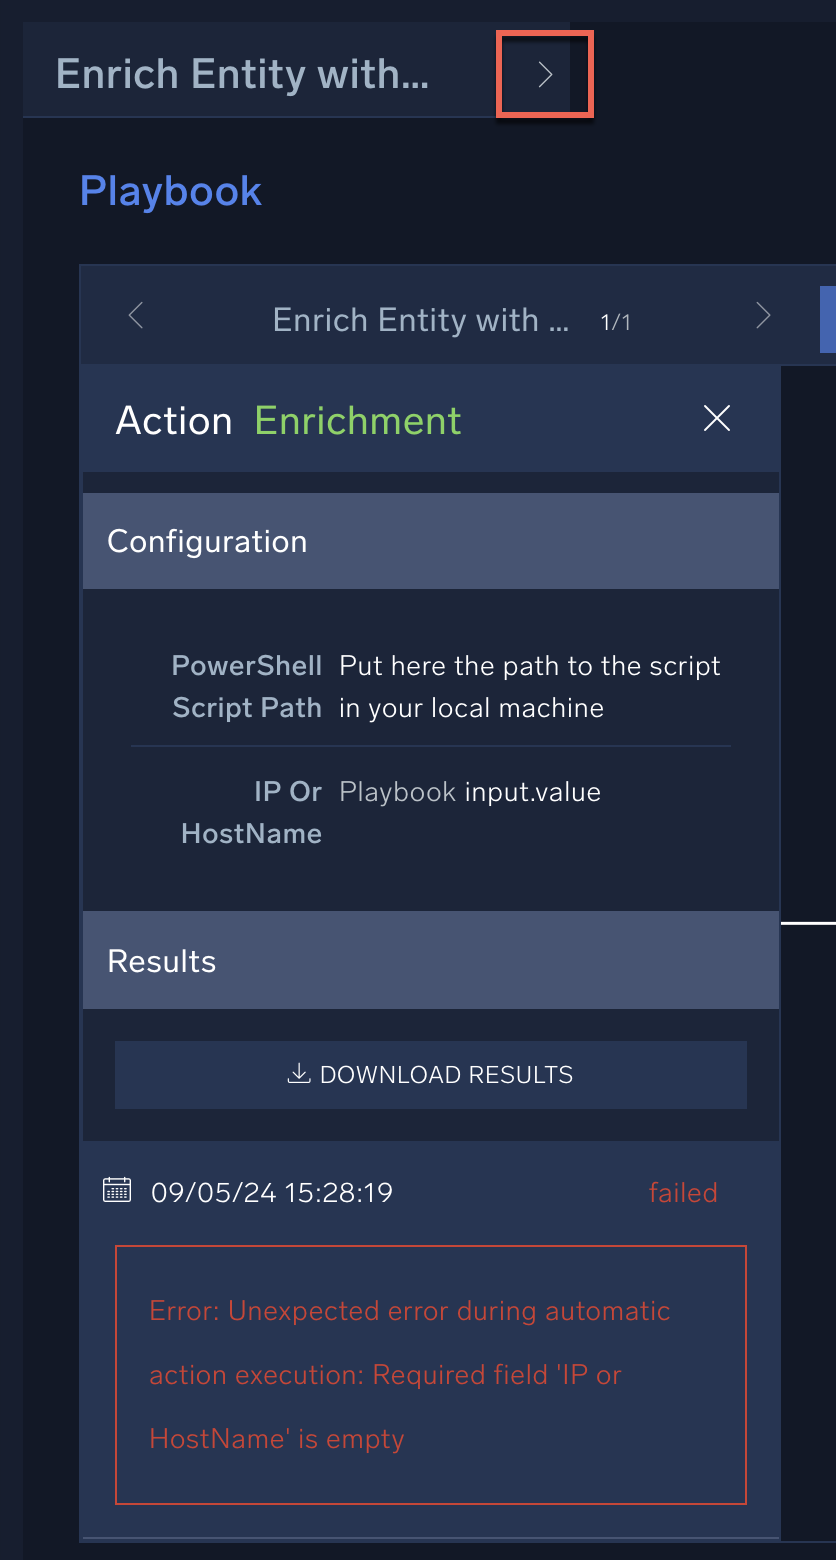
- The Filtered Results section shows the status of actions that ran on the playbook. The example below shows two failed actions that require investigation.
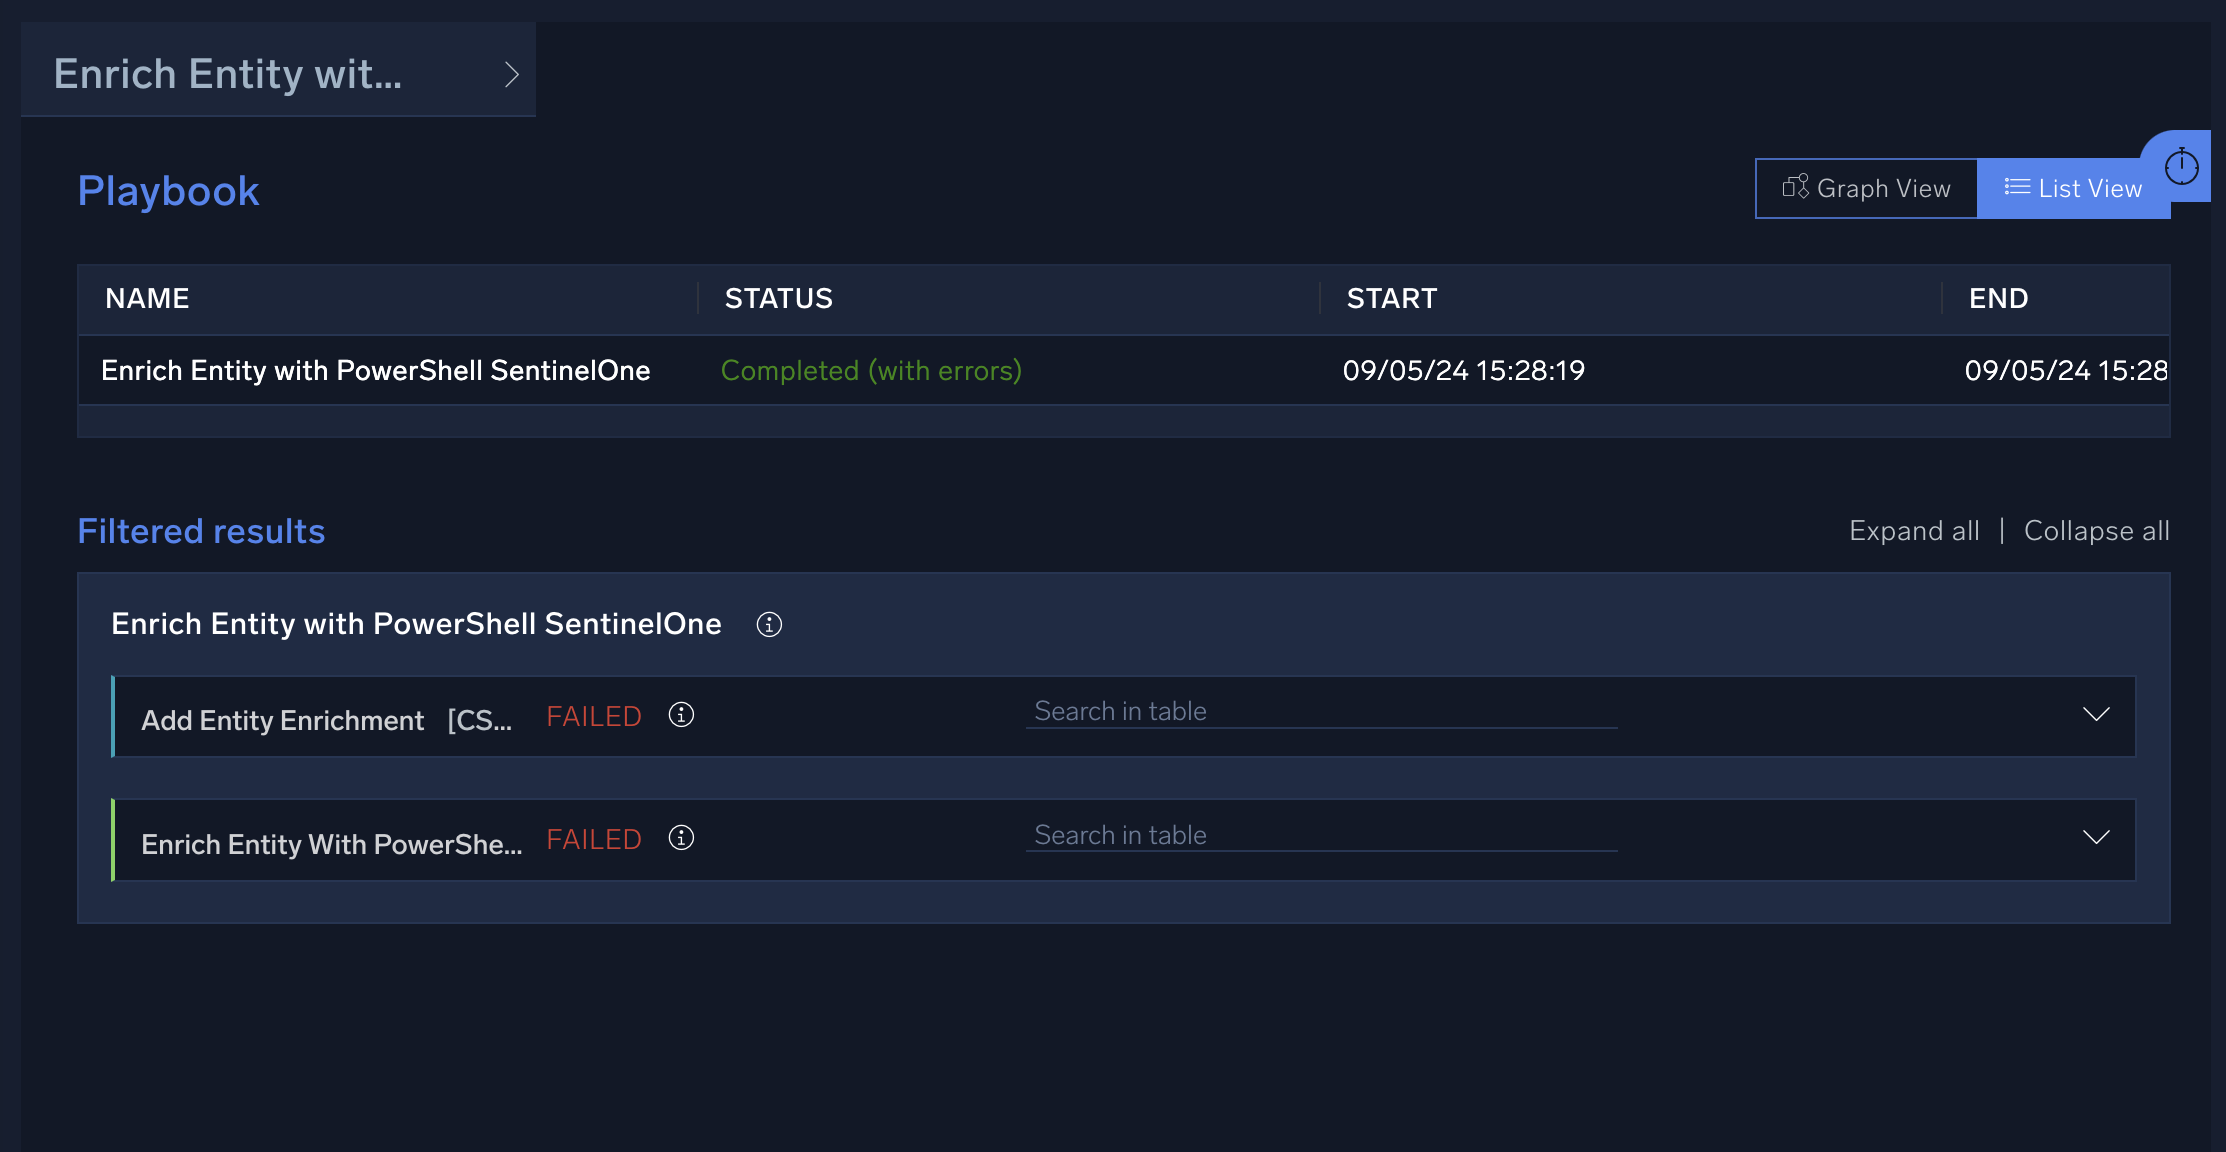
- Click an action for an explanation of the problem.
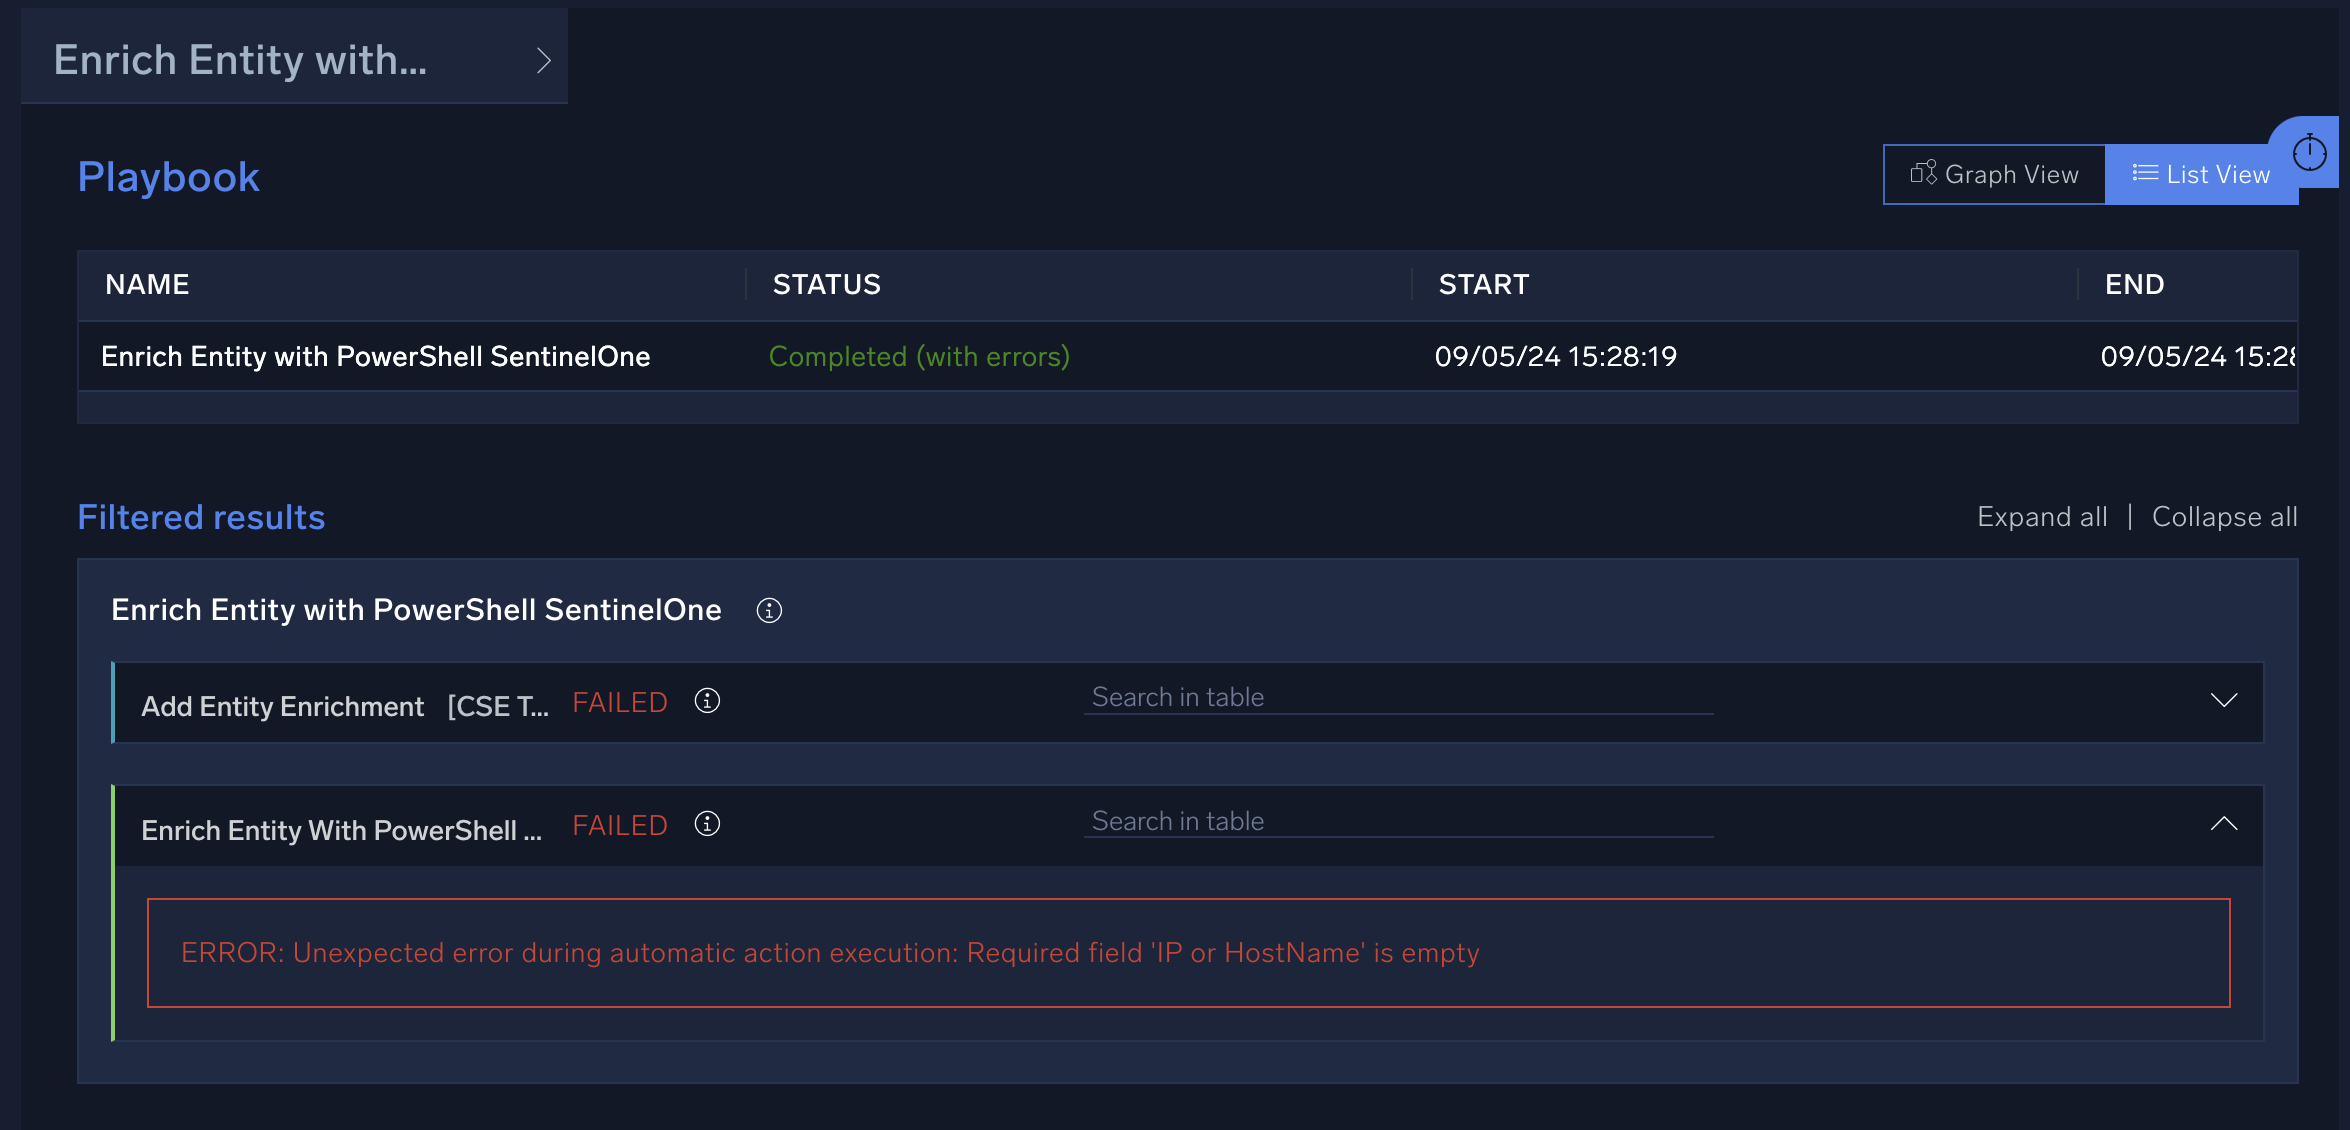
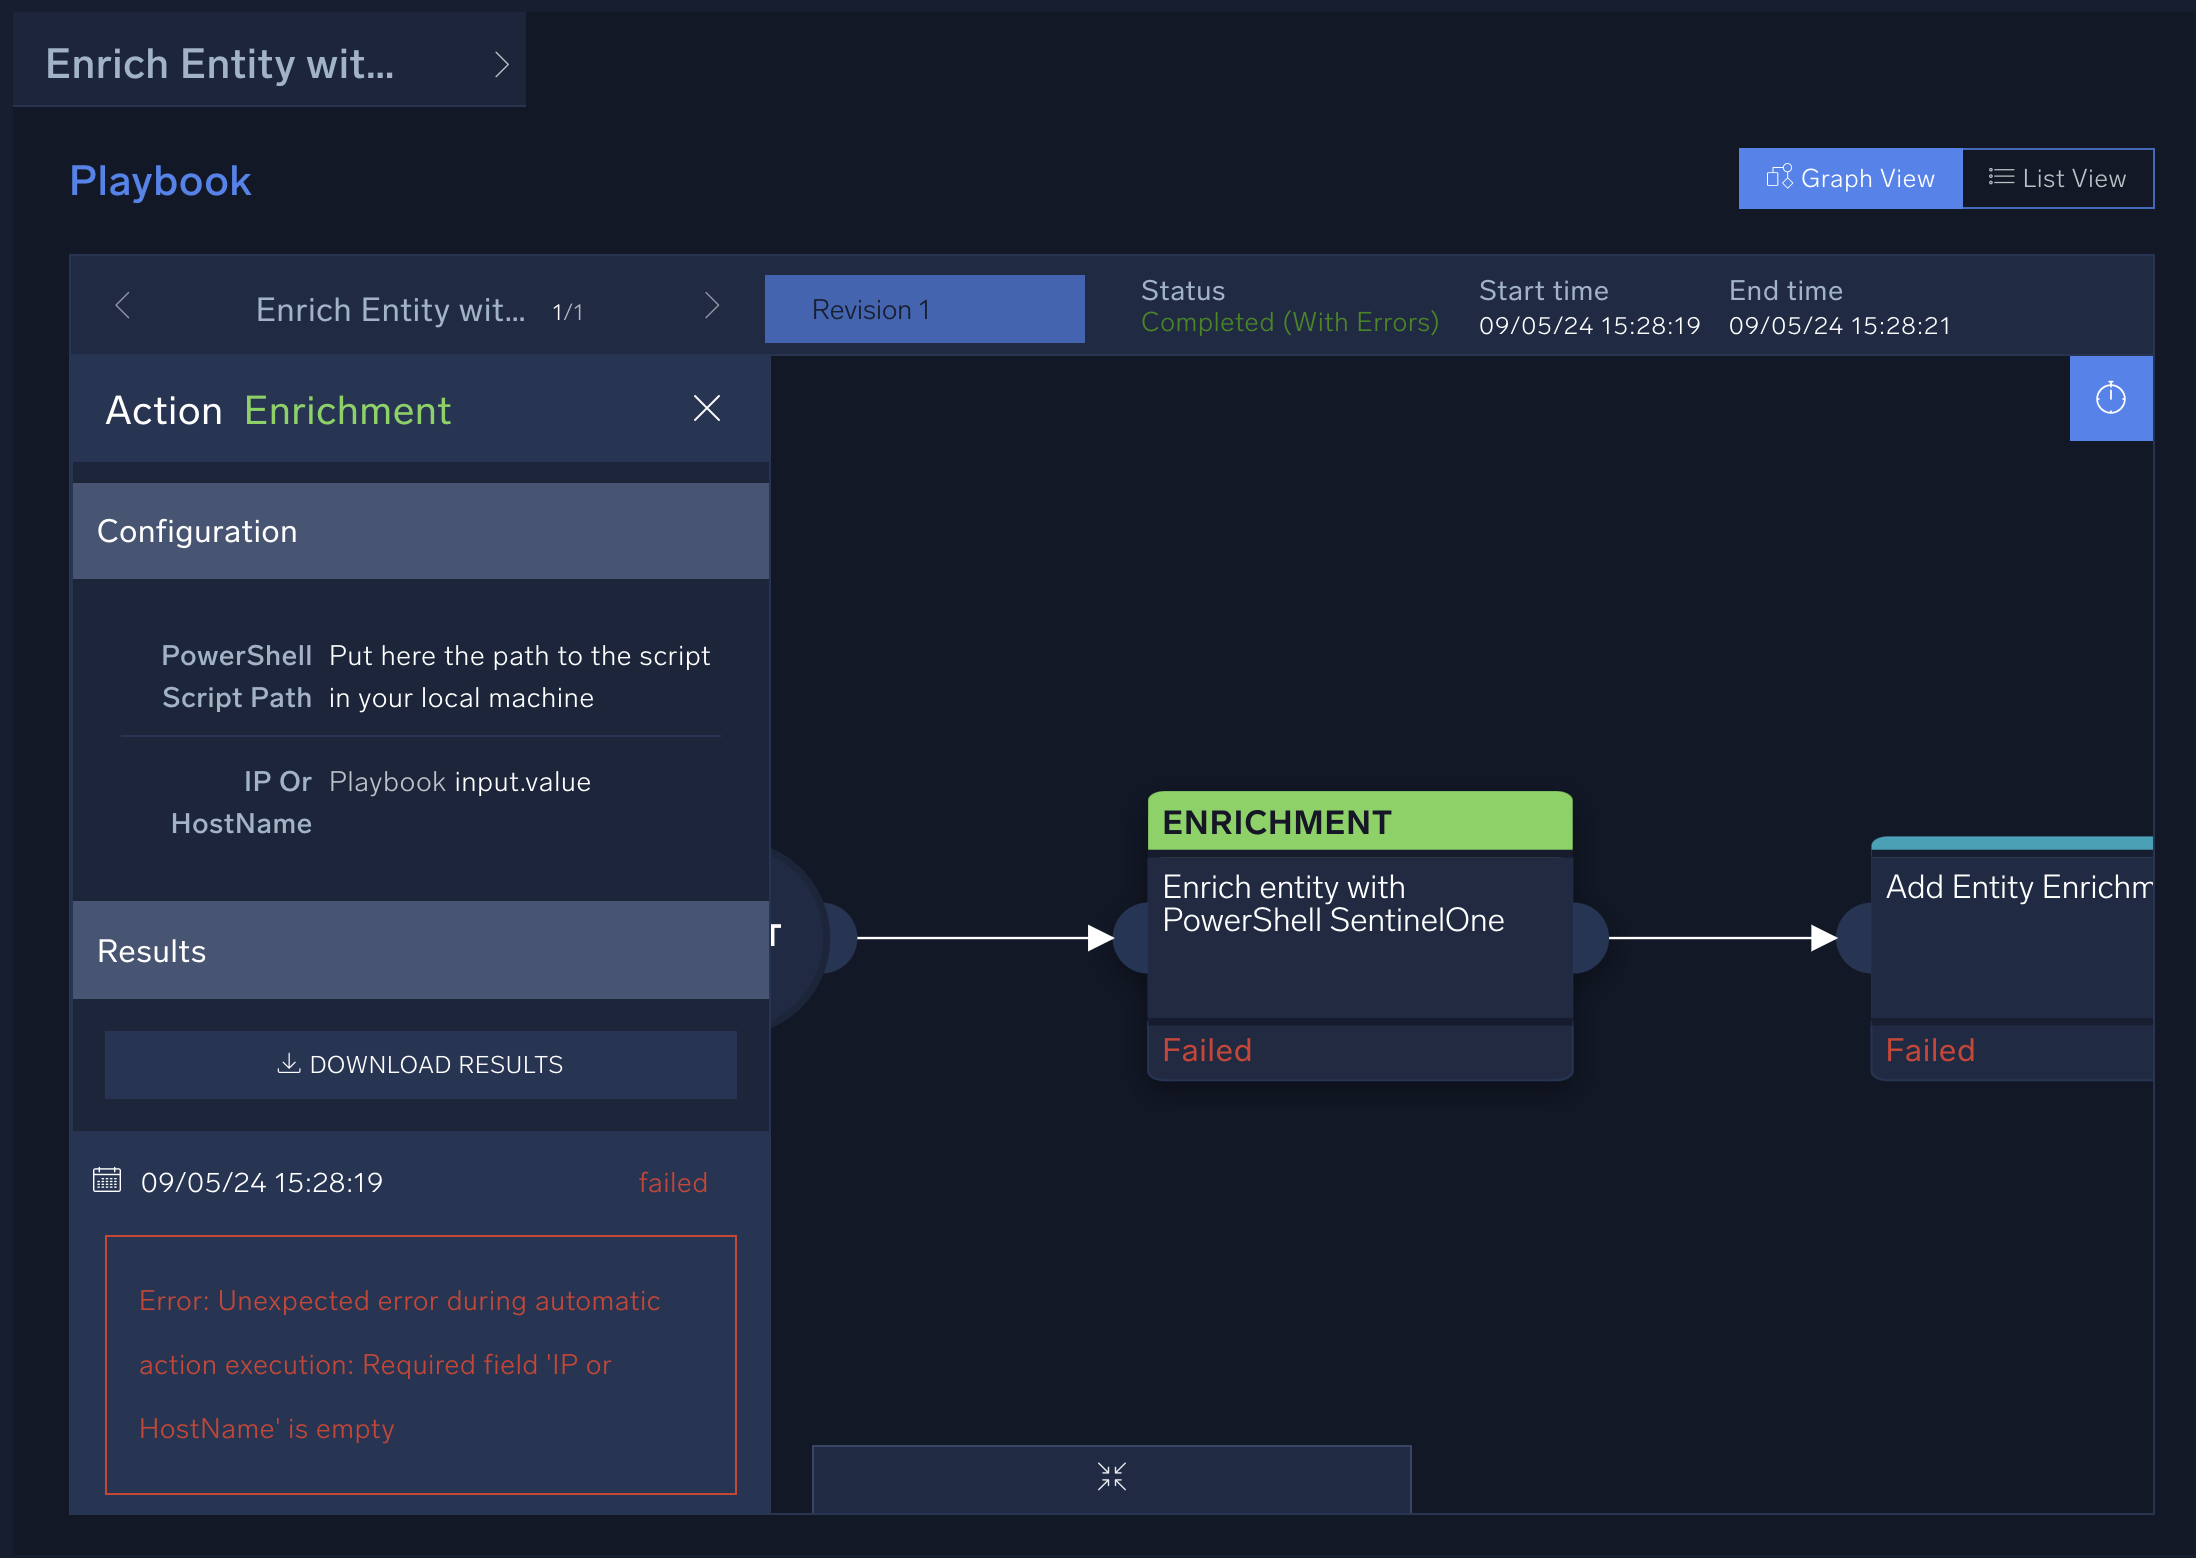
- For more detailed information about the action, click the Graph View in the upper right and then click on the action. A pane opens that displays more information about the action.
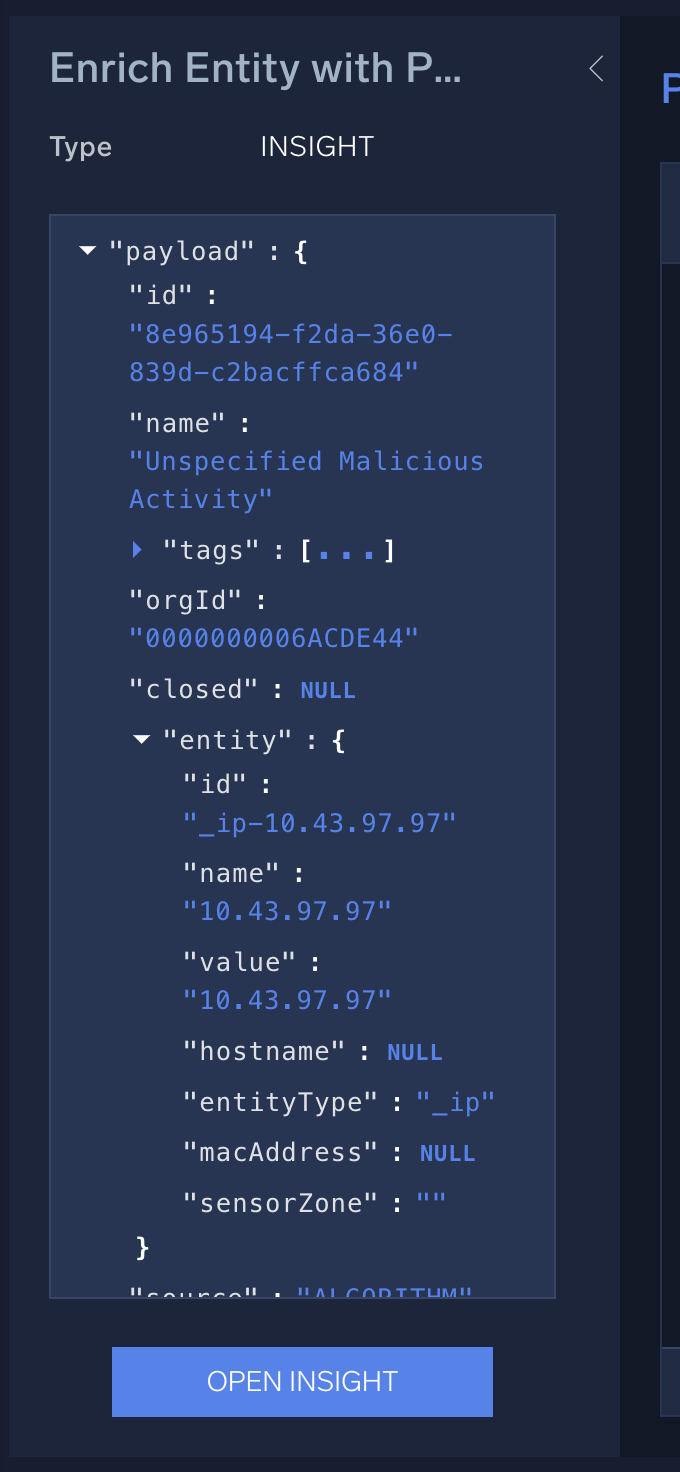
- Sometimes the playbook's payload will provide more information about why an action has a problem. To view the playbook's payload, click > to the right of the playbook name.
- Examine the playbook payload for information that might help you resolve the problem. For example, the payload may be able to tell you if a field has not been properly passed from a previous action, or a field was unintentionally left blank that the action requires.
- Based on what you uncover during investigation, you may need to make changes to the playbook and then test the playbook to ensure it works correctly.
Common playbook problems
Following are some common problems that can occur with playbooks:
- No response from the bridge
The automation bridge is offline, or the bridge does not have the egress firewall settings to handle the outbound request. - API rate limiting issues
The vendor has capped the number of requests that can be made to their API in a certain time frame. - HTTPS connection pool issues
There are no available connections at the vendor, usually indicative of a vendor API health issue. - A required field is empty that the action is looking for
A field has not been properly passed from a previous action, or a field was unintentionally left blank that the action requires. - Permission denied
The API key is incorrect on the integration resource, or the account running the playbook has invalid credentials or insufficient permissions. - You have exceeded the actions limit
The number of actions that your organization can run per hour is limited to a certain threshold. Any actions that are launched beyond this actions limit will not run. You might exceed the limit if:- There are alert surges.
- The playbook is not optimized properly and actions are stuck in a loop.
- There are Cartesian flag issues (too many nested elements to process as part of the returned API result).
- There are alert surges.