Sumo Logic Copilot
If you prefer not to use Copilot, you can opt out by contacting Support.
Sumo Logic Copilot is our AI-powered assistant that accelerates investigations and troubleshooting in logs by allowing you to ask questions in plain English and get contextual suggestions, helping first responders get to answers faster.
With its intuitive interface, Copilot automatically generates log searches from natural language queries, helping you quickly investigate performance issues, anomalies, and security threats. It also guides you through investigations step-by-step with AI-derived suggestions to refine your results for faster, more accurate resolutions. Overall, Copilot enhances incident resolution with expert level insights.
This short video introduces Copilot and how it can help you with log search and analysis—perfect for getting a quick overview before diving in.
Key features
Copilot accelerates incident response by combining prebuilt contextual insights with natural language queries and enhancing time to insights for users across your organization. With sub-3-second response times with over 90% translation accuracy for most queries, Copilot ensures fast and dependable results for supported log sources.
- Natural language queries. Ask questions in plain English.
- Contextual suggestions. Get suggestions relevant to your troubleshooting and investigations context.
- Conversation history. Save and resume troubleshooting or investigation sessions without losing context.
- Auto-visualize. Copilot automatically generates charts from search results, which you can add directly to dashboards, reducing time and effort in data interpretation.
- Log compatibility. Copilot supports structured logs, semi-structured logs (partial JSON), and unstructured logs (e.g., Palo Alto Firewall) when Field Extraction Rules (FERs) are applied. This ensures valuable insights across a variety of log formats.
- Enhanced query experience. Auto-complete to streamline natural language queries.
Security and compliance
Sumo Logic Copilot leverages foundational models provided by Amazon Bedrock, inheriting their robust compliance and security posture. For detailed information, refer to the following Amazon Bedrock security and compliance resources:
Additionally, all aspects of our service, including Copilot, adhere to the security and compliance requirements outlined in our service agreement or in individually negotiated contracts.
- Customer data privacy. Copilot ensures customer data remains private and secure. No customer data or PII is used to train the AI models. Context for AI processing is limited to schema and field samples, reviewed for legal and compliance purposes.
- Rolling data expiration. Some features may store query history temporarily for performance, but data is expired on a rolling basis.
- AI provider. Copilot uses a foundation model served by Amazon Bedrock. The provider has no access to your data.
Who benefits from Copilot?
Copilot is ideal for users of all skill levels:
- On-call engineers. Accelerate time to resolution by surfacing key troubleshooting insights.
- Security engineers. Obtain security insights rapidly for faster security incident resolution.
- Early career professionals. Simplifies troubleshooting with natural language queries, making incident resolution accessible to those unfamiliar with query syntax.
- Practitioners. Speeds up workflows with auto-complete and context-aware suggestions for frequent tasks.
- Experts. Provides IDE-style assistance for crafting complex queries efficiently.
How to use Copilot
In this section, you'll learn the recommended workflow for using Copilot effectively, along with best practices to maximize its benefits.
See Copilot in action with a hands-on walkthrough of the UI and prompt-based search.
Step 1: Open Copilot
To start using Copilot:
From the Classic UI, click the Copilot tab.
From the New UI, click Copilot in the left nav.
Step 2: Review and adjust the auto-selected source
Copilot automatically selects a source category based on its assessment of user intent. Review the selection and adjust it if needed. You can also manually enter a source expression to define the scope of your exploration.
For example, to explore AWS WAF logs, select the appropriate source. For indexes, use _index=<index name>. Autocompletion is supported—start typing a few words to see source suggestions and choose one.

Step 3: Execute a query
Click a suggestion
Click on any of the prebuilt Suggestions prompts to launch your investigation. These AI-curated natural language insights are tailored to the specific source you've chosen.
In this example, we'll click Count the number of log entries by the collector ID. This translates the insight to a log query and renders results.

You can pin a suggestion for easy access later. Just hover over a suggestion and click Pin suggestion (pin icon). The pinned suggestion will stay at the top of your Suggestions list within that conversation.
Ask a question
In the Ask Something... field, you can manually enter a natural language prompt, similar to the prebuilt options under Suggestions. You can also use autocompletion—start typing a keyword to see relevant suggestions.
To get the best results, focus your queries on a specific, well-defined problem. Broad or vague questions may lead to inaccurate or incomplete results. If Copilot cannot translate your prompt into a valid query, you'll see a "Failed translation" message.
Whenever possible, break down complex questions into smaller, clear requirements. This helps Copilot generate more accurate and actionable responses.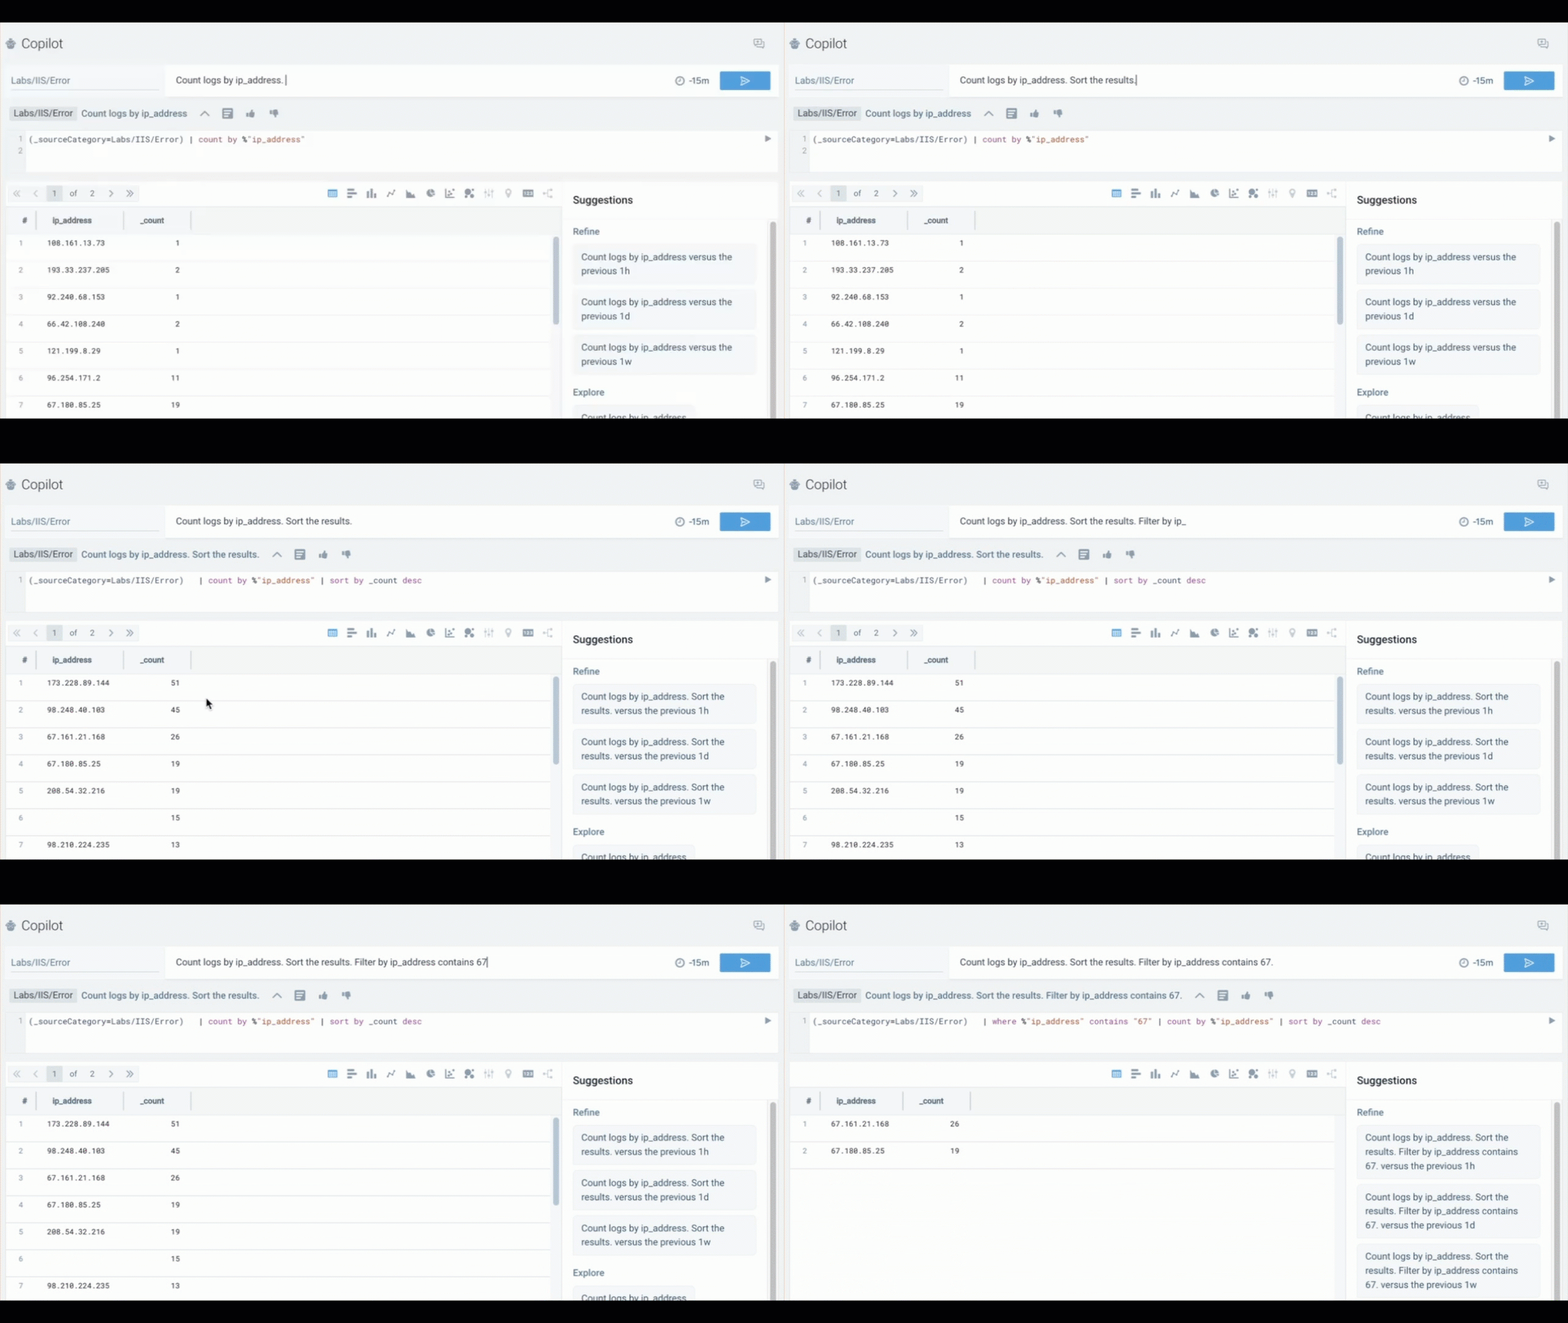
Tips and tricks
- Start with a broad query. Begin with a query like
Show me the most recent logsto understand the structure and available fields in your logs. - Disambiguate field names. If fields have similar names and cause confusion, explicitly specify the field (e.g.,
<field_name>) to improve accuracy. - Experiment with phrasing. Try multiple variations of a query to provide context and receive more relevant suggestions.
- Include time or variations to add
timesliceas a dimension. When timeslicing data, include the termtimein your query. For example:Count requests, every 1m, different code challenges and user used during login attempts by time. - Explore context-aware suggestions. Use prompts like
Calculate 95th percentile latencyorVisualize request volumes over timeto quickly surface key metrics. - Detect malicious activity. Try queries like
Count register requests by 503 status code, IP, and threat confidenceto uncover potential DDoS attacks.
Below are examples of how you can phrase queries if the autocompletions and contextual suggestions are not relevant to you:
Count logs by[field(s)] andGroup logs by[field(s)] produce the same resultSort by[field(s)] [in descending order]Percentage by[field]valuesFind[stat]for[field] (max, min, standard deviation, etc.)Filter by[field]contains[keyword]noteKeyword searches are case-sensitive.
Apply logreduce to logs
More examples:
- Detecting malicious activity:
Count logs by action. Sort the results.
Filter results by action contains Malicious. - Advanced analysis with users and URLs:
Count logs by action, url, user.
Sort the results. Filter results by action contains Malicious. - Root cause analysis for latency:
Calculate 95th percentile latency by service and API.
Additional prompts can trigger more advanced activities (e.g., mapping network activity against CrowdStrike):
Analyze risk and severity of network activityIdentify top application categories accessed
Time range
By default, Copilot searches run with a 15-minute time range. If your search returns no results, consider expanding the time range.
- Click the clock icon and select your desired time range from the dropdown.

- Click the search button.

Chart type
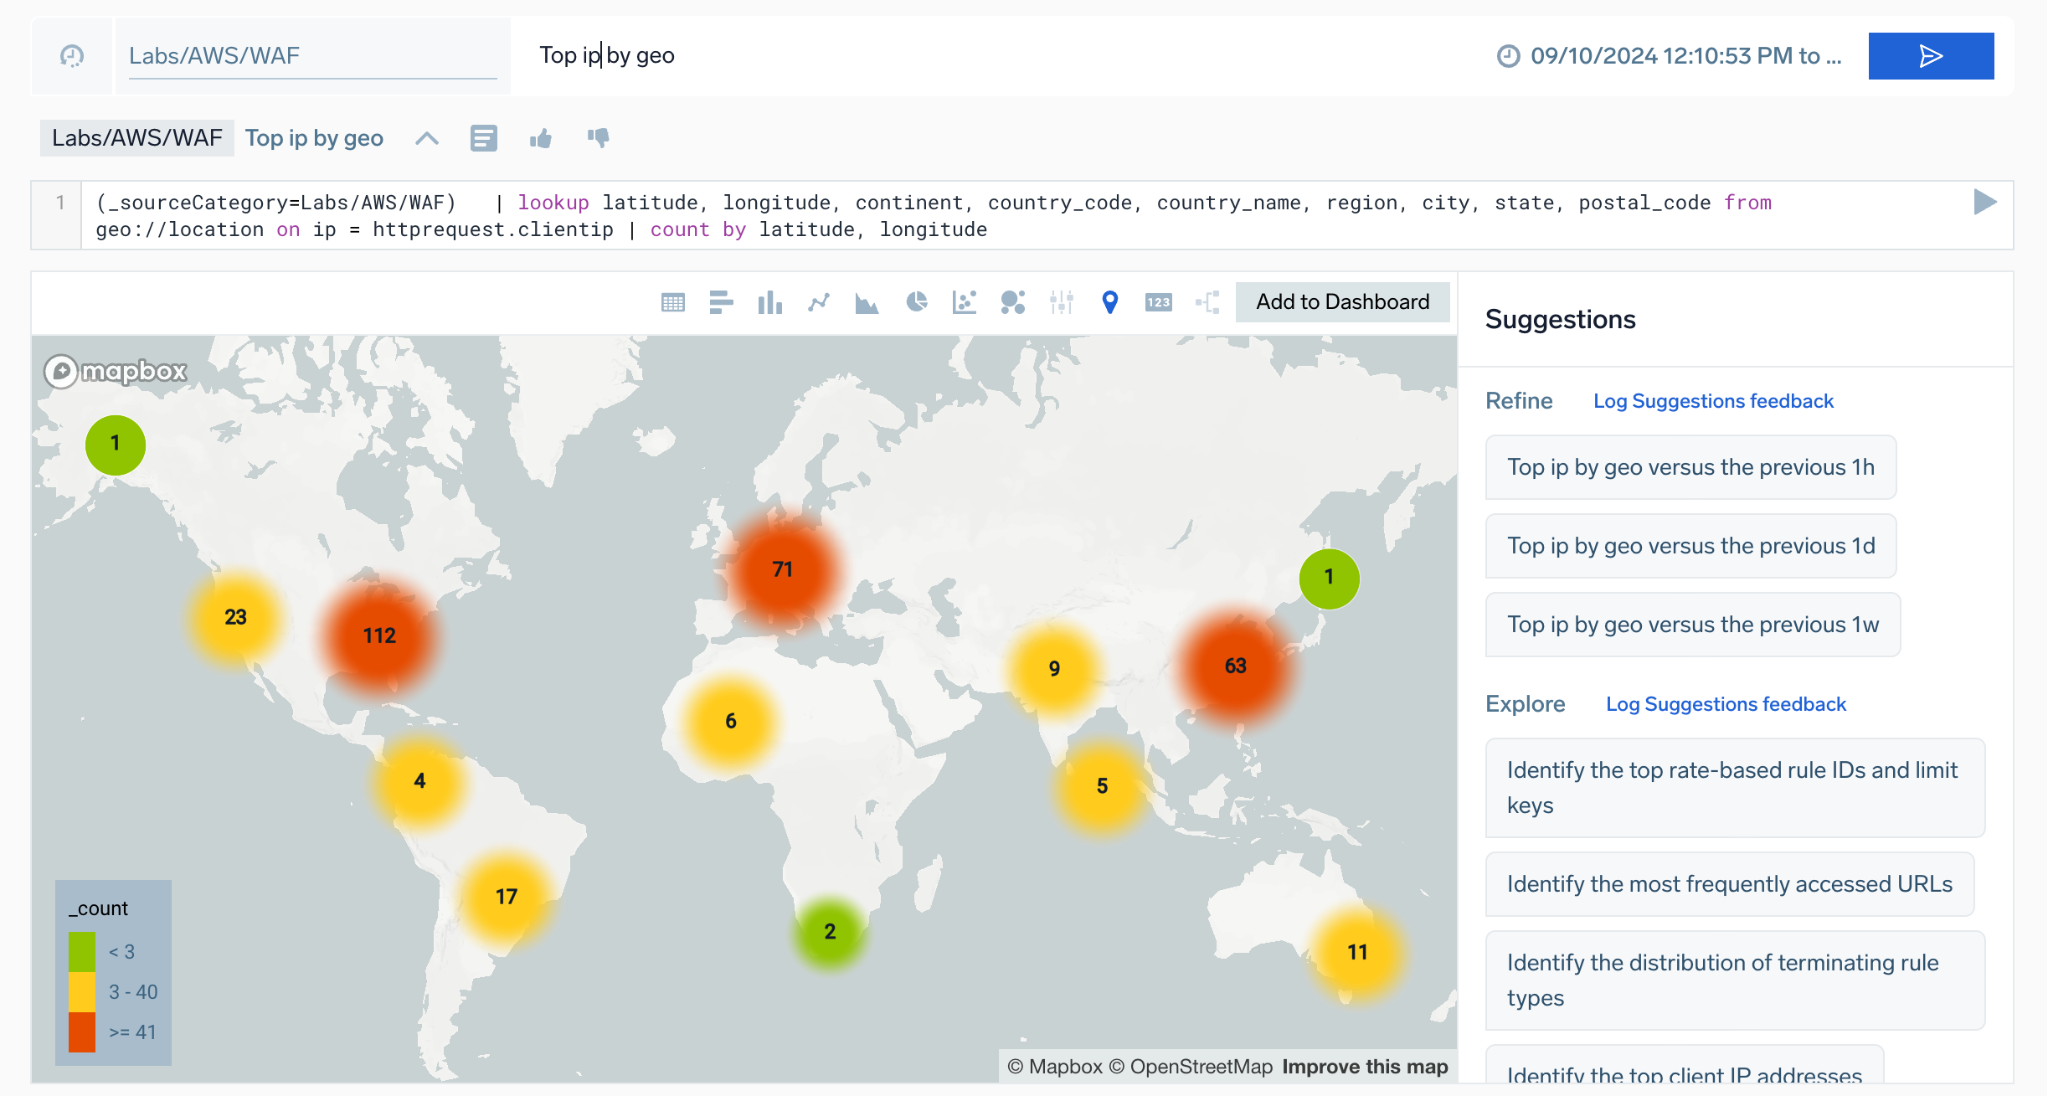
Copilot will automatically attempt to visualize your data. For example, a query like Top ip by geo will trigger a geo lookup and display the results on a map:
The following rules are used to deduce chart type:
- If both latitude and longitude fields exist, it returns a MAP chart type.
- If there is only one field and one record, it returns an SVP chart type. Example query:
(_sourceCategory=ic/linux/gcp) | count by %"_sourcename" | count - If a
sortoperator is present and there are string fields, it returns a TABLE. Given that there is asortoperator, probably the user is interested incount. Query:(_sourceCategory=ic/linux/gcp) | count by %"_sourcename" | sort by _count - If there is a
_timeslicefield, it returns a LINE chart type if there are numeric fields or a TABLE chart type if there are string fields. - If there is one string field, one numeric field, and record count is less than 6, it returns a PIE chart type. Query:
(_sourceCategory=ic/linux/gcp) | count by %"_sourcename". - If there is one string field, less than 3 numeric fields, and record count is less than 20, it returns a LINE chart.
- If none of the above conditions are met, it defaults to returning a TABLE chart type.
If required, select your preferred chart type, such as Table, Bar, Column, or Line view to visualize your results. You can also click Add to Dashboard to export an AI-generated dashboard for root cause analysis.

Edit query code
You can manually edit your log search query code if needed.
- Click in the code editor field and edit your search. New to Sumo Logic query language? Learn more in the Search Query Language guide.

- When you're done, press Enter or click the search button.

To save space, you can use the Hide Log Query icon to collapse the log query code.
Compatible Log Formats
Copilot querying is compatible with JSON logs, partial JSON logs, and unstructured logs with Field Extraction Rules. It cannot be used to query metrics or trace telemetry.
To retrieve a list of _sourceCategories with JSON data, use the following query:
_sourceCategory=* "{" "}"
| limit 10000 | logreduce keys noaggregate
| count by _sourceCategory, _schema
| where _schema != "unknown"
| sum(_count) by _sourceCategory
If your log query contains a mix of JSON and non-JSON formatting (i.e., a log file is partially JSON), you can isolate the JSON portion by adding a left curly brace ({) to the source expression to trigger Suggestions.
Edit Title
Copilot automatically updates conversation titles based on your query. You can also set a custom title by clicking the "Edit Title" (pencil) icon. This helps keep investigations organized and easier to revisit.
History
The conversation history feature saves all previous queries and suggestions, allowing you to backtrack and refine your investigation. For example, if a status code analysis yields inconclusive results, you can revisit earlier queries to explore other possibilities.
This functionality can be useful when you're working on multiple incidents at the same time. To view Copilot interactions related to an incident, click History.
There are two ways to resume a conversation:
- Click the "Resume Conversation" icon to pick up from the last query in a conversation.
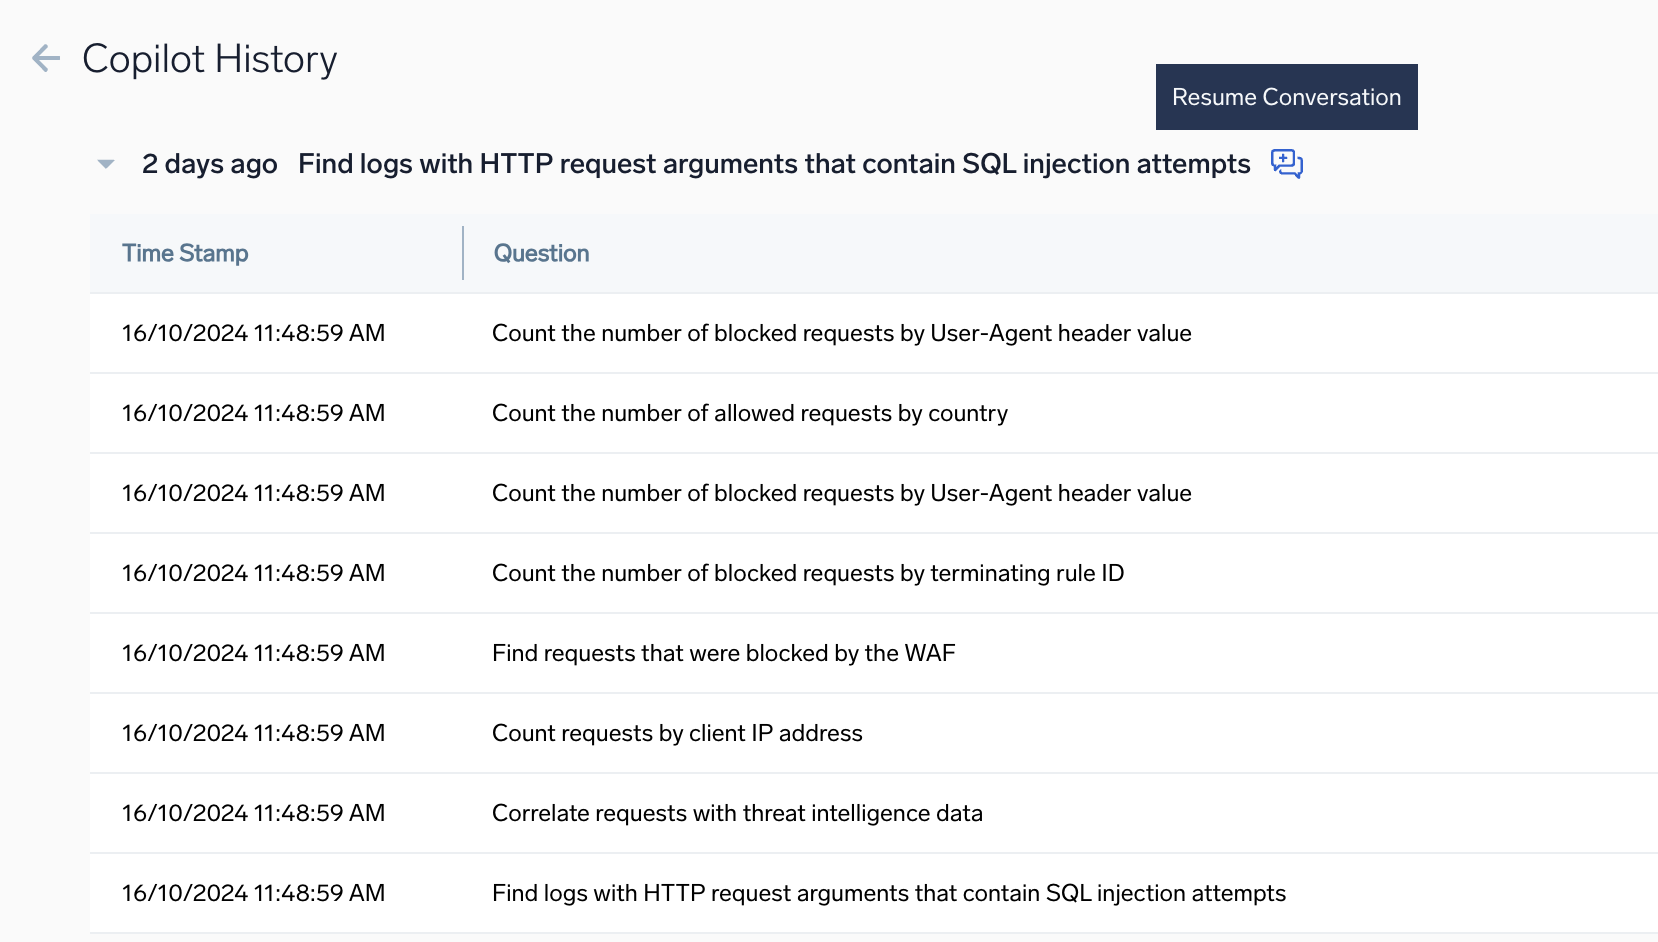
- Click on any row in a conversation history, then click the "Open in Copilot" icon to resume from a specific query in a conversation.

New Conversation
To start a fresh exploration, click New Conversation. This clears your current session and allows you to begin with a clean slate.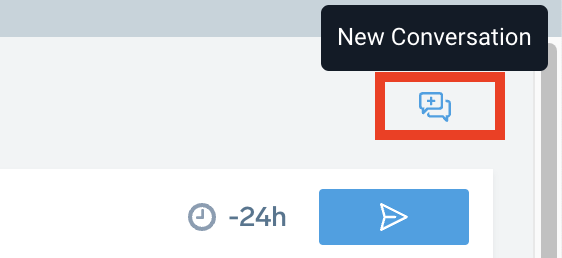
Step 4: Open in Log Search
You can open your query in Log Search to access Sumo Logic’s full search functionality. This allows you to continue investigating, refine your query, save the search, or take action as needed.
There are two ways to do this:
- From your conversation, click the "Open in Log Search" icon.

- From your conversation history, hover over any row, then click the "Open in Log Search" icon.

Example queries
Logs for security
In the video, Copilot is used to investigate a security issue involving the potential leak of AWS CloudTrail access keys outside the organization.
The video demonstrates how to use Copilot to analyze AWS CloudTrail data, review AI-curated suggestions, refine searches using natural language prompts, and generate a dashboard for root cause analysis and sharing.
Cloud SIEM
You are a SecOps engineer who uses Cloud SIEM. You are worried about a signal in Cloud SIEM regarding malicious network activity. You want to investigate network records and be proactive. You are under pressure to complete your investigation quickly. While familiar with Sumo Logic, you do not write log queries every day and could use a little help. Fortunately, all your Cloud SIEM records are in Sumo Logic.
- In Copilot, you type the source for Cloud SIEM network records:
_index=sec_record_network - You know what you are looking for. So, you ask:
Count logs by action. Sort the results.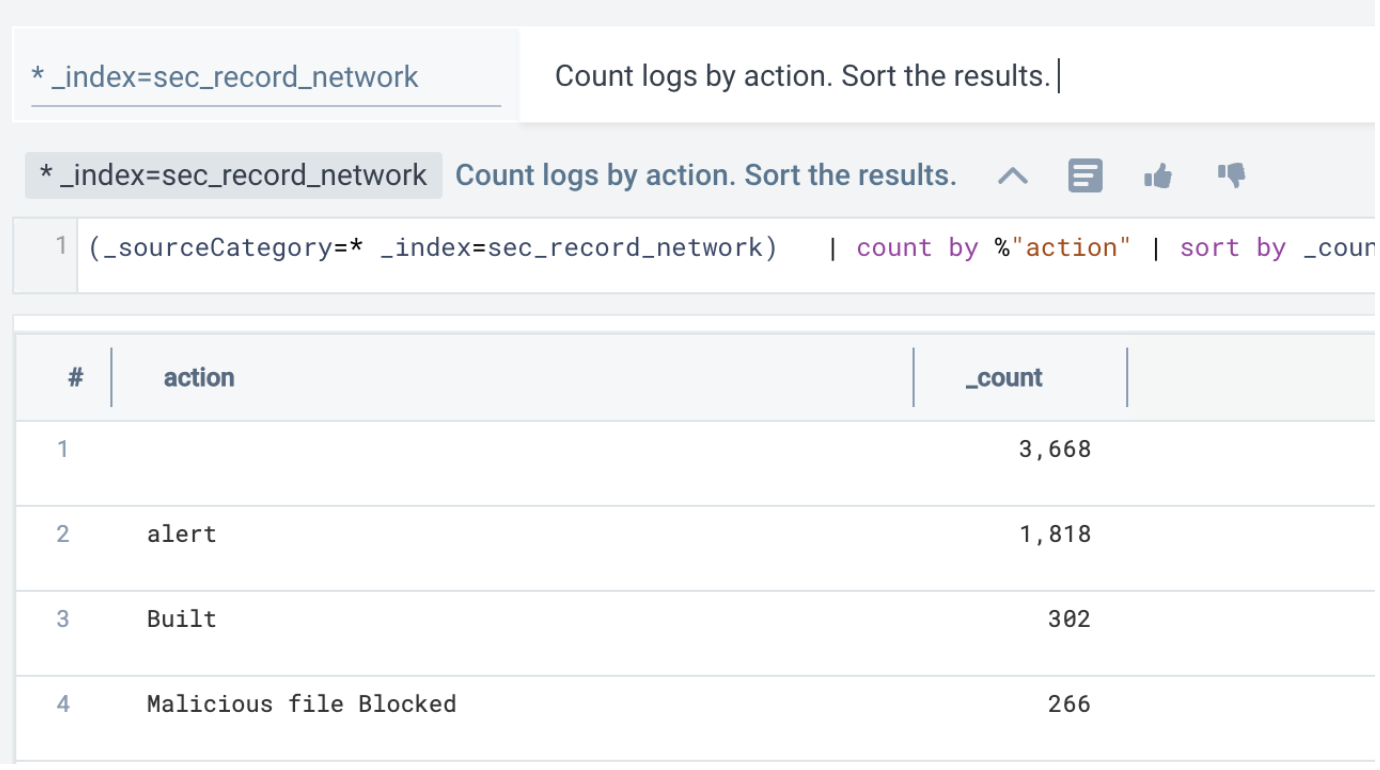
- As soon as you do that, you can look at the Suggestions section on the right. These suggestions are curated based on their relevance to this Cloud SIEM source. You pick a suggestion to compare results to the last hour:
Notice the system translated the suggestion to a log query and rendered results as a bar graph with no user input.
Count logs by action. Sort the results. versus the previous 1h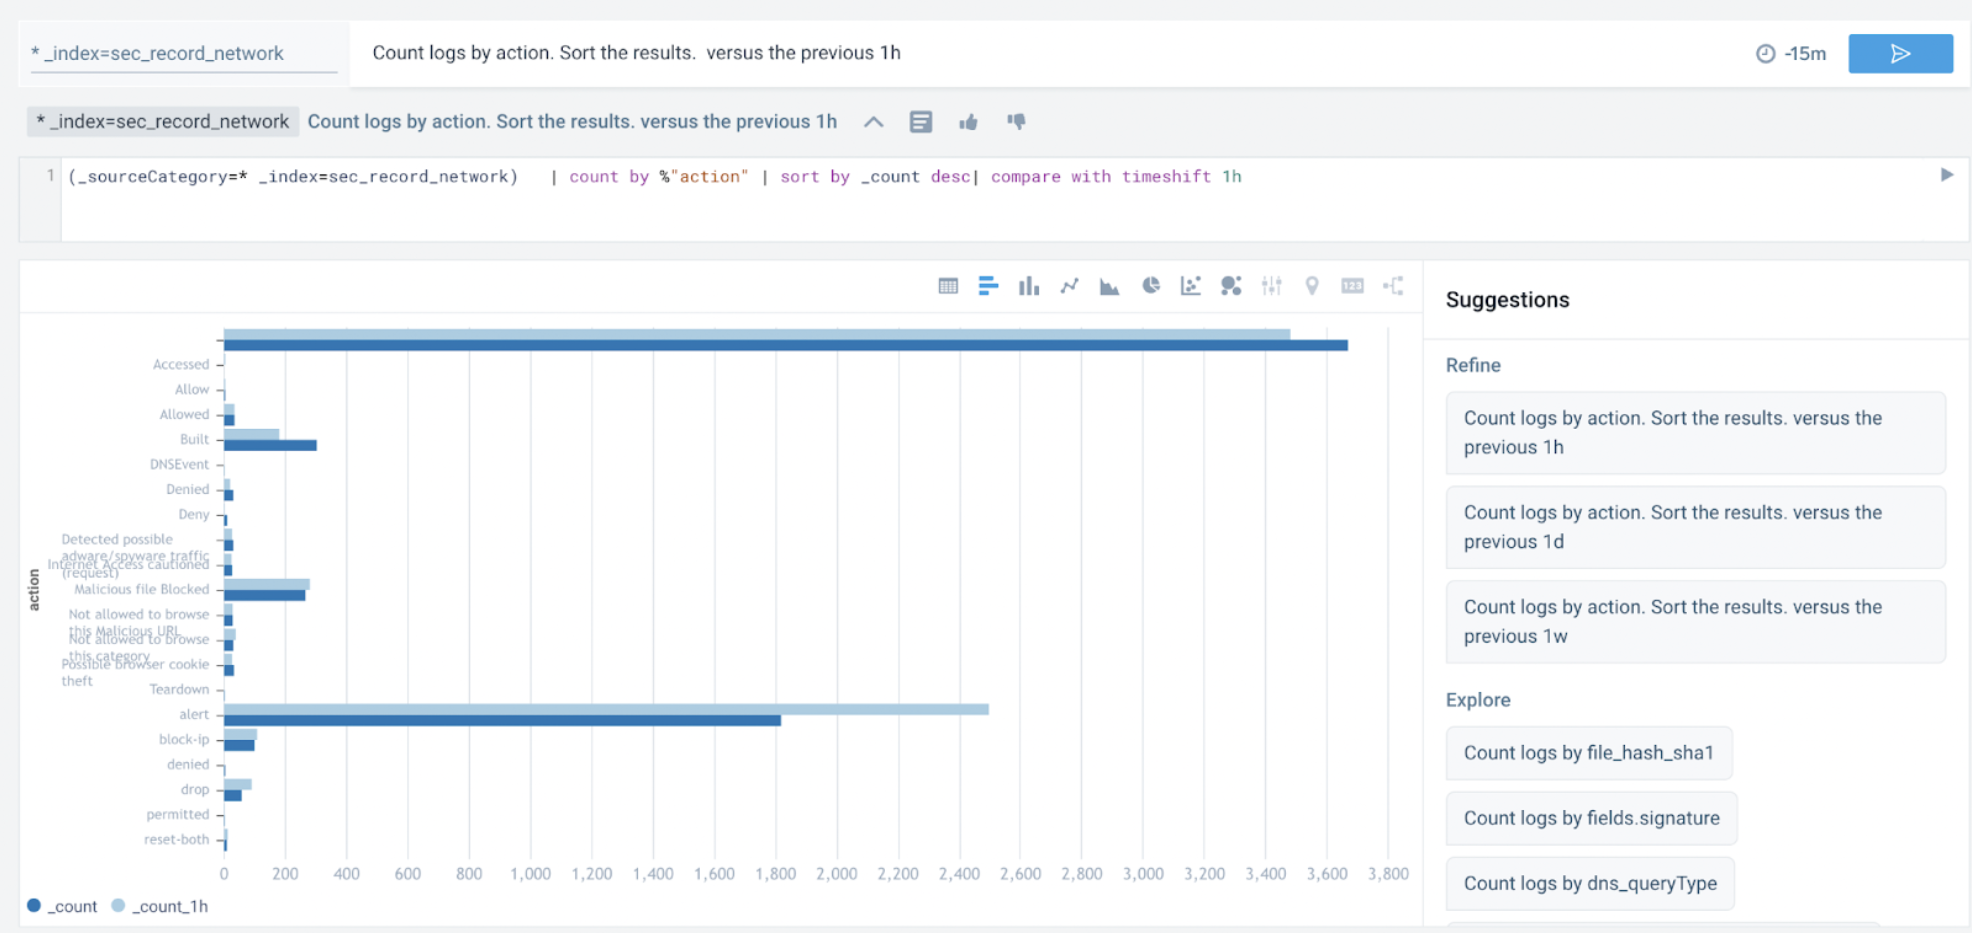
- Switching to table view, you notice "Malicious” in the search results. So, you add in
Filter results by action contains Maliciousto the query:Count logs by action. Sort the results. Filter results by action contains Malicious. note
noteIf
Maliciousdoesn't work, tryMalicious*. Sumo Logic is case sensitive. - Next, you look for URLs that pertain to the malicious action:
Count logs by action, url, user. Sort the results. Filter results by action contains Malicious.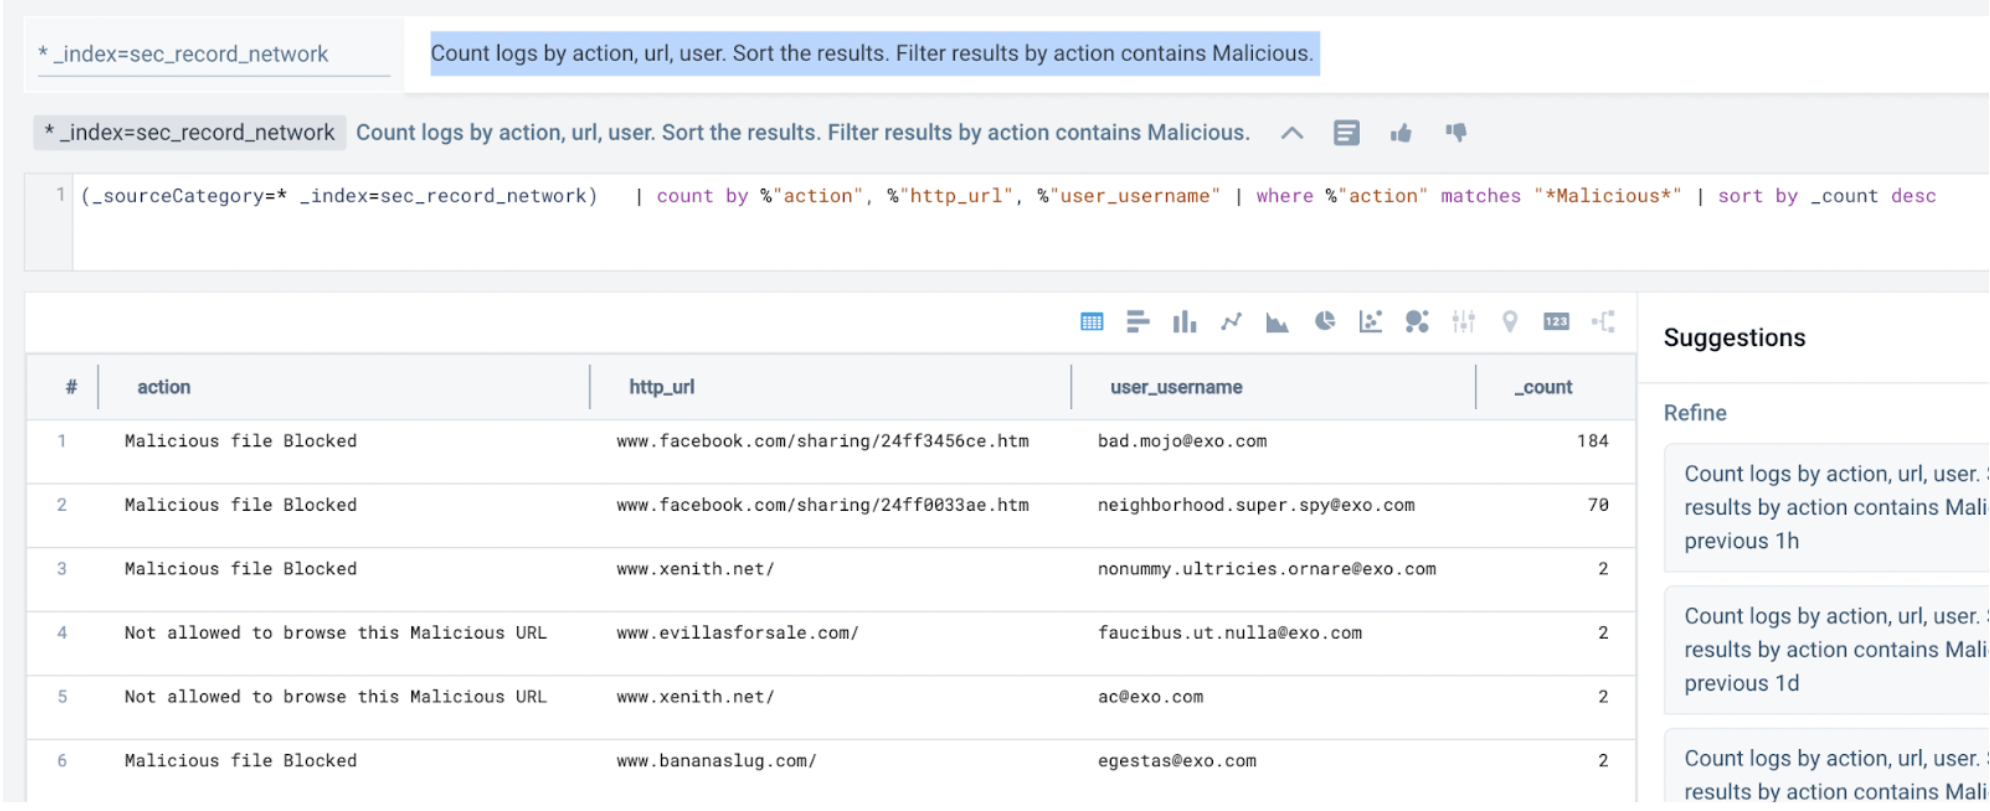
- Even though the activity was blocked, you can investigate the affected users in the endpoint records next.
To summarize, you conclude there is malicious activity originating from certain users who need to be investigated further.
Role Based Access Control
Role Based Access Control is not supported for contextual suggestions and autocompletions. It is possible for a user who is blocked by log search RBAC to view suggestions or completions for unpermitted source expressions. However, they will not be executed by the search.
Search behavior and data tier access
Copilot follows the same search behavior as standard log search and respects your account’s data configuration, whether you're on classic tiered pricing or Flex pricing.
Flex pricing
For customers on Flex pricing, all data is stored in a single intelligent layer and pricing is based on the volume of data scanned.
Tiered pricing (legacy)
If you're on classic tiered pricing, Copilot by default searches across continuous data tiers only, unless otherwise specified.
To direct Copilot to search the Infrequent tier, for example, use:
_dataTier=Infrequent
FAQ
What is Sumo Logic Copilot?
Sumo Logic Copilot (also referred to as Sumo Logic Mo Copilot) is an AI assistant integrated into the Sumo Logic Log Analytics Platform. It enables natural language queries and contextual troubleshooting, helping users extract actionable insights from logs. Copilot does not process or share your log data with any third party.
Can I use Copilot to analyze unstructured logs?
Yes, Copilot can extract relevant insights from unstructured logs, provided Field Extraction Rules (FERs) are applied. It also supports semi-structured logs (JSON + unstructured payloads).
Does Copilot save search history?
Yes, Copilot retains conversation and search history, allowing you to resume investigations with context and continuity.
What role does AI play in Copilot?
Copilot uses AI to interpret natural language queries and recommend search results or query refinements, streamlining log analysis.
What specific types of customer data or PII does the AI process? Does it filter out PII/sensitive information?
Sumo Logic Copilot processes schema and field samples to provide context to the AI. While field values can contain PII or confidential data (for example, email addresses or IP addresses), these values are used solely to enable insights and are protected under strict compliance and security reviews.
Is customer data/PII used to train AI models?
No, customer data or PII is not used for training AI models. Copilot operates using a foundation model served via Amazon Bedrock, ensuring your data remains private and secure.
How long does the AI store customer information or PII, and when and how is it deleted?
Certain features may rely on query history stored on a rolling basis for performance optimization. Data is systematically expired to maintain privacy.
For example, our alerts feature log anomaly detection and build ML models from 60 days of logs. To accomplish this, we retrain the model once a week. In this example, each week, we add one week of new data while expiring the oldest week of data. Rolling data windows are done to avoid fetching 60 days of data for every training run.
Does Sumo Logic Mo Copilot use any open-source library, GenAI providers, or cloud providers?
For Generative AI, Copilot uses a foundation model served by Amazon Bedrock. Classical ML features leverage open-source Python libraries approved by Sumo Logic.
What is the type of AI being used?
Sumo Logic Copilot is an ensemble of Generative AI (GenAI) and classical machine learning (ML) techniques. For example, classical ML is used for anomaly detection in alerts.
Is there a human in the loop for Copilot?
Yes, the on-call developer or security engineer troubleshooting an incident is the expected user. They interact with Copilot using natural language questions or through contextual suggestions.
Does a fourth party have access to Copilot customer data?
No. The foundation model provider used by Amazon Bedrock has no access to customer data.
Do you hold any AI-specific certifications or accreditations?
No, Sumo Logic does not currently hold any AI-specific certifications or accreditations.
How are reviews conducted on the Copilot model?
Each major capability added to Copilot undergoes legal, compliance, and application security reviews. These reviews coincide with new releases that expand insights or process new types of data.
How can I opt out of Copilot?
If you prefer not to use Sumo Logic Copilot, please contact our support team. Your account will be updated accordingly.
Feedback
We want your feedback! Let us know what you think by clicking the thumbs up or thumbs down icon and entering the context of your query.

You can also leave feedback on specific errors.
