Log Level Detection and Insights
When performing Log Search queries, you can visualize and filter log-level distribution in your Histogram results and Messages table view, helping you to:
- Quickly identify anomalies
- Drill down quickly into high severity logs
- Navigate through a large volume of logs
- Filter the relevant logs in their troubleshooting workflows
Watch the following micro lesson to learn about log level detection.
What are log levels?
Sumo Logic detects five log levels out of the box: FATAL, ERROR, WARN, INFO, and DEBUG. If we're unable to find one of these log levels in a message, it is categorized under the OTHERS bucket.
Log-Level pattern detection is automatic, meaning you do not need to parse log levels manually or write specific queries to see your distribution of error logs.
If the log message is in JSON format, the log level detection method searches for the presence of keys such as "level", "Level", "loglevel", "logLevel", "Loglevel", "LogLevel", "log_level", "log-level", "Log_Level", "Log_level", "severity", or "_loglevel". If any of these keys are identified in the log message, their corresponding values will be considered and displayed in the results. If any of these specified log level keys are not found in JSON log messages, the log level detection method falls back to a plain text search for terms like "debug", "info/information", "warn/warning", and "error." But this fallback mechanism can result in false positives, especially when these terms appear in other contexts like encoded data fields.
And if the log message is in a non-JSON format, the log level detection method looks for keywords such as "debug", "info/information", "warn/warning", and "error". If any of these keywords are found in the log message, their corresponding values will be considered and displayed in the results.
Sumo Logic does not have any source specific special logic for log level extraction except for OTEL. For OTEL sources, severityTextField is used with severityNumber as fallback, if severityTextField is not populated. For more details, refer to the OpenTelemetry Logs Data Model.
If multiple log levels are detected in the message, they will be prioritized in the following order: ERROR > WARN > INFO > DEBUG.
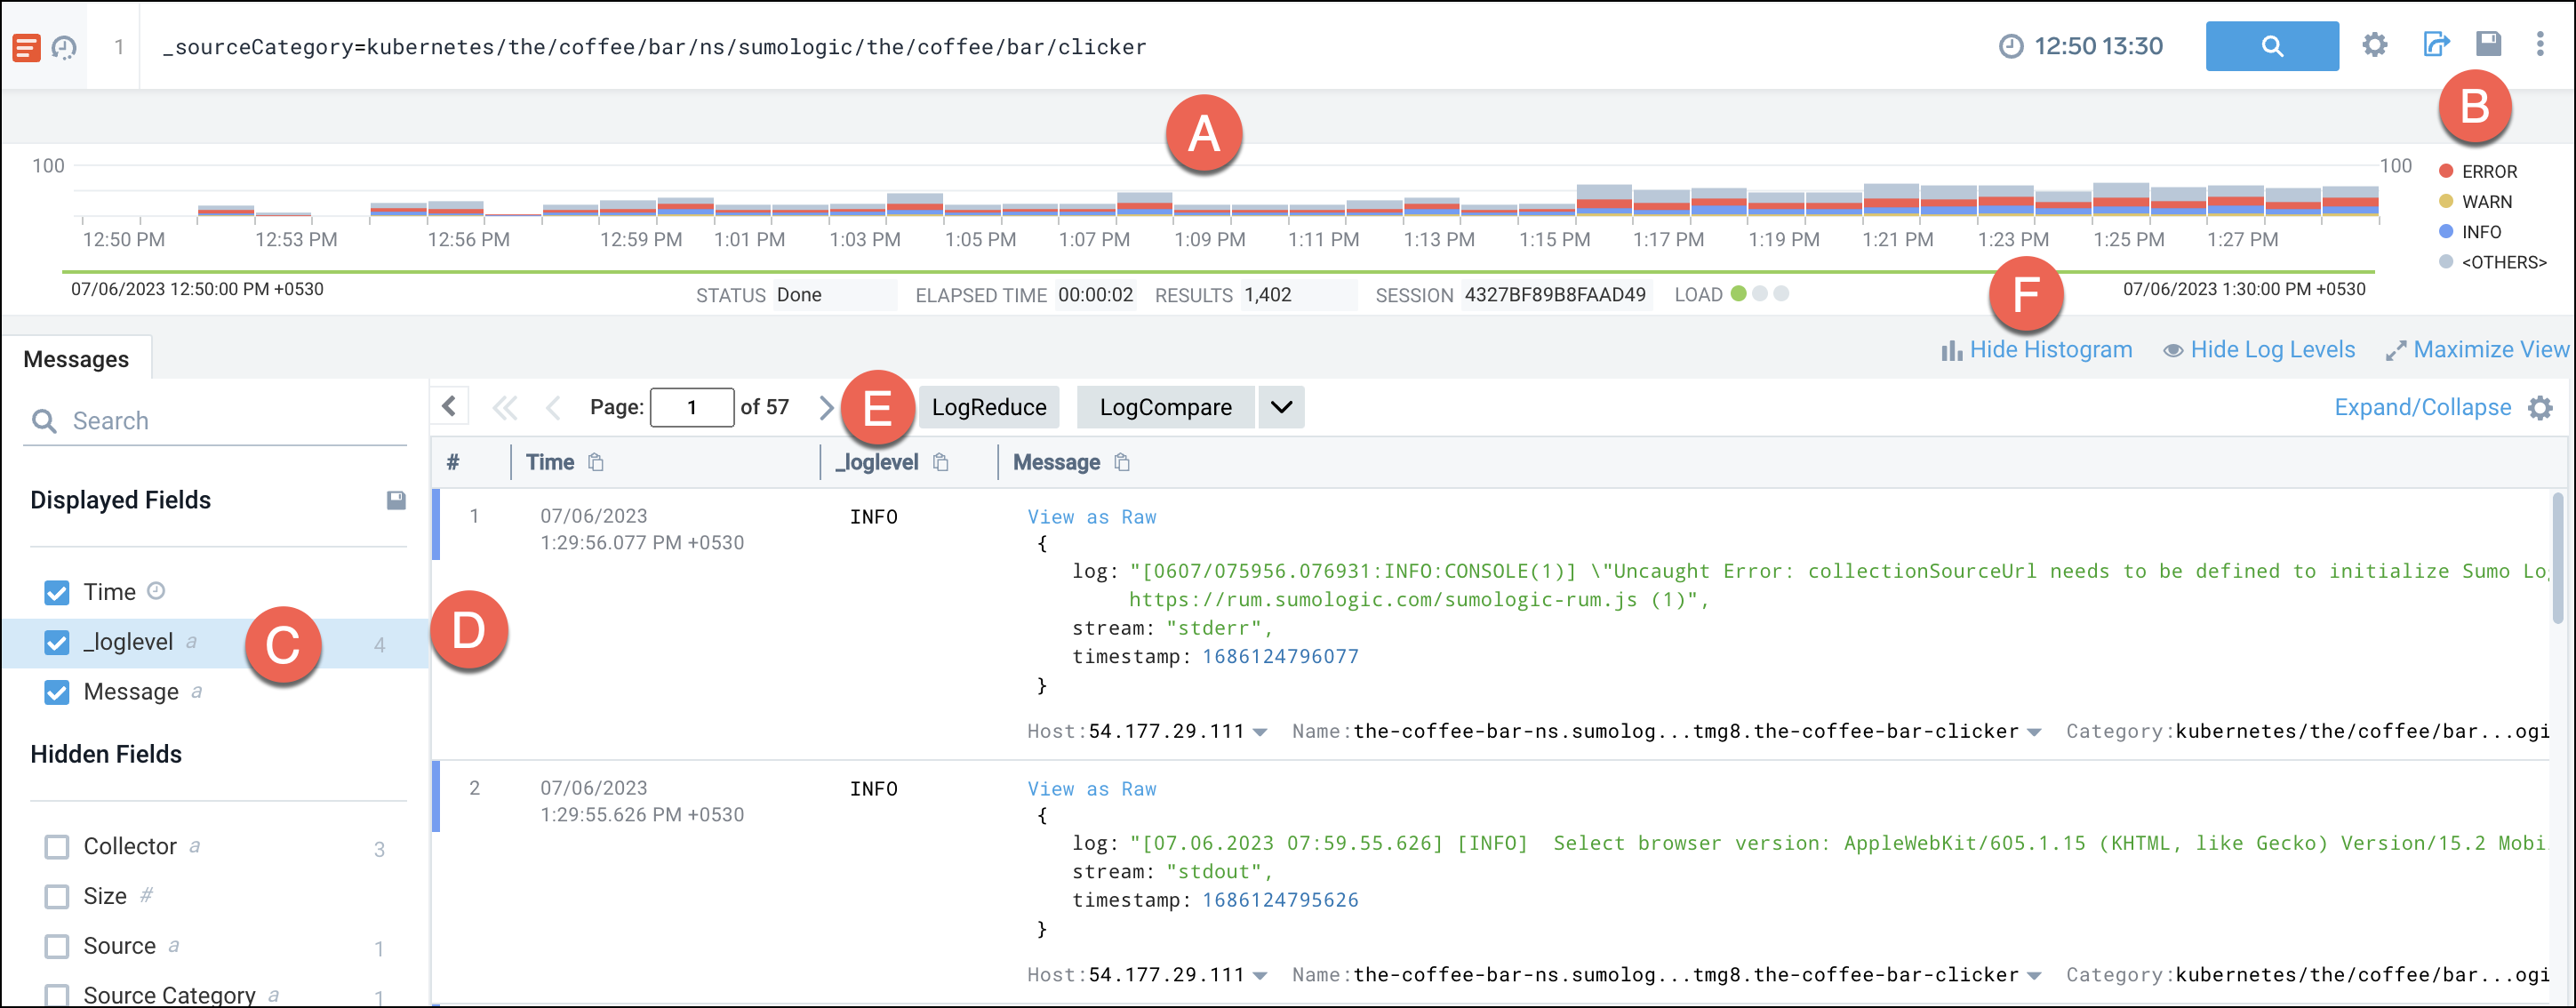
Just execute a log search to see the _loglevel field:

| Element | Description |
|---|---|
| A | Histogram with stacked bars representing log level distribution over your search timeframe. |
| B | Interactive Histogram legend showing the log level that each color represents. Click on any label to isolate it in the Histogram and corresponding messages beneath that. To select multiple log levels, use shift + click. In the following example, the ERROR and INFO label have been selected, so you'll see only error and info logs reflected.  |
| C | Field Browser _loglevel filter. You can use this reserved field in your queries to perform advanced operations. |
| D | Log level for this log message. Quickly identify the log level of each log message using the color-coded Histogram legend for each message. |
| E | Distribution of log levels under _loglevel field in the field browser. |
| F | Hide Log Levels. Click this to hide log levels from the Histogram chart, however, the _loglevel field will still show in the Messages table, however, log level color coding from individual messages will be removed. To enable it again, just click Show Log Levels. |
The _loglevel field value for log messages with the log level "" in the Histogram is null. To query these messages, you can run:
| where isNull(_loglevel)
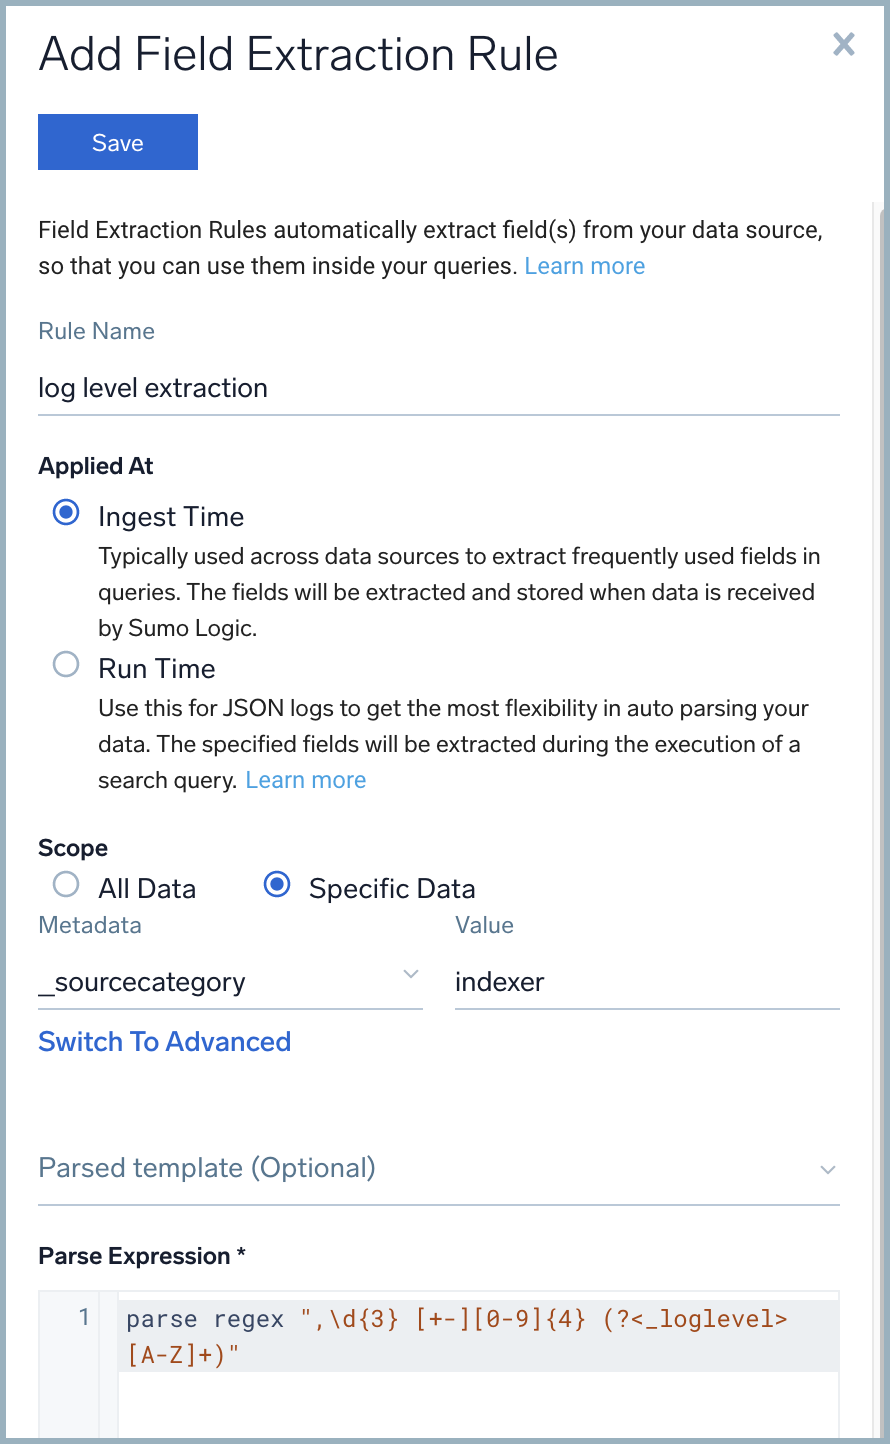
The log level of a log line is stored under the _loglevel field. You can override its value using a field extraction rule (FER). For example:

Log level detection is for qualitative purposes only and will not be perfect. So it is not recommended to use the _loglevel field for routing data to different data tiers based on its value.