predict Search Operator
Uses a series of time-stamped numerical values to predict future values. The predict operator can be useful in the following cases:
- As an early warning system, alerting you when a threshold is about to be reached.
- For resource and capacity planning, helpful for determining seasonal impacts, like a Cyber Monday rush on an e-commerce site.
- Improved risk calculation.
For example, you'd use predict to take your current disk space capacity numbers, and predict when your system might run out of disk space. In these cases, the sooner an operations manager is informed that a key threshold is about to be reached the more effectively he or she can plan to avoid service degradation.
The predict operator supports two predictive models:
- Auto-regressive. Uses an advanced auto-regressive (AR) algorithm to learn patterns in the data. It automatically detects the cyclical patterns in the data and uses the cycles in its prediction.
- Linear regression. Uses existing data over the query time range as a training set to generate a linear model, and then extrapolates future values using this model.
If a missing data point is encountered in the generated time series, Sumo uses a zero value and issues a warning to alert you. If you'd like to use customized values, you can do so with the fillmissing operator.
Syntax
The syntax for predict varies depending on whether you use the linear regression model or the auto-regressive model. In either case, the following requirements apply:
- The query must contain an aggregate operator for example,
count, min, max, sumand so on. Aggregation must be by timeslice, for example,count by _timeslice. - The query must contain the
timesliceoperator. - Both the aggregate operator and the
timesliceoperator must precede thepredictoperator.
Syntax for the linear regression model
For the linear regression model:
... | timeslice 1m | count by _timeslice | predict _count by 1m
The linear regression algorithm produces the following fields in the output:
_countThe number of matches per minute for the currently selected time range._count_predictedValue predicted by the simple linear model._count_errorValue predicted by the simple linear model, minus the actual number.
Syntax for the auto-regressive model
... | timeslice 1m | count by _timeslice | predict _count by 1m model=ar, ar.window=n, forecast=n
The table below defines the parameters for running predict using the AR model.
| Parameter | Description |
|---|---|
model=ar | Required. Use this parameter to use the AR model, rather than a simple linear regression. |
ar.window | Optional. Use this parameter to specify the number of consecutive data points on which to base the prediction. The window size greatly impacts the performance of the autoregressive model. As a result, Sumo Logic automatically chooses the best default value for your query. The auto-regressive model requires more data points than the linear regression option to train a proper model. We recommended that you generate more than 100 data points for the AR model. If the number of data points is less than 100, Sumo Logic displays a warning stating that the learned model may not be optimal. If you want to customize the window size, we recommend that you to set the window size to be larger than 40% of the data points in the time series. However, don’t make the window size too large. The maximum would be 50%. Otherwise, the model will not be trained properly. |
forecast | Optional. Use this option to specify the duration of the prediction, either in terms of data points or minutes. The forecast parameter uses the same syntax as the timeslice operator and accepts either:* A simple number, such as forecast=5, which predicts five data points into the future.* A time granularity, such as forecast=5m, which predicts five minutes into the future.If you don’t specify a value for the forecast parameter, the operator will default to three data points into the future, or forecast=3. |
In the following query, the first three lines count the number of messages that contain an error term for every half minute. The last line uses the auto-regressive model to predict 100 data points in the future, based on 50 data points.
_sourceCategory=taskmanager jobState=InQueue error | timeslice 30s | count by _timeslice | predict _count by 30s model=ar,ar.window=50,forecast=100
The auto-regressive algorithm produces the following fields in the output:
_countThe number of errors per 30-second timeslice._count_predictedValue predicted by the auto-regressive algorithm._count_linearValue predicted by the simple linear regression._count_errorValue predicted by the simple linear regression minus the actual number.
Limitations
These internal limitations are meant to provide "speed bumps" to ensure the best performance.
predictwill not use more than 10,000 input points to estimate the model.predictwill not forecast more than 100 points into the future.predictwill not interpolate more than 20,000 input points. Predict adds "phantom" input points where there should be a timeslice, but no data point is present.
Cyclical patterns and the auto-regressive model
If there are cyclical patterns that fit within the ar.window, the auto-regressive algorithm will learn the cyclical pattern and use that in prediction.
For example, if there is an hourly cyclical pattern, the following query will learn that cycle:
... | timeslice 5m
| <aggregate function> by _timeslice as _val
| predict _val by 5m model=ar, ar.window=15
In this query, the window size (15 consecutive data points) covers more than 1 hour (15 data points * 5m interval = 75 minutes). So if there are cyclical patterns with a period of less than 75 minutes, the model will discover them.
Examples
predict using linear regression
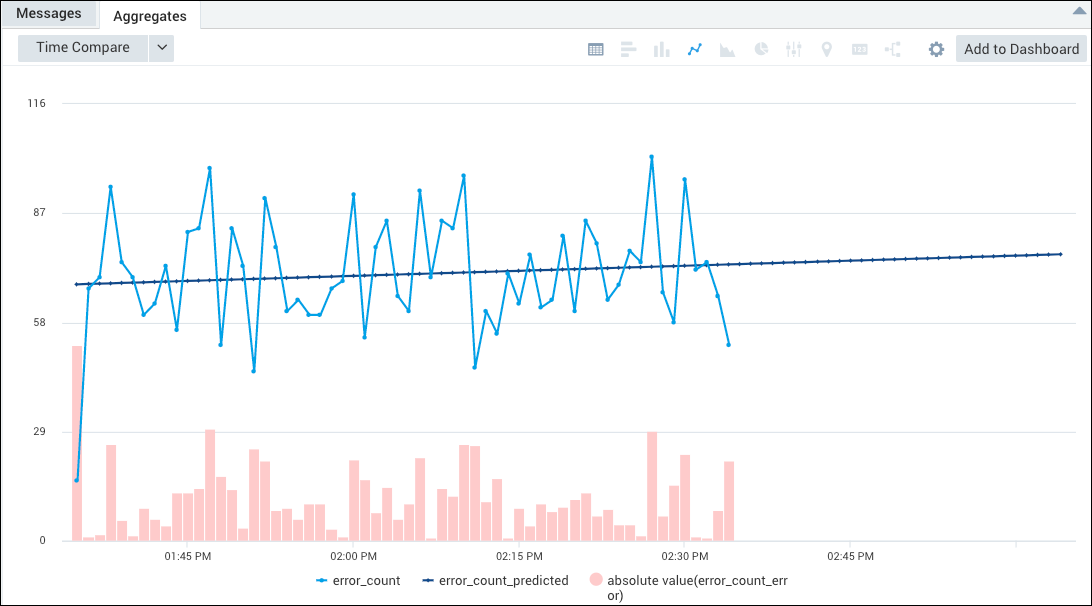
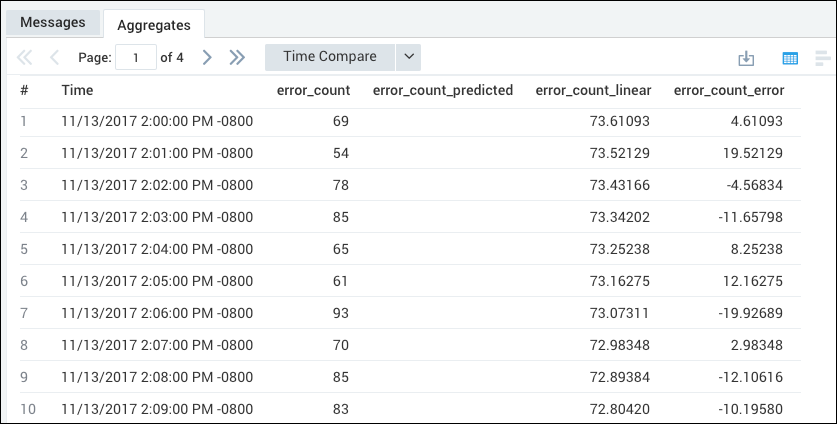
This query predicts the count of 404 errors per minute using linear regression.
_sourceCategory=Labs/Apache/Access status_code=404 | timeslice 1m | count(status_code) as error_count by _timeslice | predict error_count by 1m
The query returns an aggregation table with columns for error_count, error_count_predicted, and error_count_error.
From here, you can select the Line Chart icon, and automatically create a Combo Chart that represents the error_count_error as a column chart, and the error_count and error_count_predicted mapped on top of that with separate lines. Note that the (absolute value)_count_error series is toggled off by default. Click it in the legend to display the column chart.
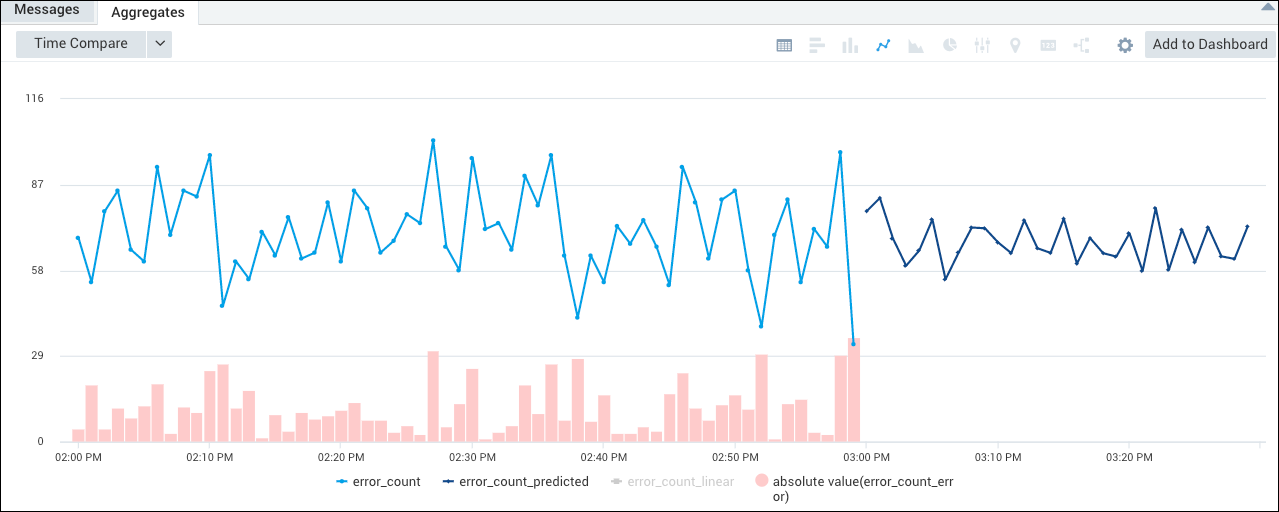
predict using auto-regressive model
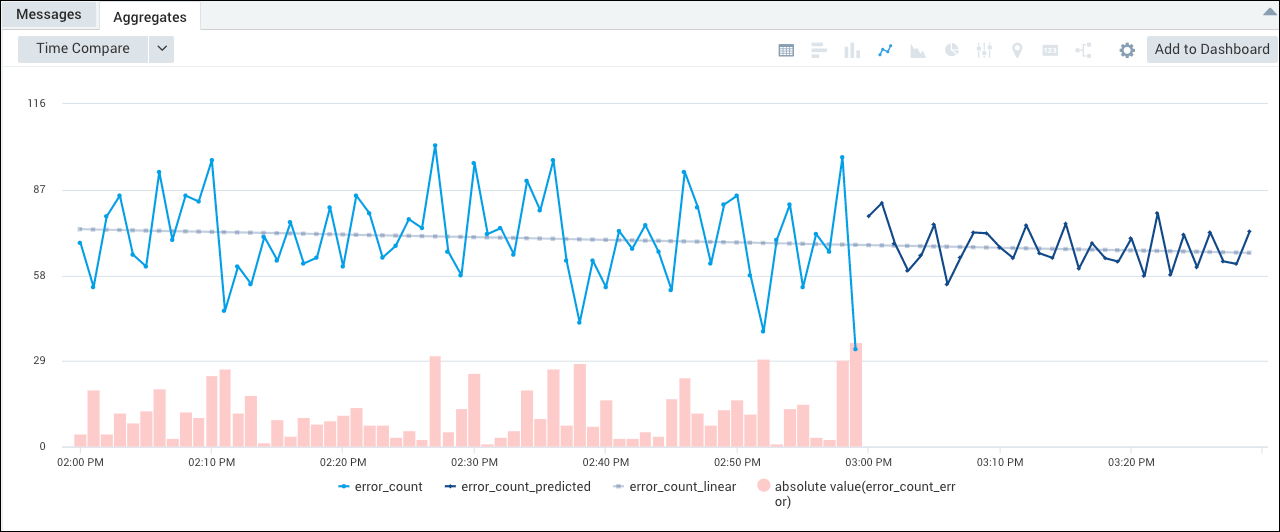
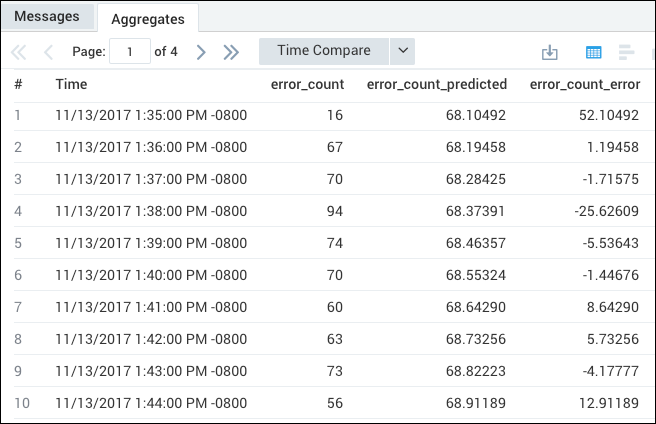
This query predicts the count of 404 errors per minute using the auto-regressive model.
_sourceCategory=Labs/Apache/Access status_code=404 | timeslice 1m | count(status_code) as error_count by _timeslice | predict error_count by 1m model=ar
The query returns an aggregation table with columns for error_count, error_count_predicted, error_count_linear, and _error_count_error.
From here, you can select the Line Chart icon, and automatically create a Combo Chart that represents the error_count_error as a column chart, and the error_count and error_count_predicted mapped on top of that with separate lines. Note that the (absolute value)_count_error series is toggled off by default. Click it in the legend to display the column chart.
Note that, if desired, you can display the _count_linear series, to see the value predicted by the simple linear regression model by clicking it in the legend.