Transaction Operator
No matter what type of data you are analyzing, from tracking website sign ups, to e-commerce data, to watching system activity across a distributed system, the transaction operator can be used in a variety of use cases. Ultimately, data is always ordered, at least by timestamp. But during analysis, the transaction operator can process otherwise unordered data and produce results using ordered data (data that has an ordered flow).
For example, if you operated a retail website, you'd use the transaction operator to track your customer's movements through the log events that determine the states of their transaction, such as login, cart, payment, and checkout. From the results of your query, you'd visualize your customers as they move or "flow" through the site as a Flow Diagram, and identify any problems, such as a drop-off at the payment state, which prevents them from completing their purchase.
The transaction operator requires:
- One or more transaction IDs to group related log messages together. You could use session IDs, IPs, username, email, or any other unique IDs that are relevant to your query. You will define transaction IDs in a query. The transaction IDs are extracted using operators such as parse and parse regex.
- Mapping from a log message to a state. Specify the mapping from a log message to a state through the syntax of the matches operator, or through fields that are already parsed.
Syntax
transaction on <field1> [, <field2>]... [fringe=<timespec>] with <states> results by [transactions | states | flow]
States act as matching statements, searching your log for that specific state. These support wildcards * to match on any characters. For example, in the following log, if one of the states you needed to capture was when a session is started based on your parsed field sessionId:
2018-02-15 13:00:28,799 -0800 INFO [hostId=nite-spark-app-1] [module=sumo-app] [localUserName=sumo-app] [logger=sumo.app.SumoAppSearchSessionProtocolHandler] [thread=DTP-soa.sumo-app-soa.SearchSessionProtocol-32] [auth=Customer:0000000000000111:0000000000000111:0000000000000111:false:DefaultSumoSystemUser:-1:UNKNOWN] [sessionId=B6C329D84D1E37C6] [customer=0000000000000111] [remotemodule=sumo-app] Starting session B6C329D84D1E37C6
you'd specify the state as a matching statement on the sessionId like this:
| transaction on sessionid with "* Starting session *" as init
Defining states
Think of states as a way of using log events and fields in your logs to plot the movement of data. The transaction operator needs to have these states defined to produce results. There are two ways you can define states.
- Match String
- States
Syntax:
"<match string>" [in <fieldName>] as <stateName>
Example:
with "*LinkAccountAction category=Google*" as linkGoogle,
with "*LinkAccountAction category=Facebook*" as linkFacebook,
with "*LinkAccountAction category=LinkedIn*" as linkLinkedIn,
with "*LinkAccountAction category=Other*" as linkOther
Syntax:
states <state1> [as <alias1>] [,<state2> [as <alias2>]]... [in <fieldName>]
Example:
with states login, cart, checkout, shipping, shipping_method, billing, %"Labs/Apache/Access"
The state is the text in the field.
Once states have been defined for ordered data, you can use them to order data using the fromstate and tostate arguments, described in the next section.
Ordered vs Unordered data
When used with ordered data, you can monitor the transition between two distinct states, allowing you to build a Flow Diagram to visually represent the transitions a transaction goes through, and the number of transactions between transitions. On unordered data, you can use the transaction operator to build a table of results.
The difference between ordered and unordered data is the flow (order) that you define in a transaction query. Both types of data require you to define states. Ordered data is returned when specifying results by flow by referring to the latency between states. There will be a latency field generated by the operator that provides the milliseconds between states.
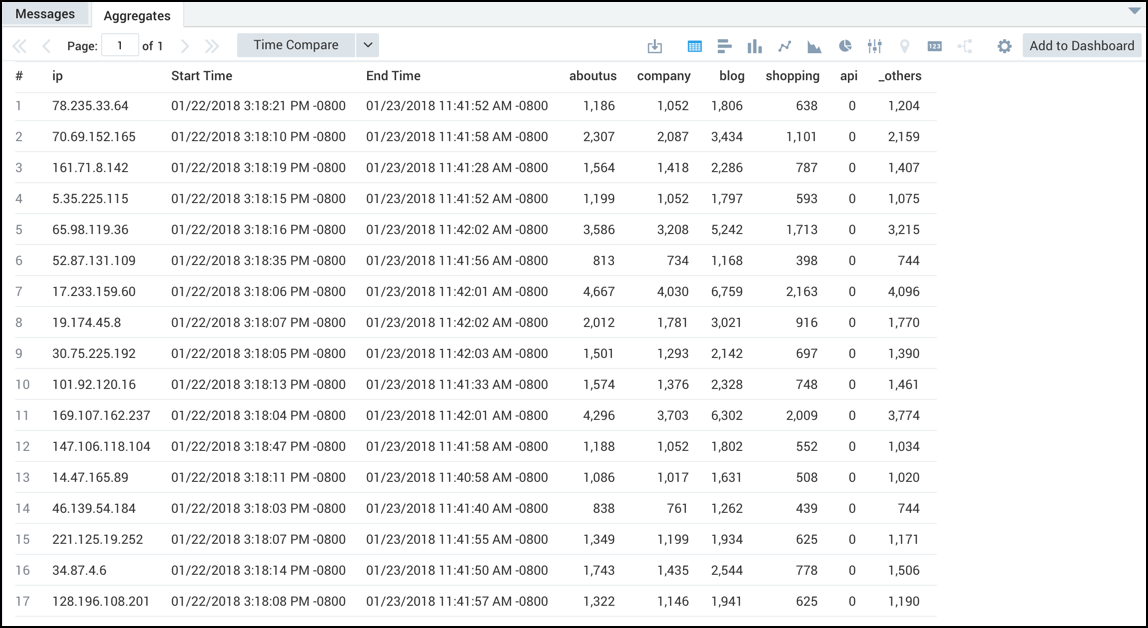
Below you will see two nearly identical queries. On the left, unordered data is searched, and the results are displayed in a table. On the right, by adding results by flow as well as counting the max latency between each fromstate and tostate, we can build a Flow Diagram.
- Unordered
- Ordered
_sourceCategory=oursite
| where !(user_agent matches "*Pingdom*")
| where status_code = "200"
| parse regex "(?<ip>\d{1,3}\.\d{1,3}\.\d{1,3}\.\d{1,3})"
| parse regex field=url "^/(?<urlprefix>[A-Za-z0-9.-]+)"
| fields urlprefix, ip
| replace(urlprefix, "-", "") as urlprefix
| transaction on ip with states aboutus, company, blog, shopping, api in urlprefix
_sourceCategory=oursite
| where !(user_agent matches "*Pingdom*")
| where status_code = "200"
| parse regex "(?<ip>\d{1,3}\.\d{1,3}\.\d{1,3}\.\d{1,3})"
| parse regex field=url "^/(?<urlprefix>[A-Za-z0-9.-]+)"
| fields urlprefix, ip
| replace(urlprefix, "-", "") as urlprefix
| transaction on ip with states aboutus, company, blog, shopping, api in urlprefix results by flow
| count, max(latency) by fromstate, tostate
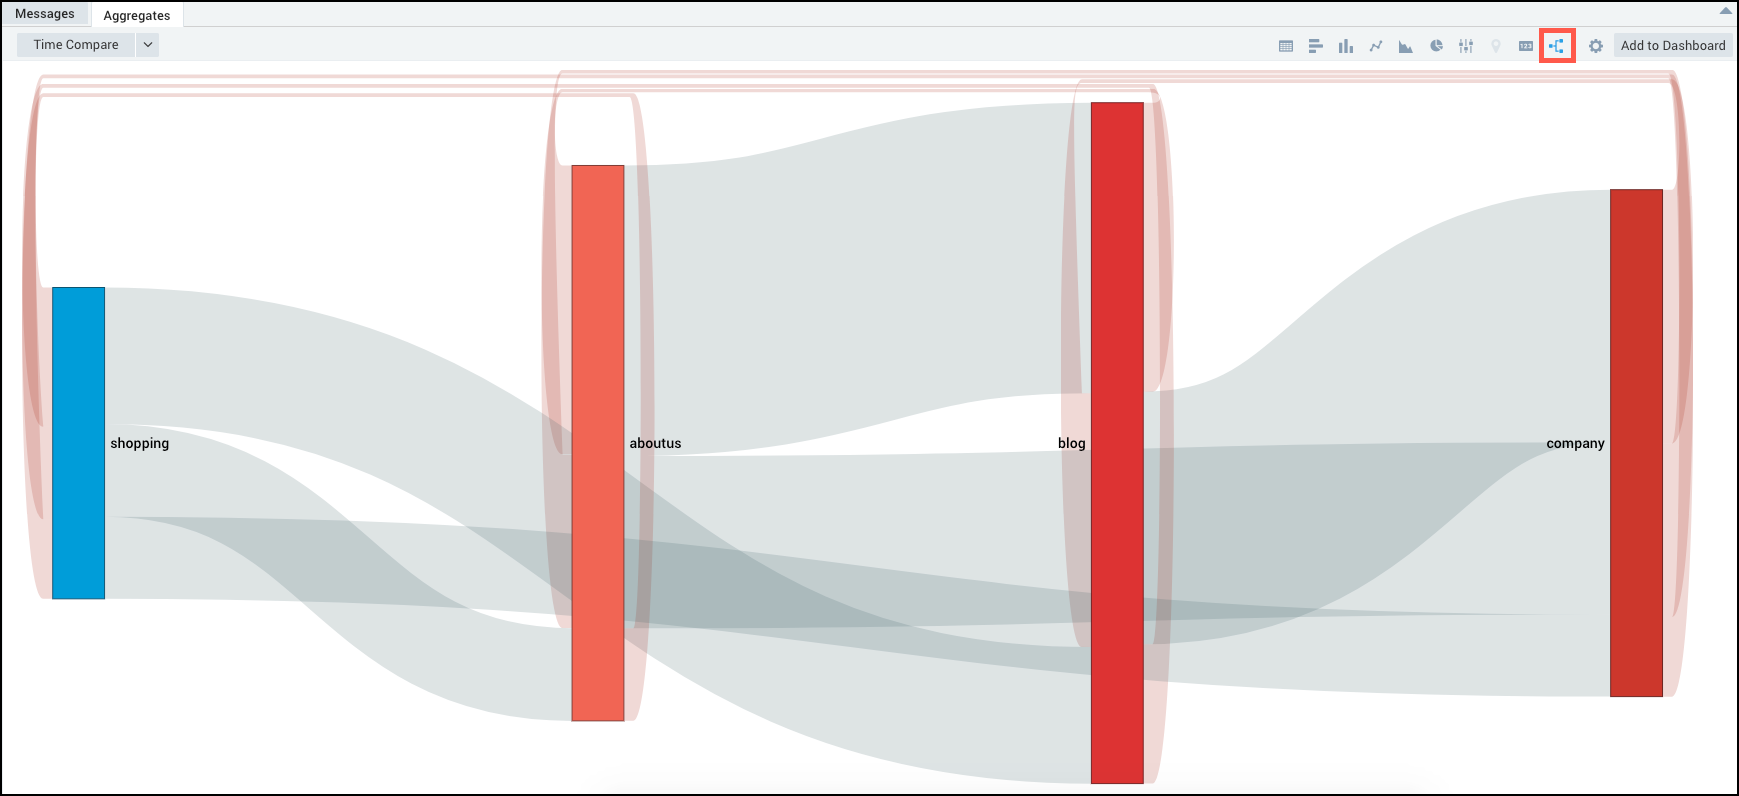
Loop back
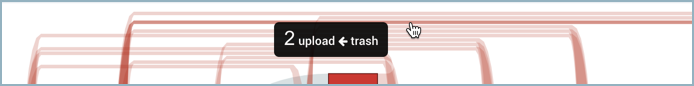
Loop backs in the flow (order) of states are tracked and displayed as red lines looping over the respective states in the flow diagram. You can hover over the loops to view the number of occurrences respective states had returned to a previous state.
Specifying a fringe cut-off
Since transaction operator queries are constrained by a time window, some transactions may be cut off if they occur near the edges of the time window. It is possible to filter them out using the fringe argument.
If tw is the time window for a query, then transactions that satisfy the following will be filtered out:
- ends in [tw.start, tw.start + fringe)
- starts in (tw.end - fringe, tw.end]
For example:
... | transaction on sessionid fringe=10m
with "Starting session *" as init,
with "Initiating countdown *" as countdown_start,
with "Countdown reached *" as countdown_done,
with "Launch *" as launch
results by transactions
Limitations
For ordered data, there is a group limit of 10,000. The transaction operator uses a least recently used scheme to phase out transactions. So when this limitation is reached, the transactions that are included in the results are not the first 10,000 transactions, but the 10,000 most-frequently used transactions. This is due to the fact that some earlier transactions have ended prematurely, as stated in the following error.
This message is displayed if you use more than 10,000 groups with the Transaction operator:
Group or memory limit exceeded, some transactions may have ended prematurely.
For unordered data, once group limit of 10,000 is reached, new transactions are ignored.
Transaction Examples
The following examples can help you understand the way transaction works.
Running transaction on sessionID
When you use the transaction operator, it requires one or more transaction IDs to group related log messages together. For this ID, you can use session IDs, IPs, username, email, or any other unique IDs that are relevant to your query.
In this example, using the browser sessionID as the transaction ID, we could define states for countdown_start and countdown_done:
... | transaction on sessionid
with "Starting session *" as init,
with "Initiating countdown *" as countdown_start,
with "Countdown reached *" as countdown_done,
with "Launch *" as launch
results by transactions showing max(_messagetime),
sum("1") for init as initcount
Use fields created by transaction
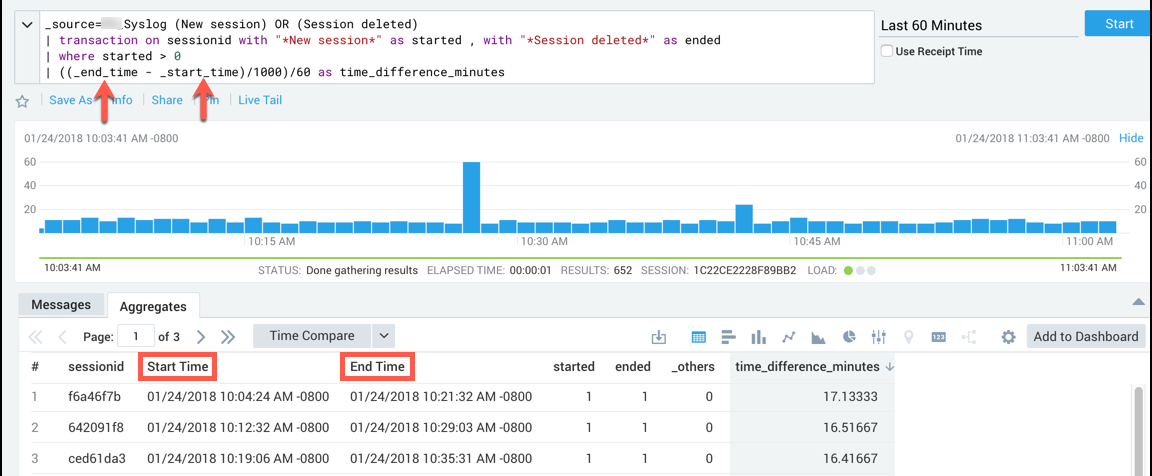
There are two fields created by the transaction operator, _start_time and _end_time. These fields show up as Start Time and End Time on the Aggregates tab, but you must reference them in queries using the names with underscores or we will not recognize them.
The fields are assigned a timestamp in milliseconds.
For example, in the query:
_source=Syslog (New session) OR (Session deleted)
| transaction on sessionid with "*New session*" as started, with "*Session deleted*" as ended
| where started > 0
| ((_end_time - _start_time)/1000)/60 as time_difference_minutes
You reference the _end_time and _start_time fields to calculate the duration of the sessionid.
Detecting a potential e-commerce failure
In this example, you'd track the states of your e-commerce site to see if there is a disconnect or drop off between two states that would indicate a potential failure.
Running a query similar to:
_sourceCategory=[sourceCategoryName]
| parse regex "(?<ip>[0-9]{1,3}\.[0-9]{1,3}\.[0-9]{1,3}\.[0-9]{1,3})" nodrop
| transaction on ip
with "*/cart*" as cart,
with "*/shippingInfo*" as shipping,
with "*/billingInfo*" as billing,
with "*Verifying credit card with external service*" as billingVerification,
with "*/confirmation*" as confirmation,
with "*Order shipped*" as ordershipped
results by flow
| count by fromstate, tostate
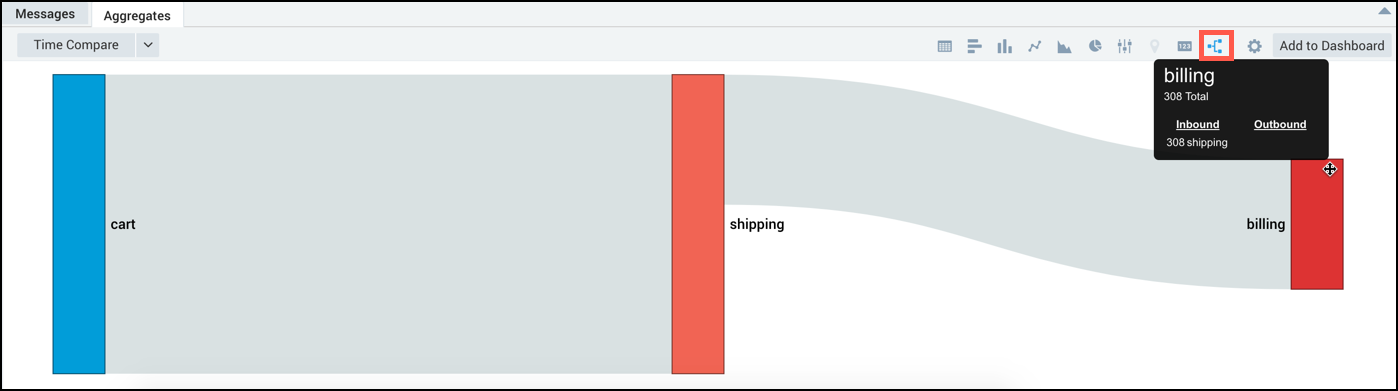
could produce a Flow Diagram with normal drop-off rates at the different states: cart, shipping, billing, billingVerification, confirmation, and ordershipped.
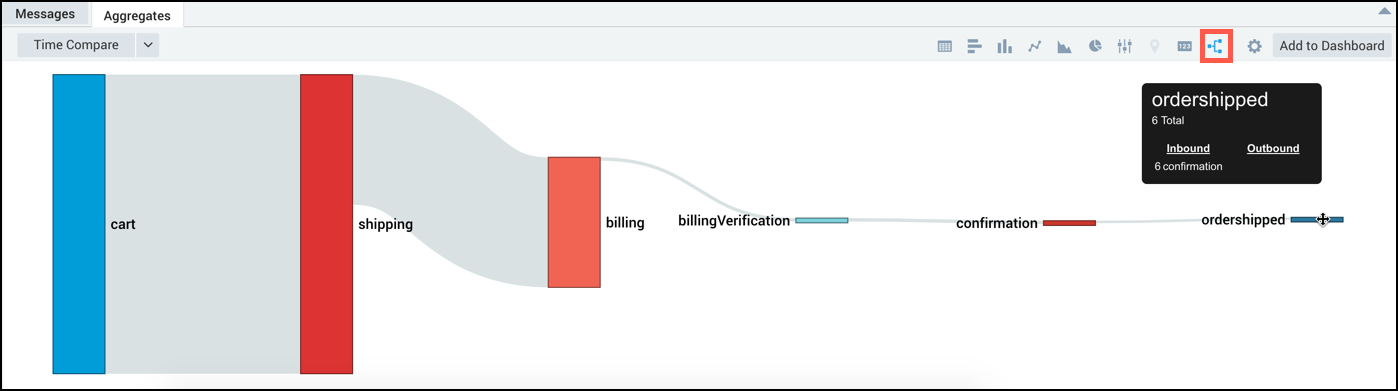
Now, if you ran this query and saw results as shown below, where there is a big drop-off at the verification state, you'd determine that there is likely a problem with the verification service and start an investigation.