Amazon MSK Prometheus metrics collection
Amazon Managed Streaming for Apache Kafka (Amazon MSK) Open Monitoring, exposes Kafka metrics to third-party sources to monitor and troubleshoot MSK clusters. This section provides instructions for configuring metrics collection for Amazon MSK.
Collecting Amazon MSK metrics
Amazon MSK is a fully managed service that allows you to build and run applications that use Apache Kafka to process streaming data. In the following procedure you will configure a collector and source, create a client machine, and gather information on your MSK cluster for use with Telegraf, a plugin-driven server agent for collecting and sending metrics and events.
Step 1: Configure a collector and source
In this step, you set up a Sumo Logic hosted collector and then configure an HTTP source.
To configure a collector and source, do the following:
- Set up a Hosted Collector.
- Configure an HTTP Source.
Step 2: Create a client machine
In this step you create a client machine where metrics can be accessed for use with Sumo Logic.
To create a client machine, do the following:
- Ensure you have an Amazon MSK Cluster that is up and running.
- Follow these steps in the Amazon MSK documentation to create a client machine.
Step 3: Gather information on nodes and endpoints
In this step, you will get a list of the nodes running on the cluster and gather the necessary information for all the endpoints.
To gather information on cluster nodes and endpoints, do the following:
-
Run the following AWS CLI command to get a list of cluster nodes. Replace the variable with the Amazon Resource Name (ARN) of your MSK cluster.
aws kafka list-nodes --cluster-arn <INSERT_MSK_CLUSTER_ARN_HERE> -
Make a note of each of the endpoints for the cluster nodes in your MSK cluster. The following example shows the entry for a single node, and the endpoint for the node is bolded.
{
"NodeInfoList": [
    {
        "AddedToClusterTime": "2019-11-22T23:35:13.733Z",
        "BrokerNodeInfo": {
            "AttachedENIId": "eni-0a80fff4826abcf57",
            "BrokerId": "3",
            "ClientSubnet": "subnet-0316ee383dd23816d",
            "ClientVpcIpAddress": "10.0.1.17",
            "CurrentBrokerSoftwareInfo": {
                "KafkaVersion": "2.2.1"
            },
            "Endpoints": [
                "b-3.prometheustest.hm95de.c6.kafka.us-east-1.amazonaws.com"
            ]
        },
        "InstanceType": "m5.large",
        "NodeARN": "arn:aws:kafka:us-east-1:244663422124:broker/PrometheusTest/b19b9b3c-317a-496d-8ef7-677b79f0259a-6/350ea803-2456-4167-b8eb-f618aa28b041",
        "NodeType": "BROKER"
    },
    ...
    ]
}
Step 4: Install and configure Telegraf
In this step, you will install and configure Telegraf, a plugin-driven server agent for collecting and sending metrics.
To install and configure Telegraf, do the following:
-
Go to the client machine you created in Step 2.
-
Install Telegraf using these instructions.
-
Create a configuration file for Telegraf. The following example describes the required components of the Telegraf configuration file.
noteFor each node in your MSK cluster, you need two URLS in the Prometheus input section. Use the URL for the node you determined in Step 3, as in the following example:
<MSK_NODE>:11001/metricsis the JMX Exportermetrics<MSK_NODE>:11002/metricsis the Node Exportermetrics
[agent]
# The interval property in the agent tells telegraf how often to scrape the metrics.
    interval = "60s"

[[inputs.prometheus]]
# For each node in your MSK cluster, you will need to have two urls in the Prometheus input section.
    urls = ["http://b-1.prometheustest.h295de.c6.kafka.us-east-1.amazonaws.com:11001/metrics",
    "http://b-1.prometheustest.h295de.c6.kafka.us-east-1.amazonaws.com:11002/metrics"]


[[outputs.http]]
# The URL for the HTTP source you created in Step 1.
    url = "https://endpoint3.collection.us2.sumologic.com/receiver/v1/http/XXXXXX" data_format = "carbon2"
    [outputs.http.headers]
    Content-Type = "application/vnd.sumologic.carbon2"
    X-Sumo-Category = "amazon-msk/metrics"
Step 5: Start Telegraf and query new metrics
In this step, you will start Telegraf and begin querying the new metrics.
To start Telegraf and query new metrics, do the following:
-
Run the following command to start Telegraf. For more information, read this documentation.
telegraf --config /path/to/telegraf.conf -
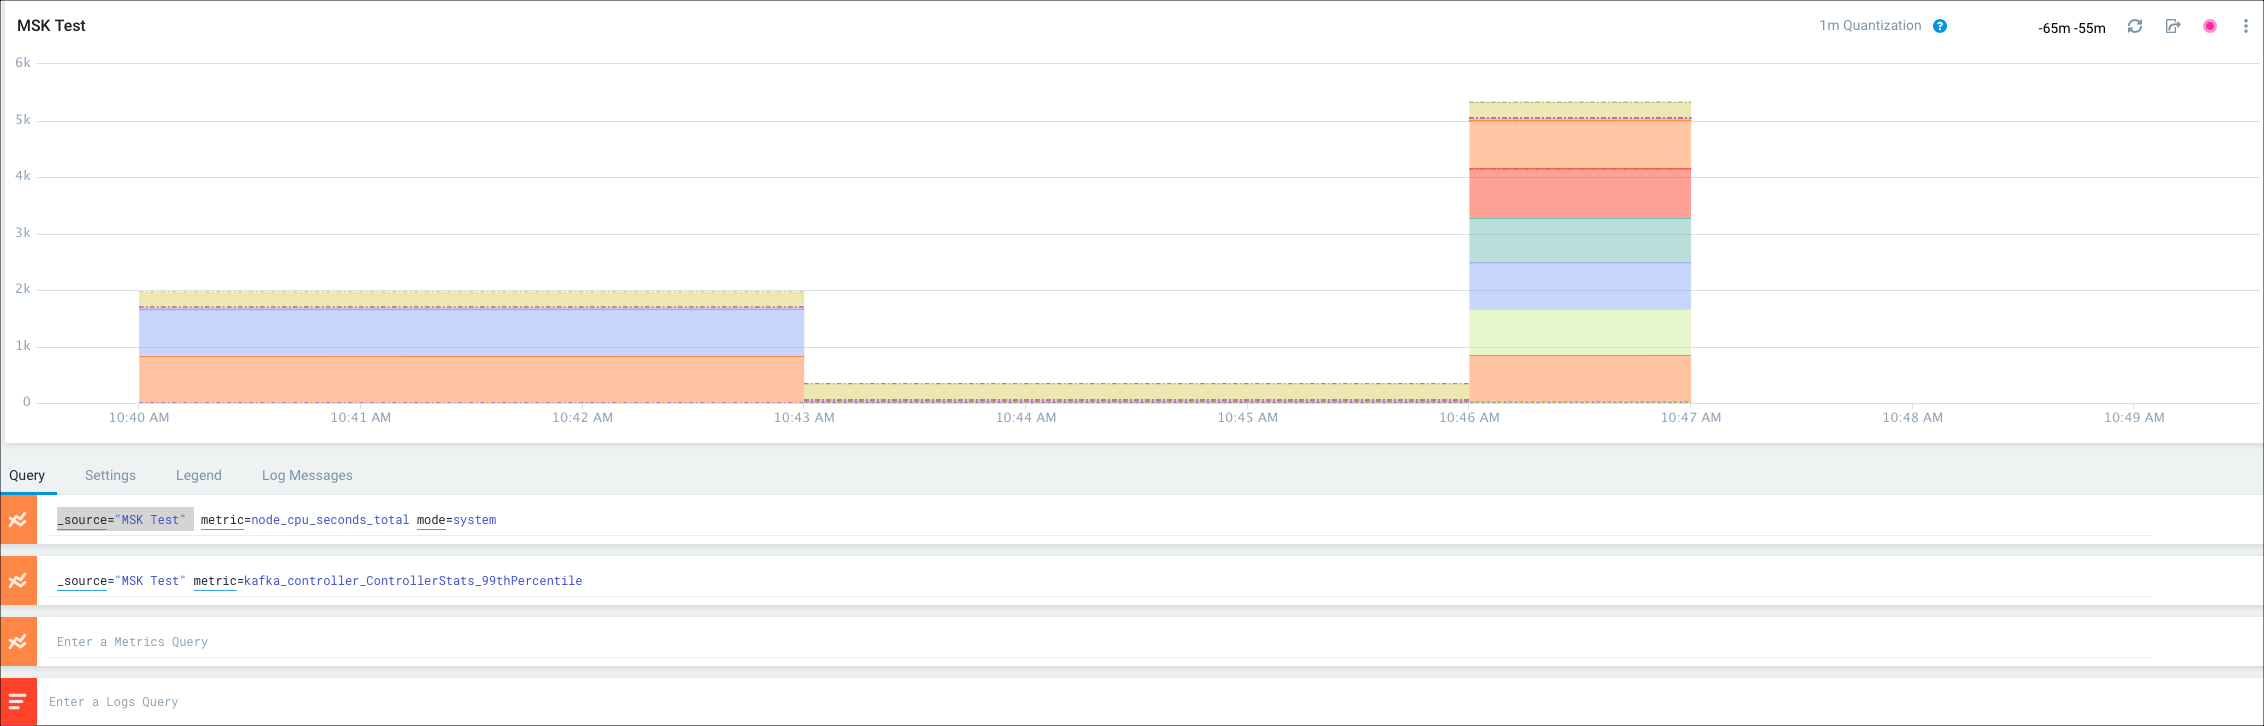
Query for these new metrics in Sumo Logic by writing Metrics queries, as shown in the following example.
For more information on using Telegraf to get data into Sumo Logic, see this page on collecting metrics with Telegraf.