Azure Monitoring
This page has information about Sumo’s solution for obtaining application and infrastructure data (logs and metrics) for Azure services using Azure Monitor. This solution enables you to collect following data:
- Activity Logs. Activity Logs are subscription-level logs that provide insight into the operations performed on resources in your subscription, for example, creating a virtual machine or deleting a logic app.
- Diagnostics Logs. Diagnostics Logs are resource-level logs that provide insight into operations that were performed within a resource itself, for example, getting a secret from a Key Vault.
- Metrics. Metrics provide performance statistics for different resources and the operating system in a virtual machine.
For information about metrics available from Azure Monitor and resource type-specific information about Azure Diagnostic logs, see the following topics in Azure help:
Solution overview
Azure Monitor provides a pipeline for shipping monitoring data out of Azure to a partner monitoring tool like Sumo Logic. Logs and metrics for most Azure services can be obtained from Azure Monitor.
For a general discussion of Microsoft’s approach to sharing monitoring data from Azure Monitor with external apps, see Stream Azure monitoring data to an event hub for consumption by an external tool.
The diagram below illustrates the Azure-Sumo pipelines for Azure log and metric collection. Monitoring data flow describes the flow of data from Azure services to Sumo Logic. Pipeline Components describes the actors in the flow.
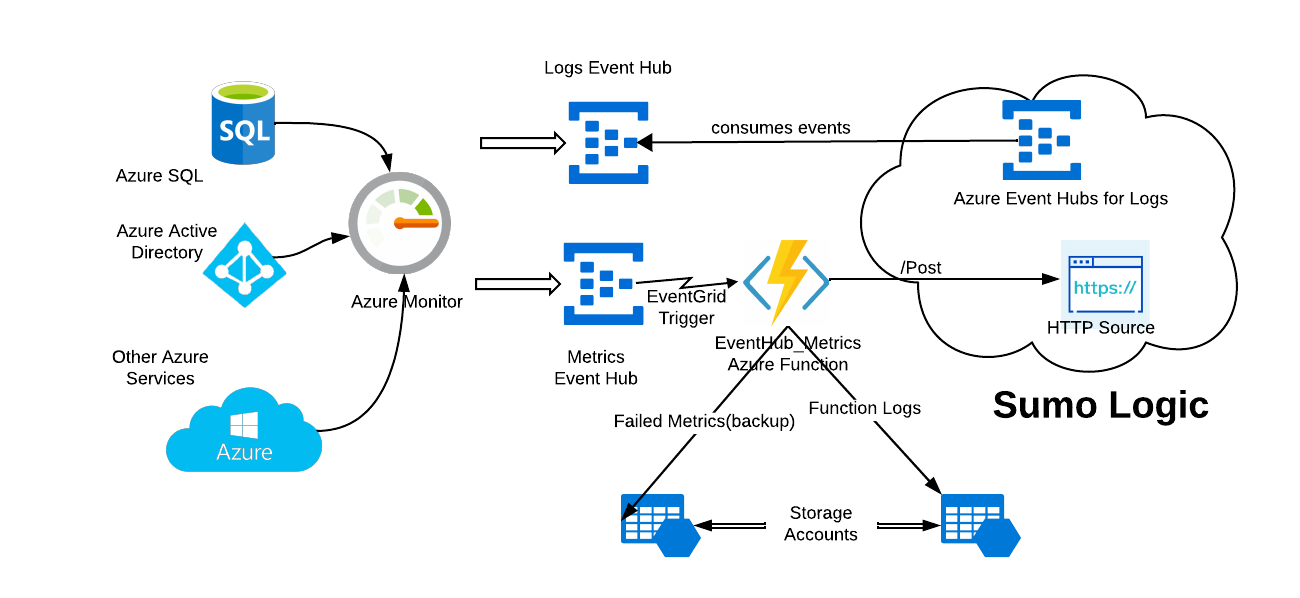
Monitoring data flow
Here’s a summary of how logs and metrics from Azure services get into Sumo Logic:
- Azure services send monitoring data (logs and metrics) to Azure Monitor.
- Azure Monitor streams the logs to a logs event hub and metrics to a metrics event hub.
- In case of metrics data flow pipeline, on receipt of data from Azure Monitor, an event hub with metrics data triggers an Azure function to send the metrics data onto an HTTP source configured on a hosted collector in the Sumo cloud.
- In case of logs data flow pipeline, user configures Azure Event Hubs Source for Logs in Sumo, after creating the source, Event Hubs consumers (hosted by Sumo Logic) connect to partitions using the user provided authentication information, and starts consuming from an event hub.
Pipeline components
The Azure-Sumo pipelines for Azure log and metric collection use event hubs, Sumo-provided Azure functions, Sumo-hosted Event Hub consumers to get monitoring data from Azure Monitor to Sumo. Here’s what each component does:
- Azure Monitor collects logs and metrics for most Microsoft Azure services, and serves as a pipeline for accessing to monitoring data from an Azure environment,
- Azure Event Hubs is a data streaming platform and event ingestion service that you can use to integrate Azure Monitor with Sumo Logic. Azure Monitor streams monitoring data to an event hub. Two separate Event Hubs instance are required one for metrics and one for logs.
- The Sumo Logic Azure functions are small pieces of code that are triggered by an Event Hub to send monitoring data to a Sumo HTTP source. Each of the functions also maintains its own logs: one for recording failures (when logs could not be sent to HTTP endpoint for some reason) and another for function debug information.
- A Sumo Logic HTTP source receives and ingests the monitoring data from the Azure function. This is used in metrics collection pipeline.
- A Azure Event Hubs Source for Logs consumes the log events from the Event Hub. It securely stores the required authentication, scheduling, and state tracking information. This is used in logs collection pipeline.
- The Sumo Azure functions are small pieces of code that are triggered by an Event Hub to send monitoring data to a Sumo HTTP source. Each of the functions also maintains its own logs: one for recording failures (when logs could not be sent to Sumo for some reason) and another for function debug information.
About the configuration process
Logs
You need to create a Event Hub namespace and Event Hub instance in Azure in the same region as the resource being monitored, configures a Shared Access Policy to the newly created Event Hub instance which is then used to configure a Azure Event Hubs Source to a Hosted Collector. Then, you can start pushing your monitoring data from Azure Monitor into Event Hub (created manually) by configuring Diagnostic Settings on your azure resource.
For detailed instructions, refer Azure Event Hubs Source for Logs.
Metrics
Sumo Logic provides Azure Resource Manager (ARM) templates to build the metric collection pipelines. This template creates an Event Hub to which Azure Monitor streams metrics, an Azure function for sending monitoring data to HTTP source, and Storage Accounts to which the function writes its own log messages about successful and failed transmissions. You download an ARM template, edit it to add the URL of your HTTP source, copy the template into Azure Portal, and deploy it. Then, you can start pushing your monitoring data from Azure Monitor into Event Hub (created by ARM template) by configuring Diagnostic Settings on your azure resource.
For detailed instructions, refer Collect Metrics from Azure Monitor.
Azure resource cost considerations
For information about Azure pricing, see Event Hubs pricing and Block Blob pricing.
Azure Integration FAQs
For answers to frequently asked questions about integrating Azure into an enterprise environment using ARM (Azure Resource Manager) architecture, see Azure Integration with ARM FAQ.