Collect Metrics from Azure Monitor
This section has instructions for configuring a pipeline for shipping metrics available from Azure Monitor to an Event Hub, on to an Azure Function, and finally to an HTTP source on a hosted collector in Sumo Logic. Azure Monitor collects metrics and well as logs. The pipeline described below is for metrics, not logs.
For information about Azure metrics, see Overview of metrics in Microsoft Azure in Azure help.
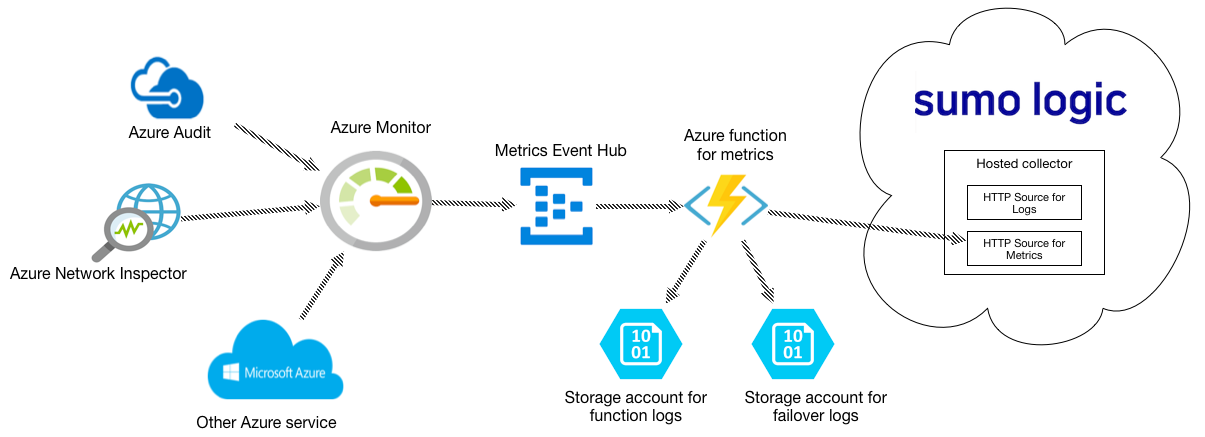
Here’s how the solution fits together:
- Azure Monitor collects metrics for most Microsoft Azure services and streams the data to an Azure event hub.
- Azure Event Hubs is a data streaming platform and event ingestion service. In this pipeline, an event hub streams the metrics collected by Azure Monitor to a Sumo-provided Azure function.
- The Azure function is a small piece of code triggered by the event hub to send metrics to the Sumo HTTP Source from the event hub, function logs to one Storage Account, and failover data to another. The trigger has to be activated by the customer.
For more information about the solution strategy, see Azure Monitoring.
Configure metric collection
This section has instructions for configuring collection of metrics from Azure Monitor.
Step 1. Configure an HTTP source
In this step, you configure an HTTP source to receive logs from the Azure function.
- Select a hosted collector where you want to configure the HTTP source. If desired, create a new hosted collector, as described on Configure a Hosted Collector.
- Configure an HTTP source, as described on HTTP Logs and Metrics Source.
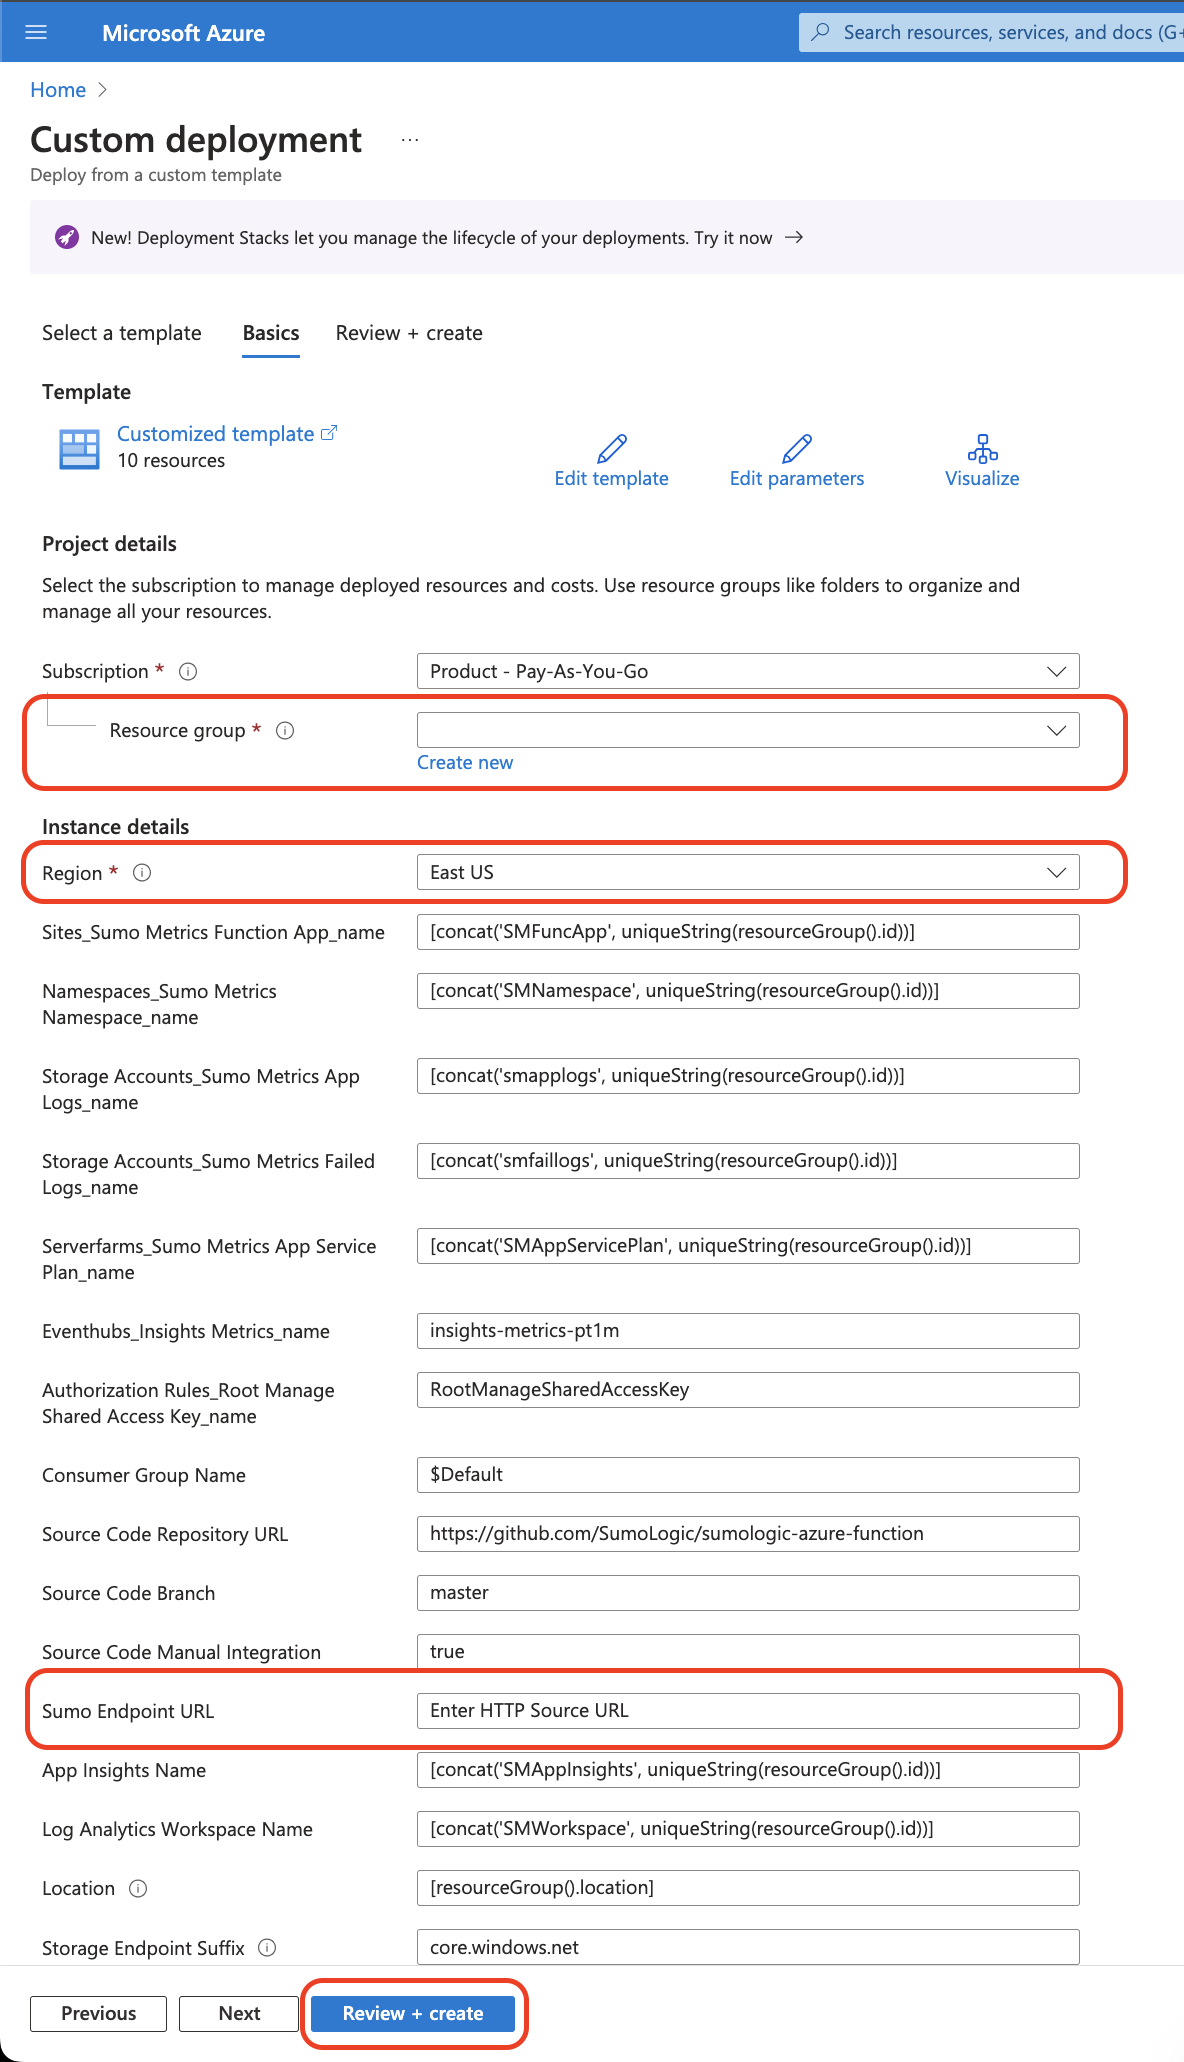
Step 2. Configure Azure resources using ARM template
In this step, you use a Sumo-provided Azure Resource Manager (ARM) template to create an Event Hub, an Azure function and two Storage Accounts. The Azure function is triggered by Event Hub. Two storage accounts are used to store log messages from the Azure function and failover data from Event Hub.
- Download the azuredeploy_metrics.json ARM template.
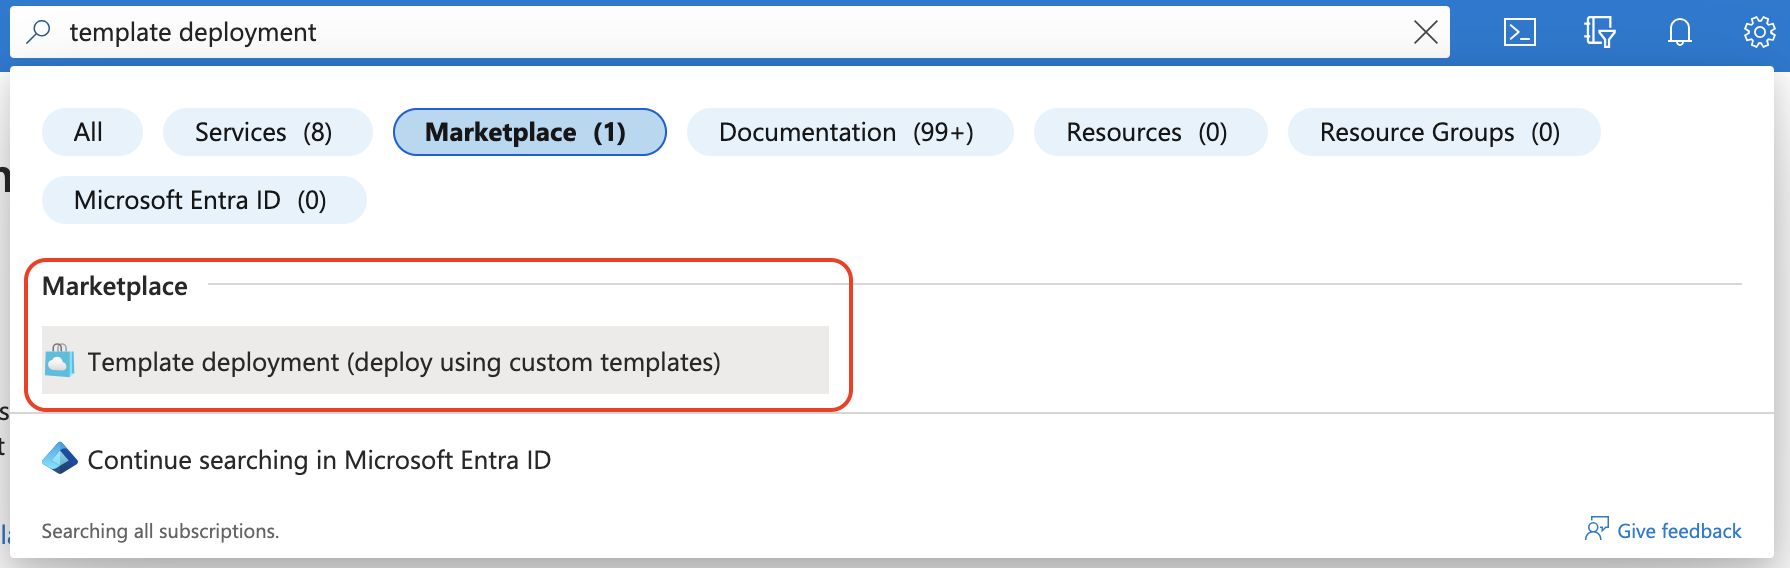
- Go to azure portal and search for template deployment in the search bar. Select Template deployment (deploy using custom templates) under Marketplace.
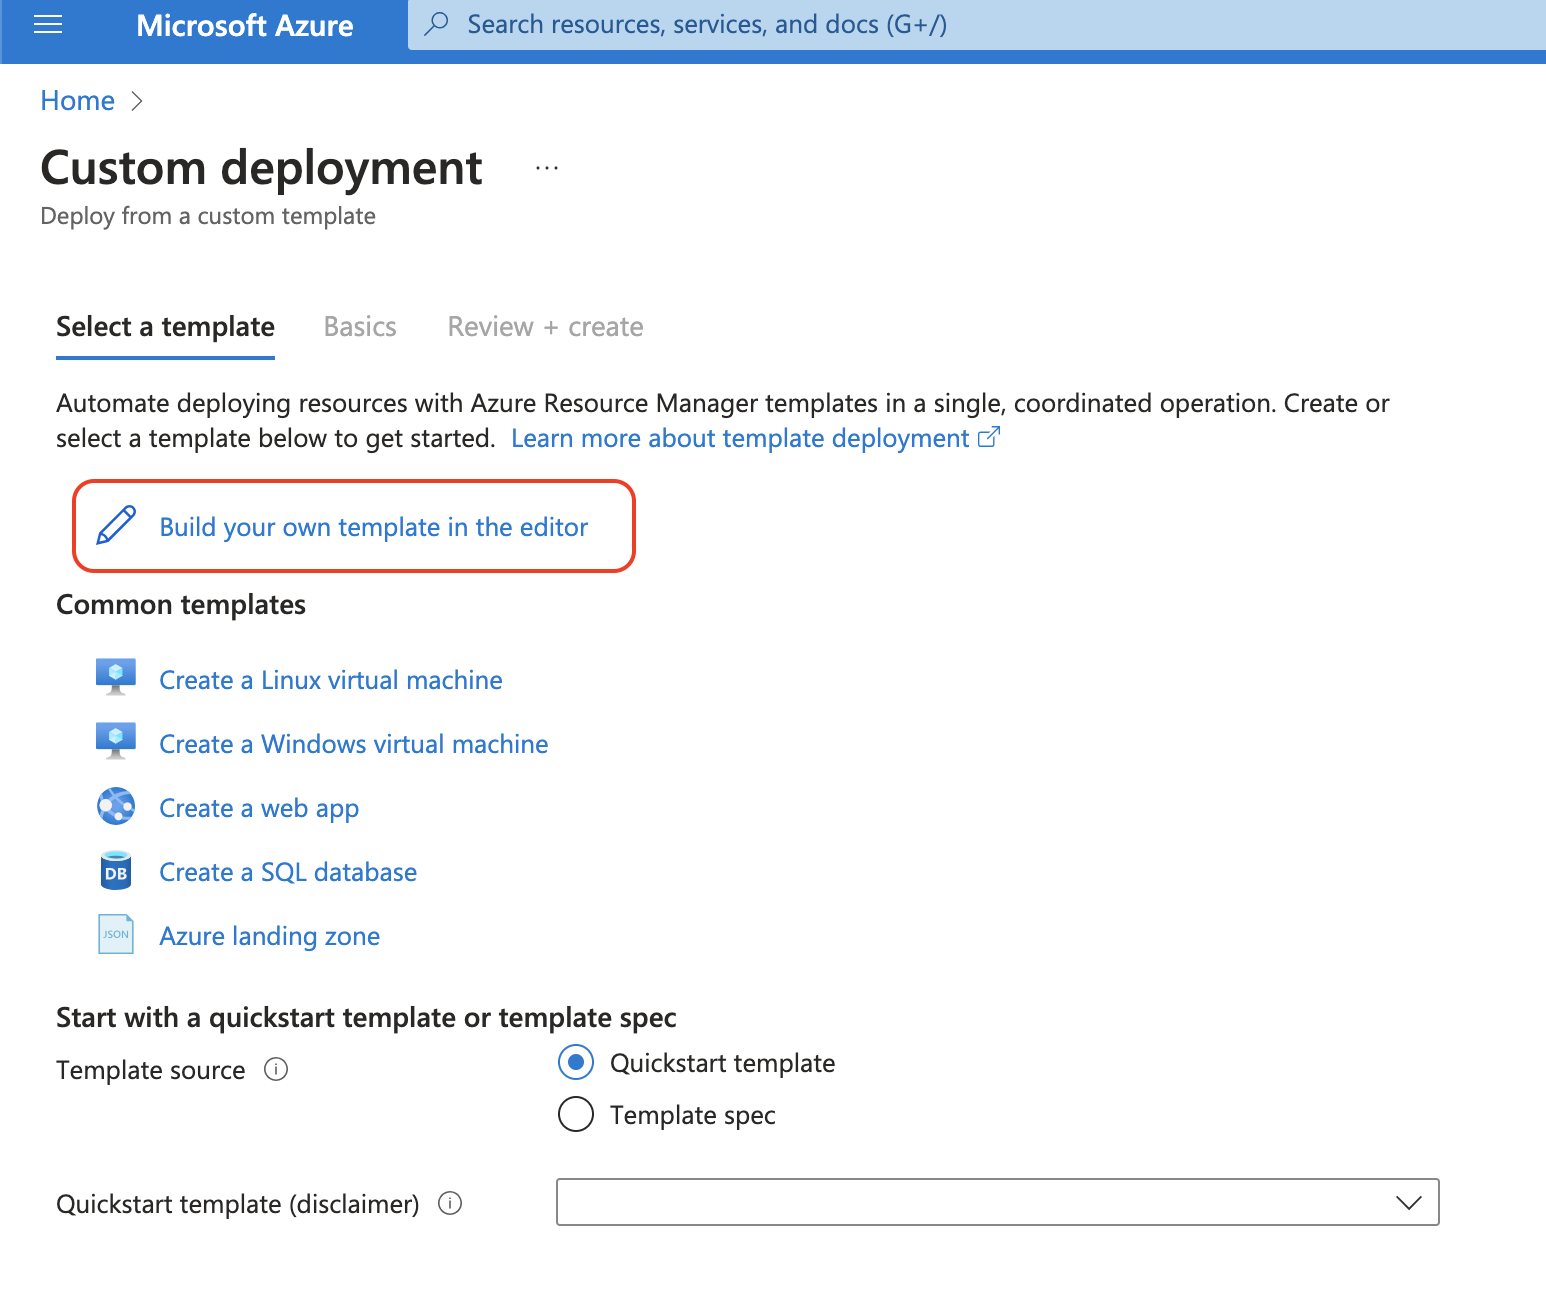
- On the Custom deployment blade, click Build your own template in the editor.
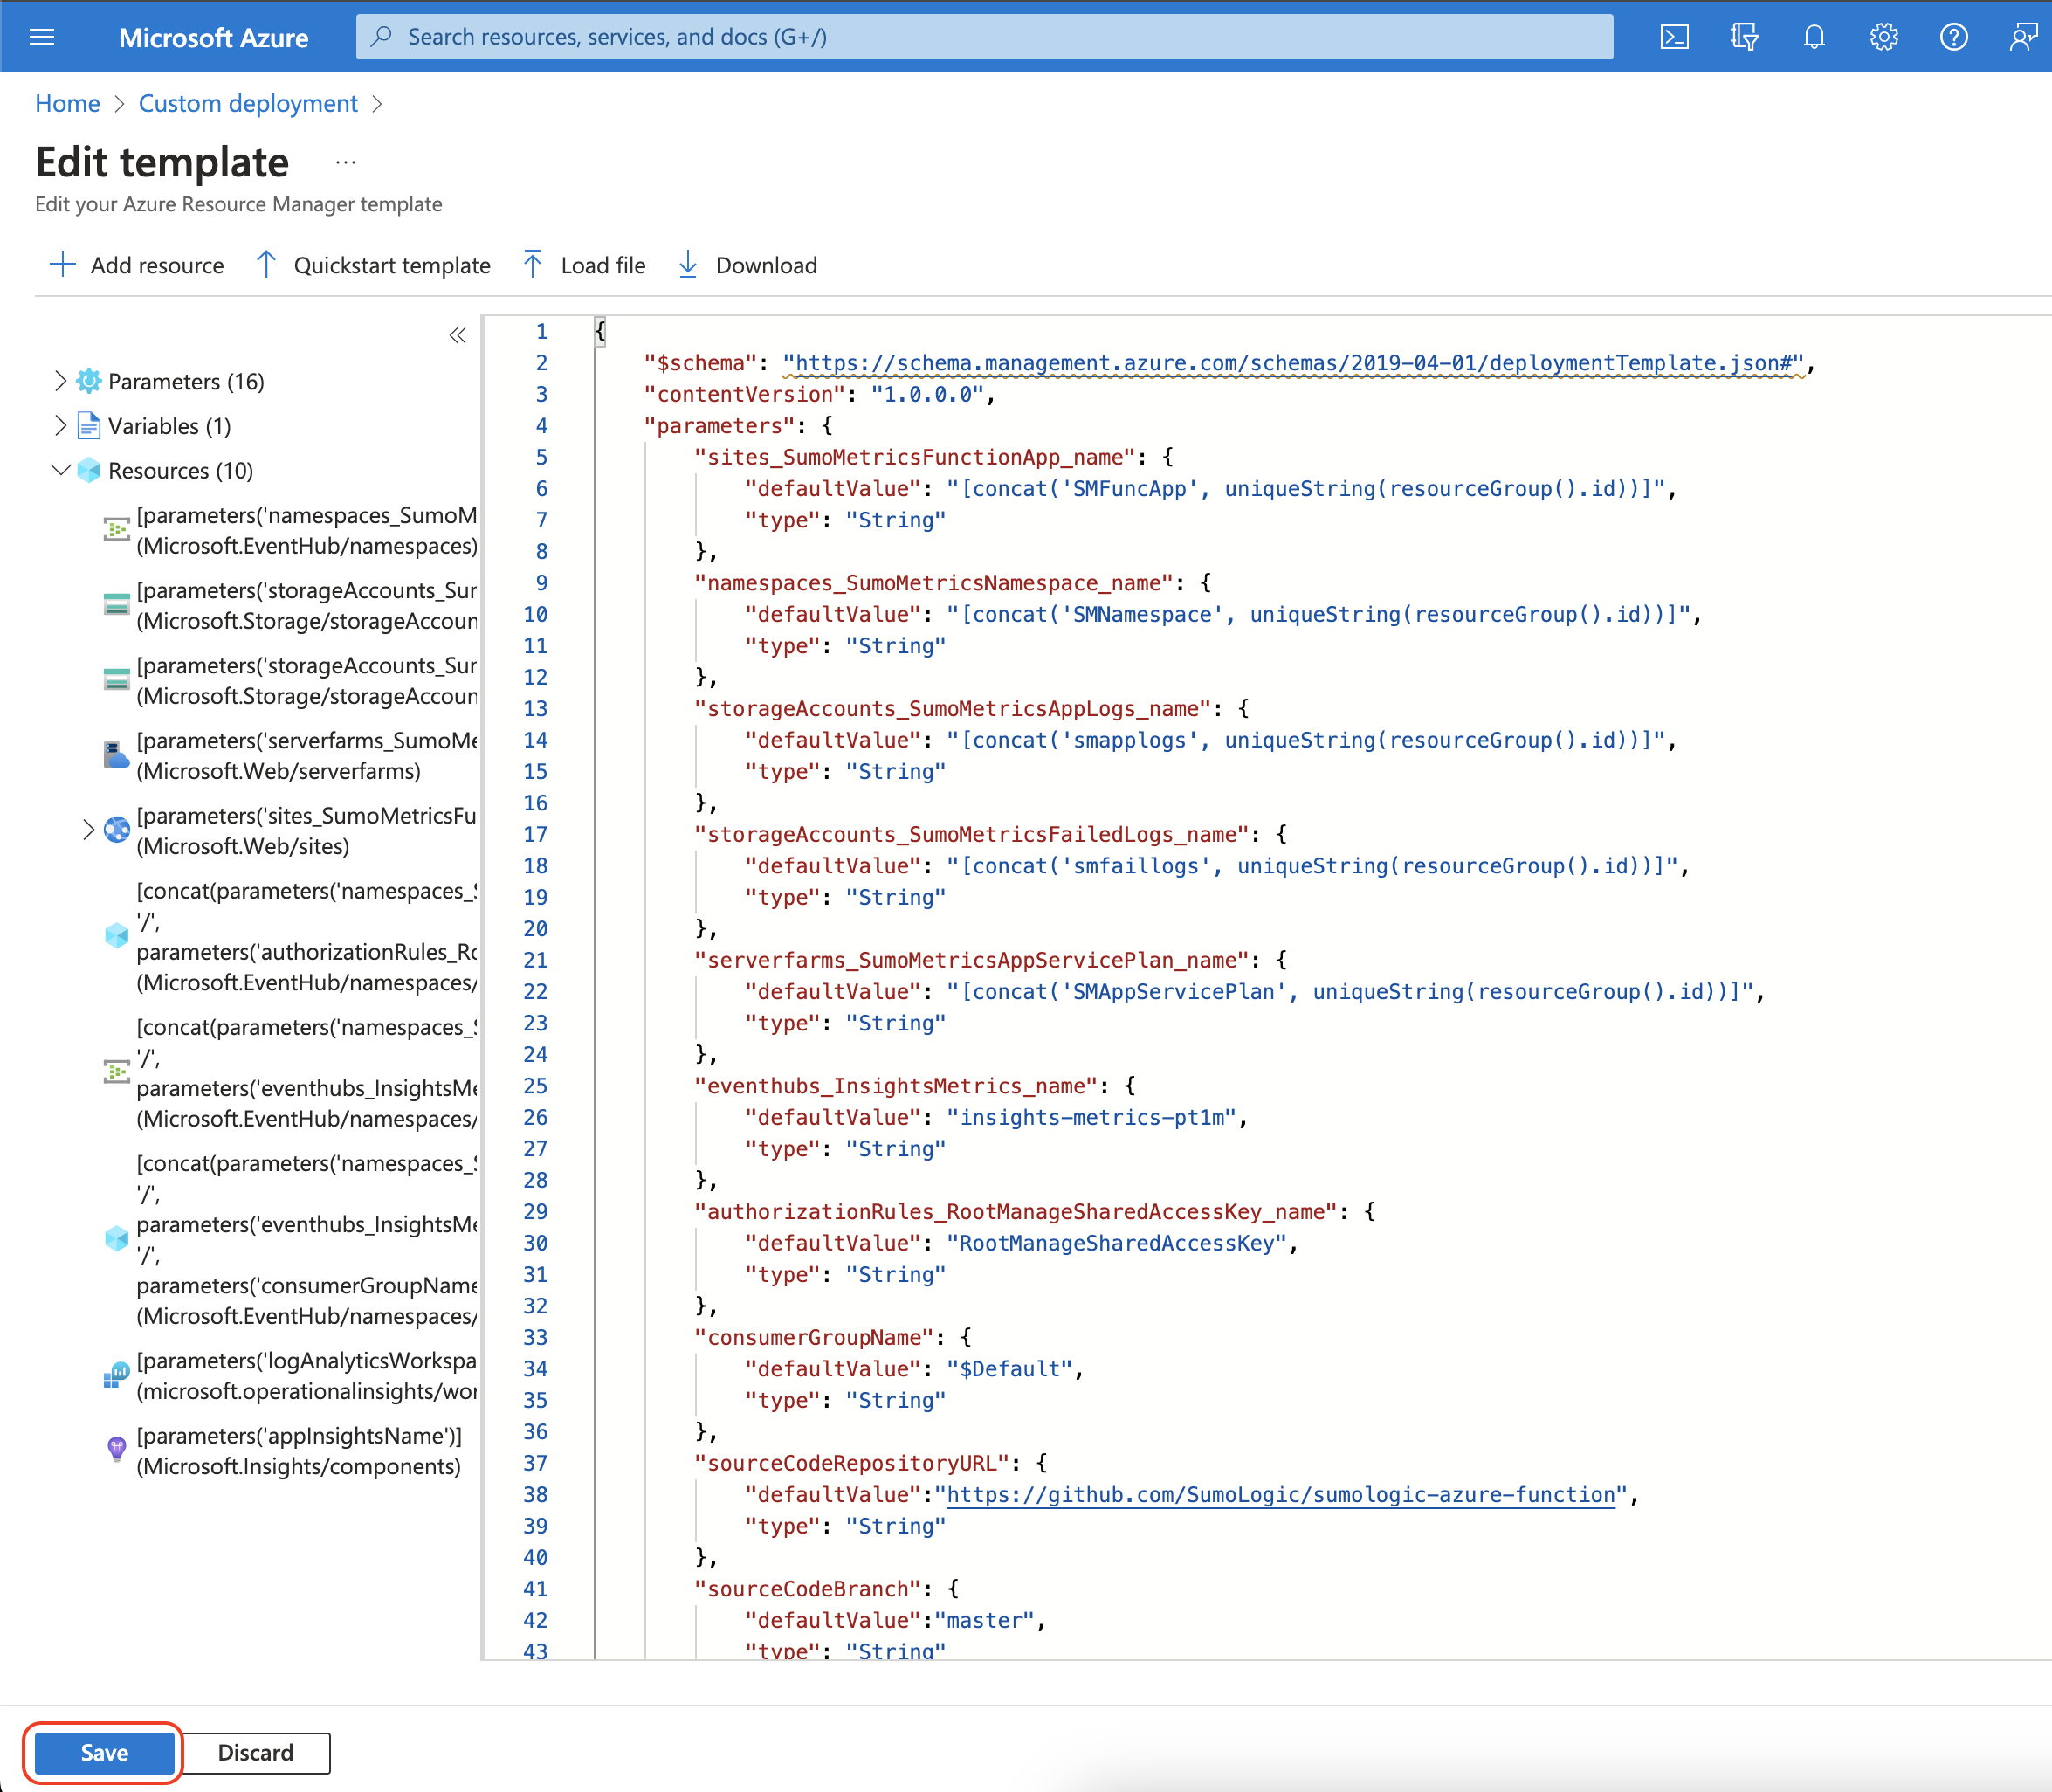
- On the Edit template page, select Load file and upload the json file downloaded in the previous step. Click Save.
- Now you are back on the Custom deployment blade.
- Create a new Resource Group (recommended) or select an existing one.
- Choose Region. The event hub namespace needs to be in the same region as the resource being monitored if the resource is regional.
- For the Sumo Endpoint URL supply the URL for HTTP source you defined in Step 1.
- Click Review + Create.
- After clicking on create button, you will land to the Deployment page, you should see the Your deployment is complete message after deployment is finished:
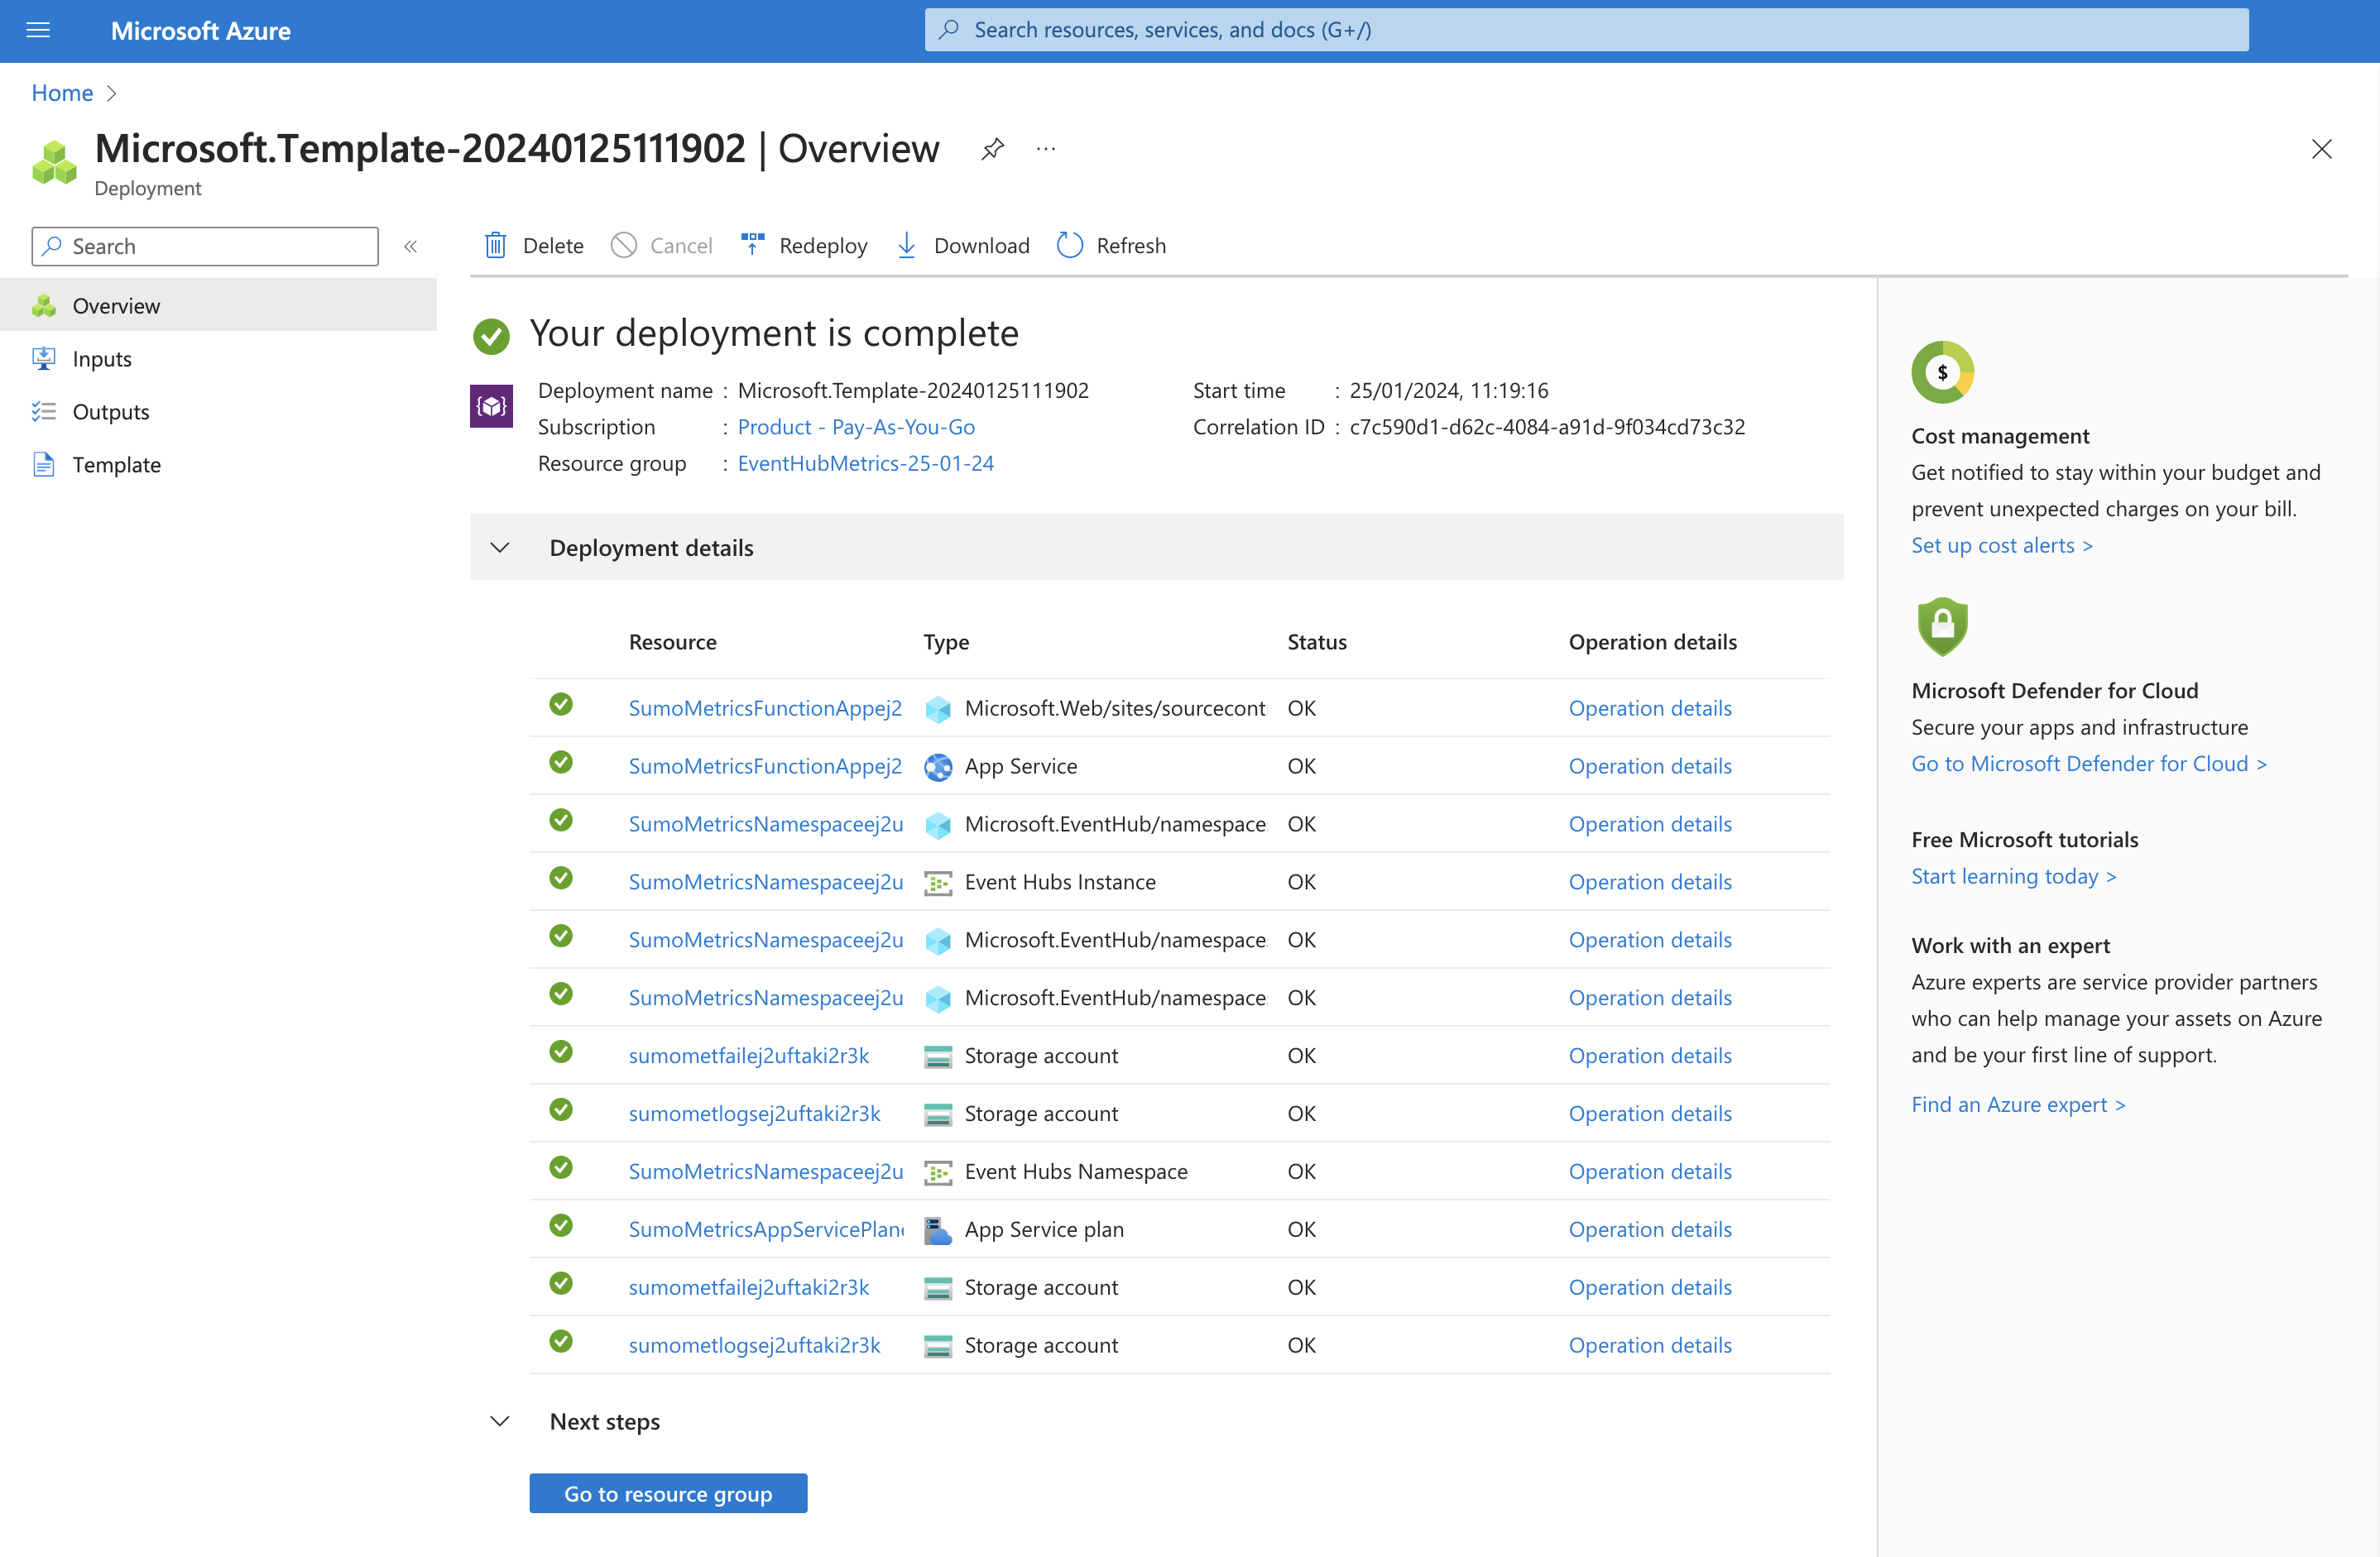
- Creating container for failover logs
- Click on Go to resource group button in the Deployment page.
- In the Resource Group window, search for
smfaillogsin Resources Tab. Click onsmfaillogs<random-string>storage account.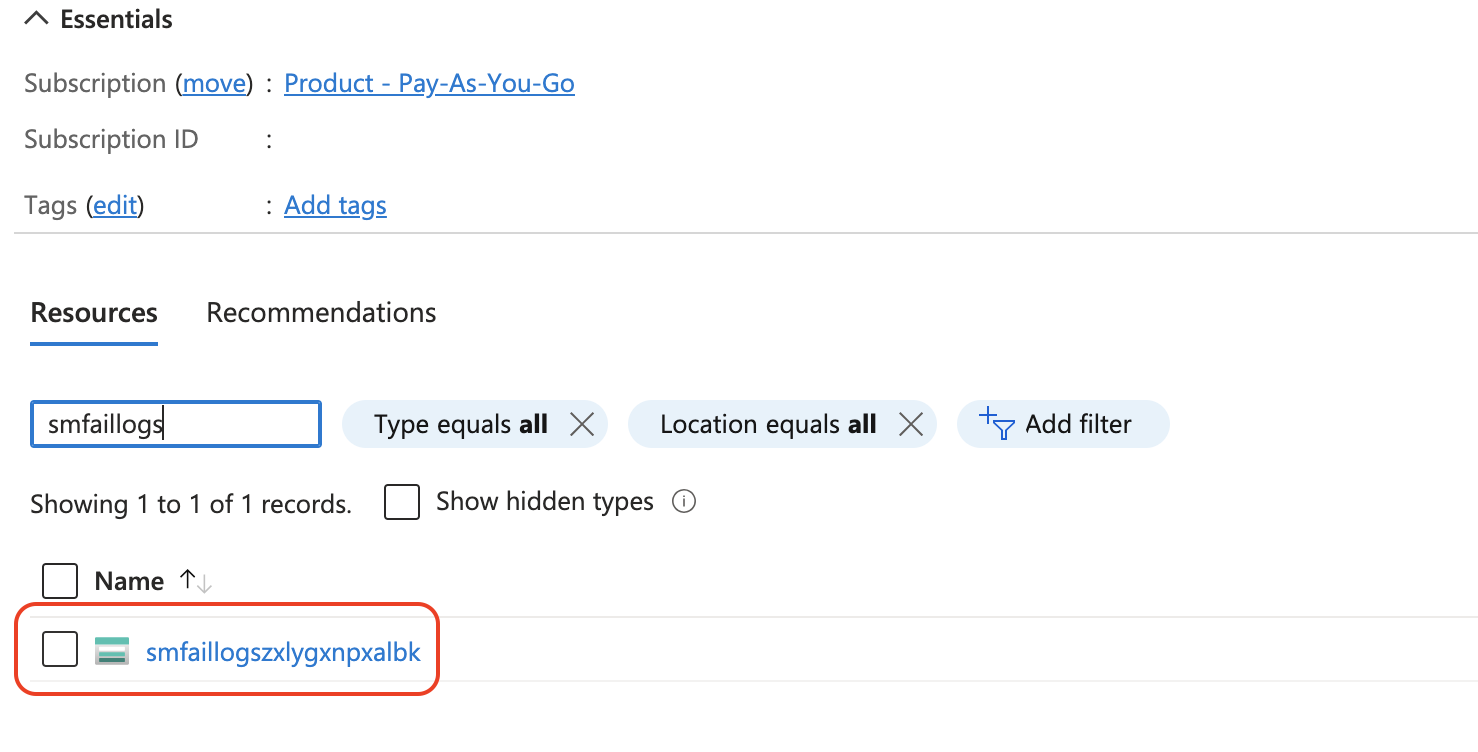
- Under Data Storage, click Containers, then click + Container, enter the Name
smfaillogs. Click Create.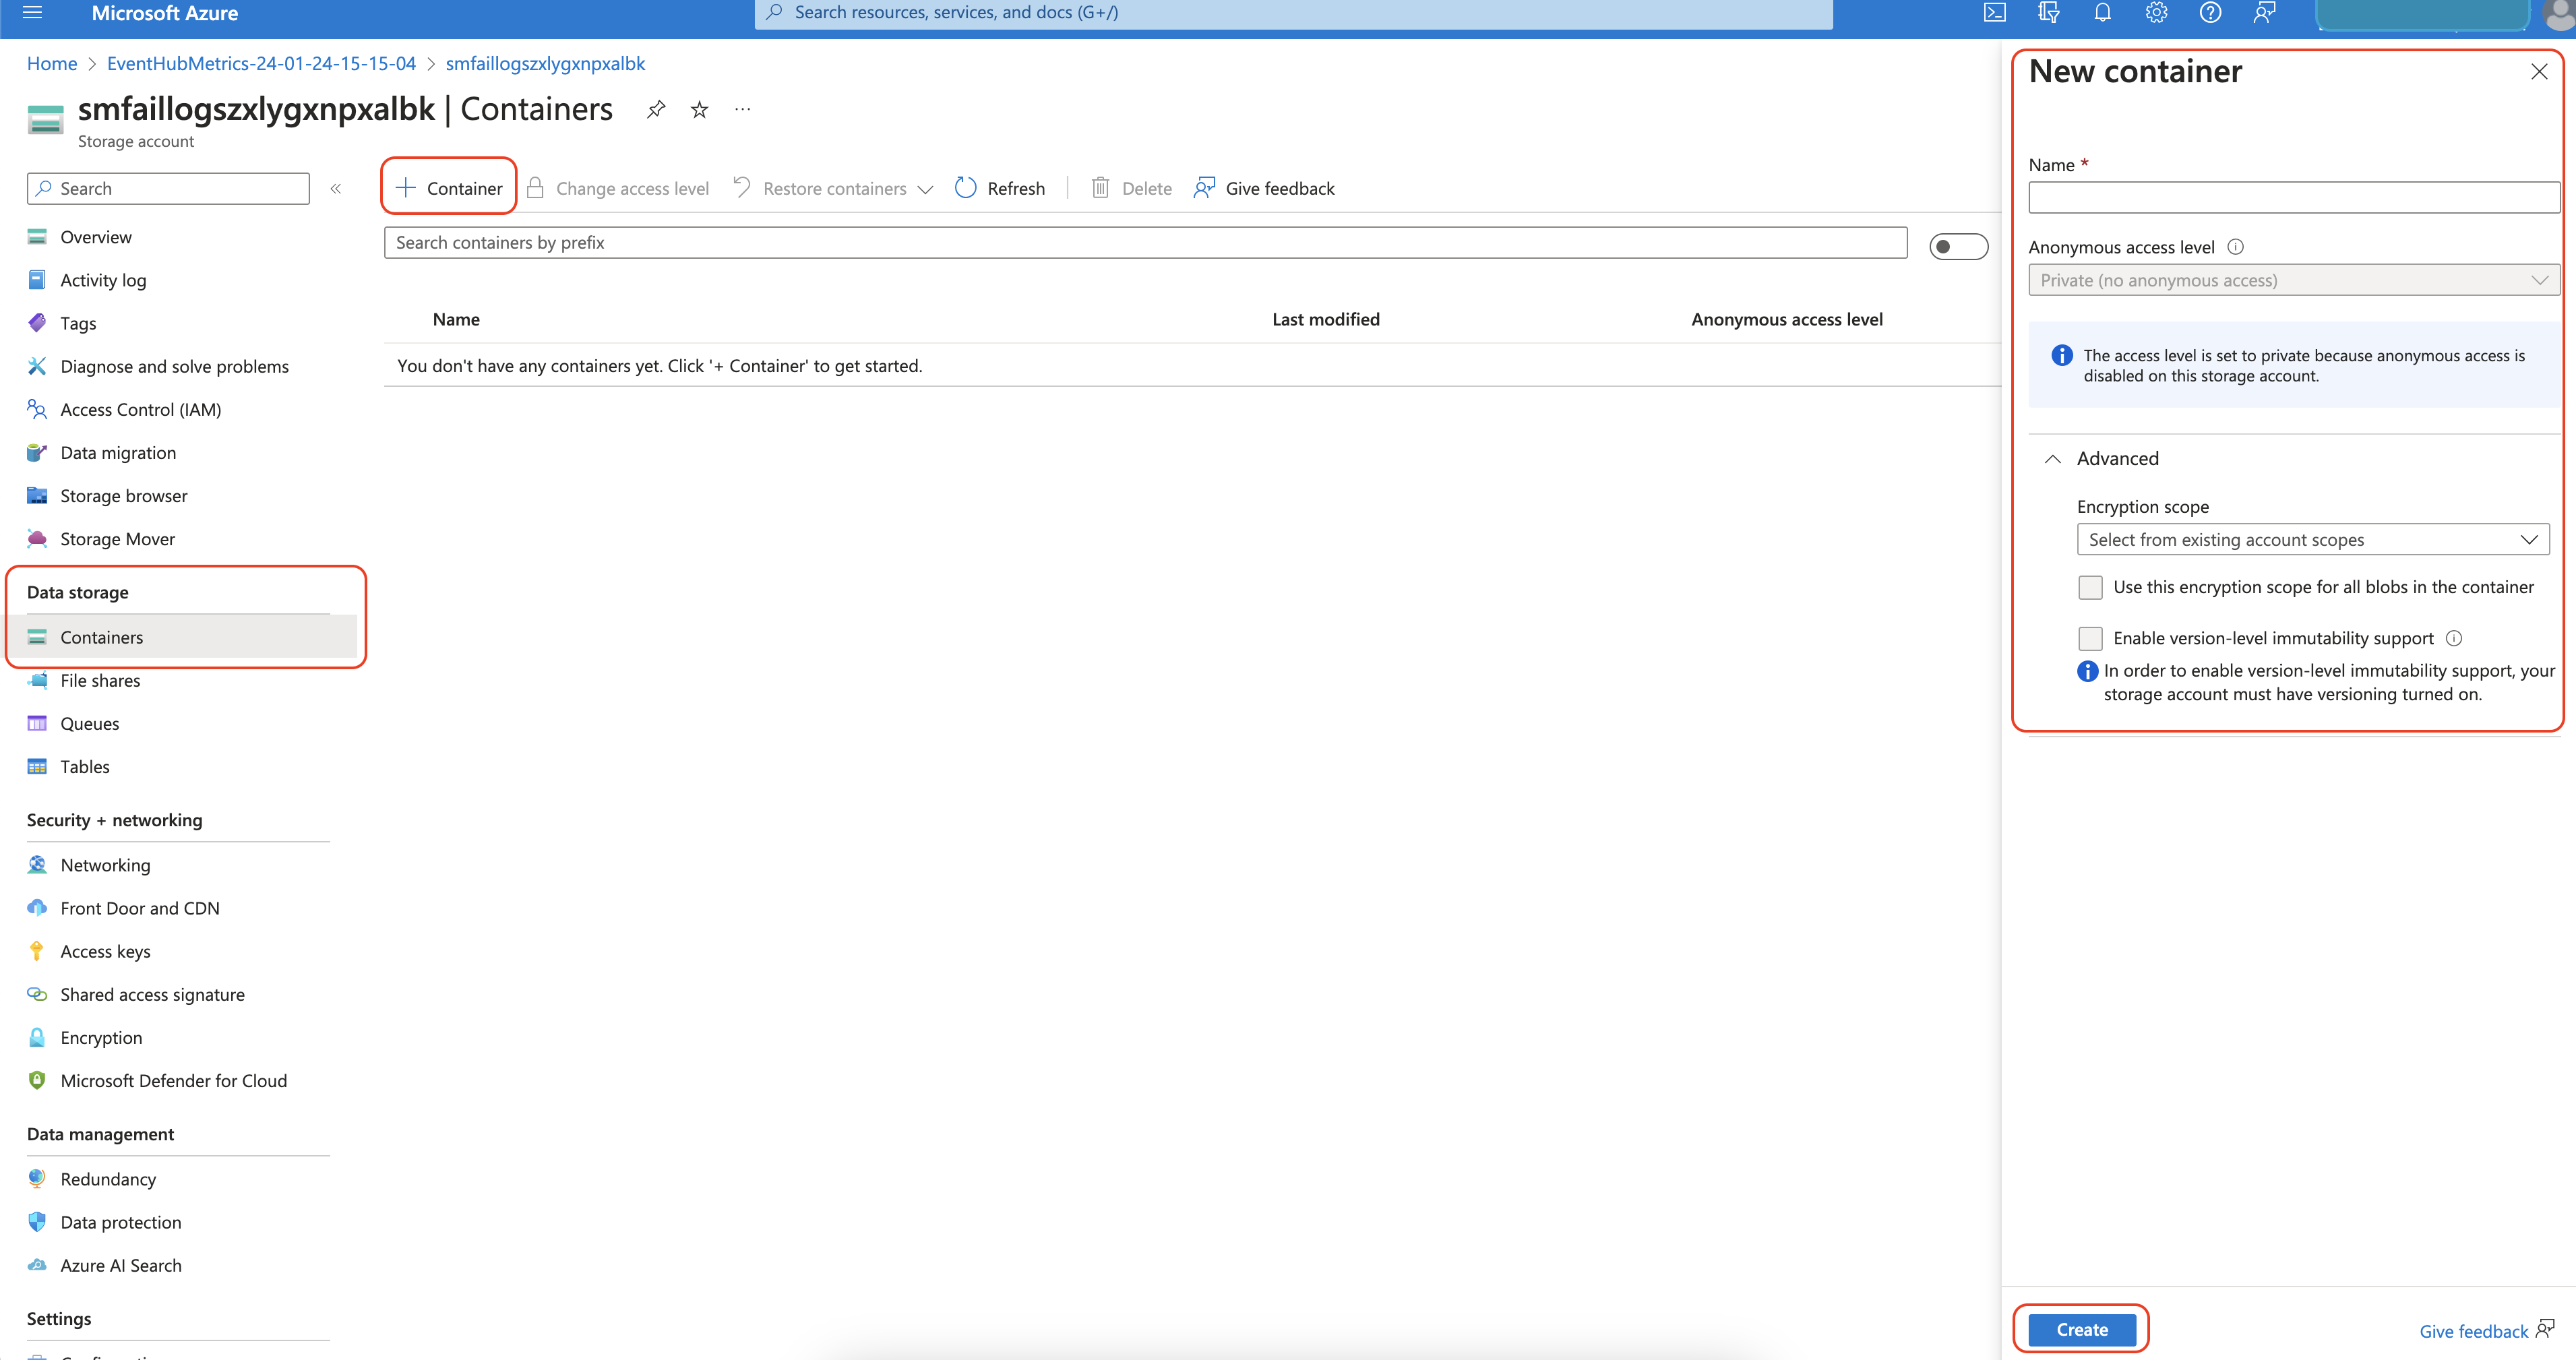
Step 3. Export metrics for a particular resource to Event Hub
Follow these steps to export metrics for a resource to Event Hub.
- Go to the resource whose metrics you want to collect. In below example we are collecting
SQL databasemetrics. - From the left pane, select Diagnostic settings under Monitoring.
- Click Add diagnostic setting.
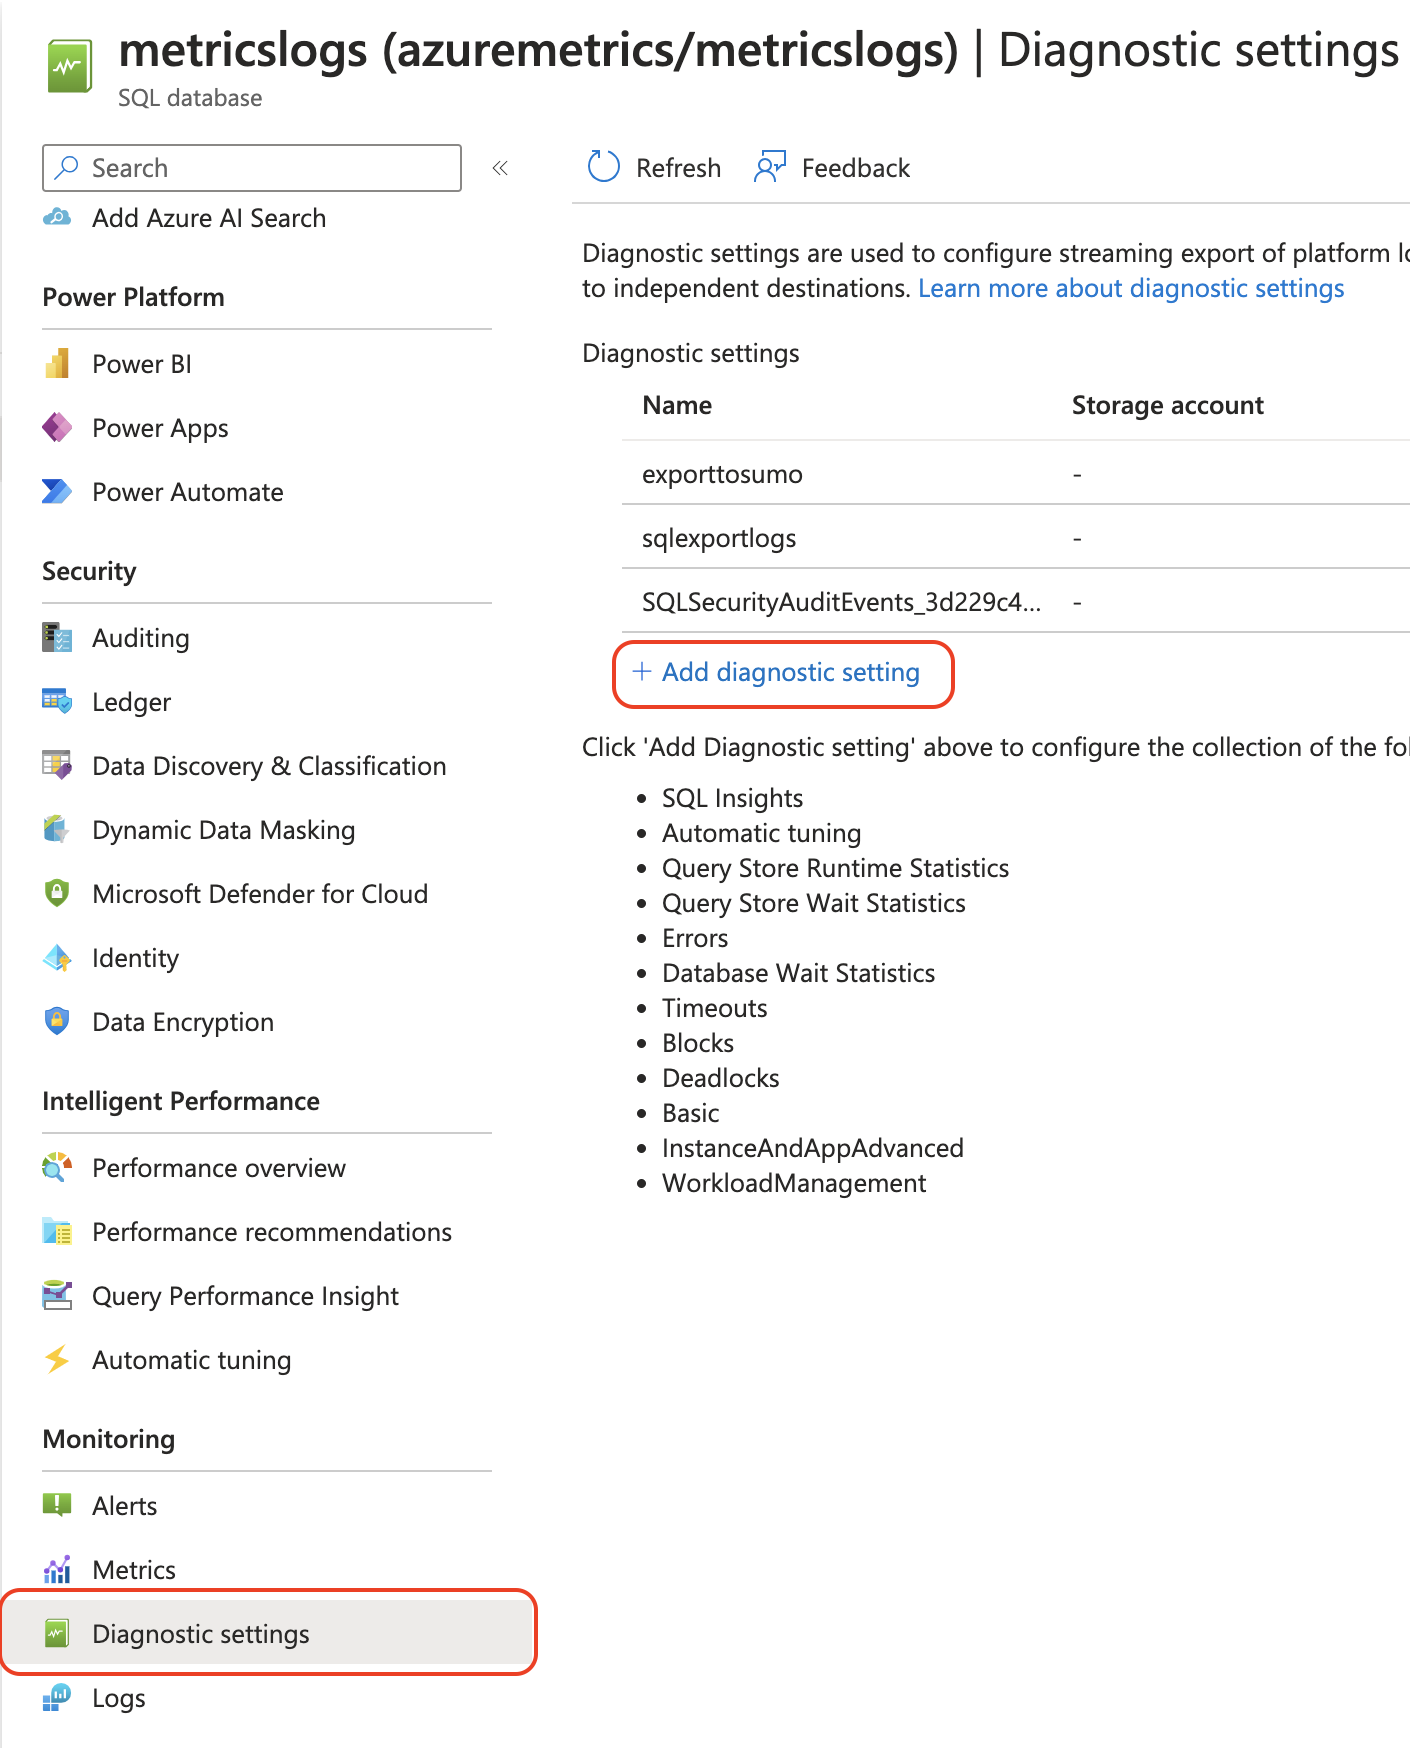
- The Diagnostic settings page appears.
- Diagnostic setting name: Enter a name for the diagnostic setting.
- In the left panel under Metrics section:
- Choose the metrics you want to collect or you can choose
AllMetrics(if available) which enables collection for all the metrics. Do not select anything underLogssince logs and metrics needs to be exported in separate event hubs.
- Choose the metrics you want to collect or you can choose
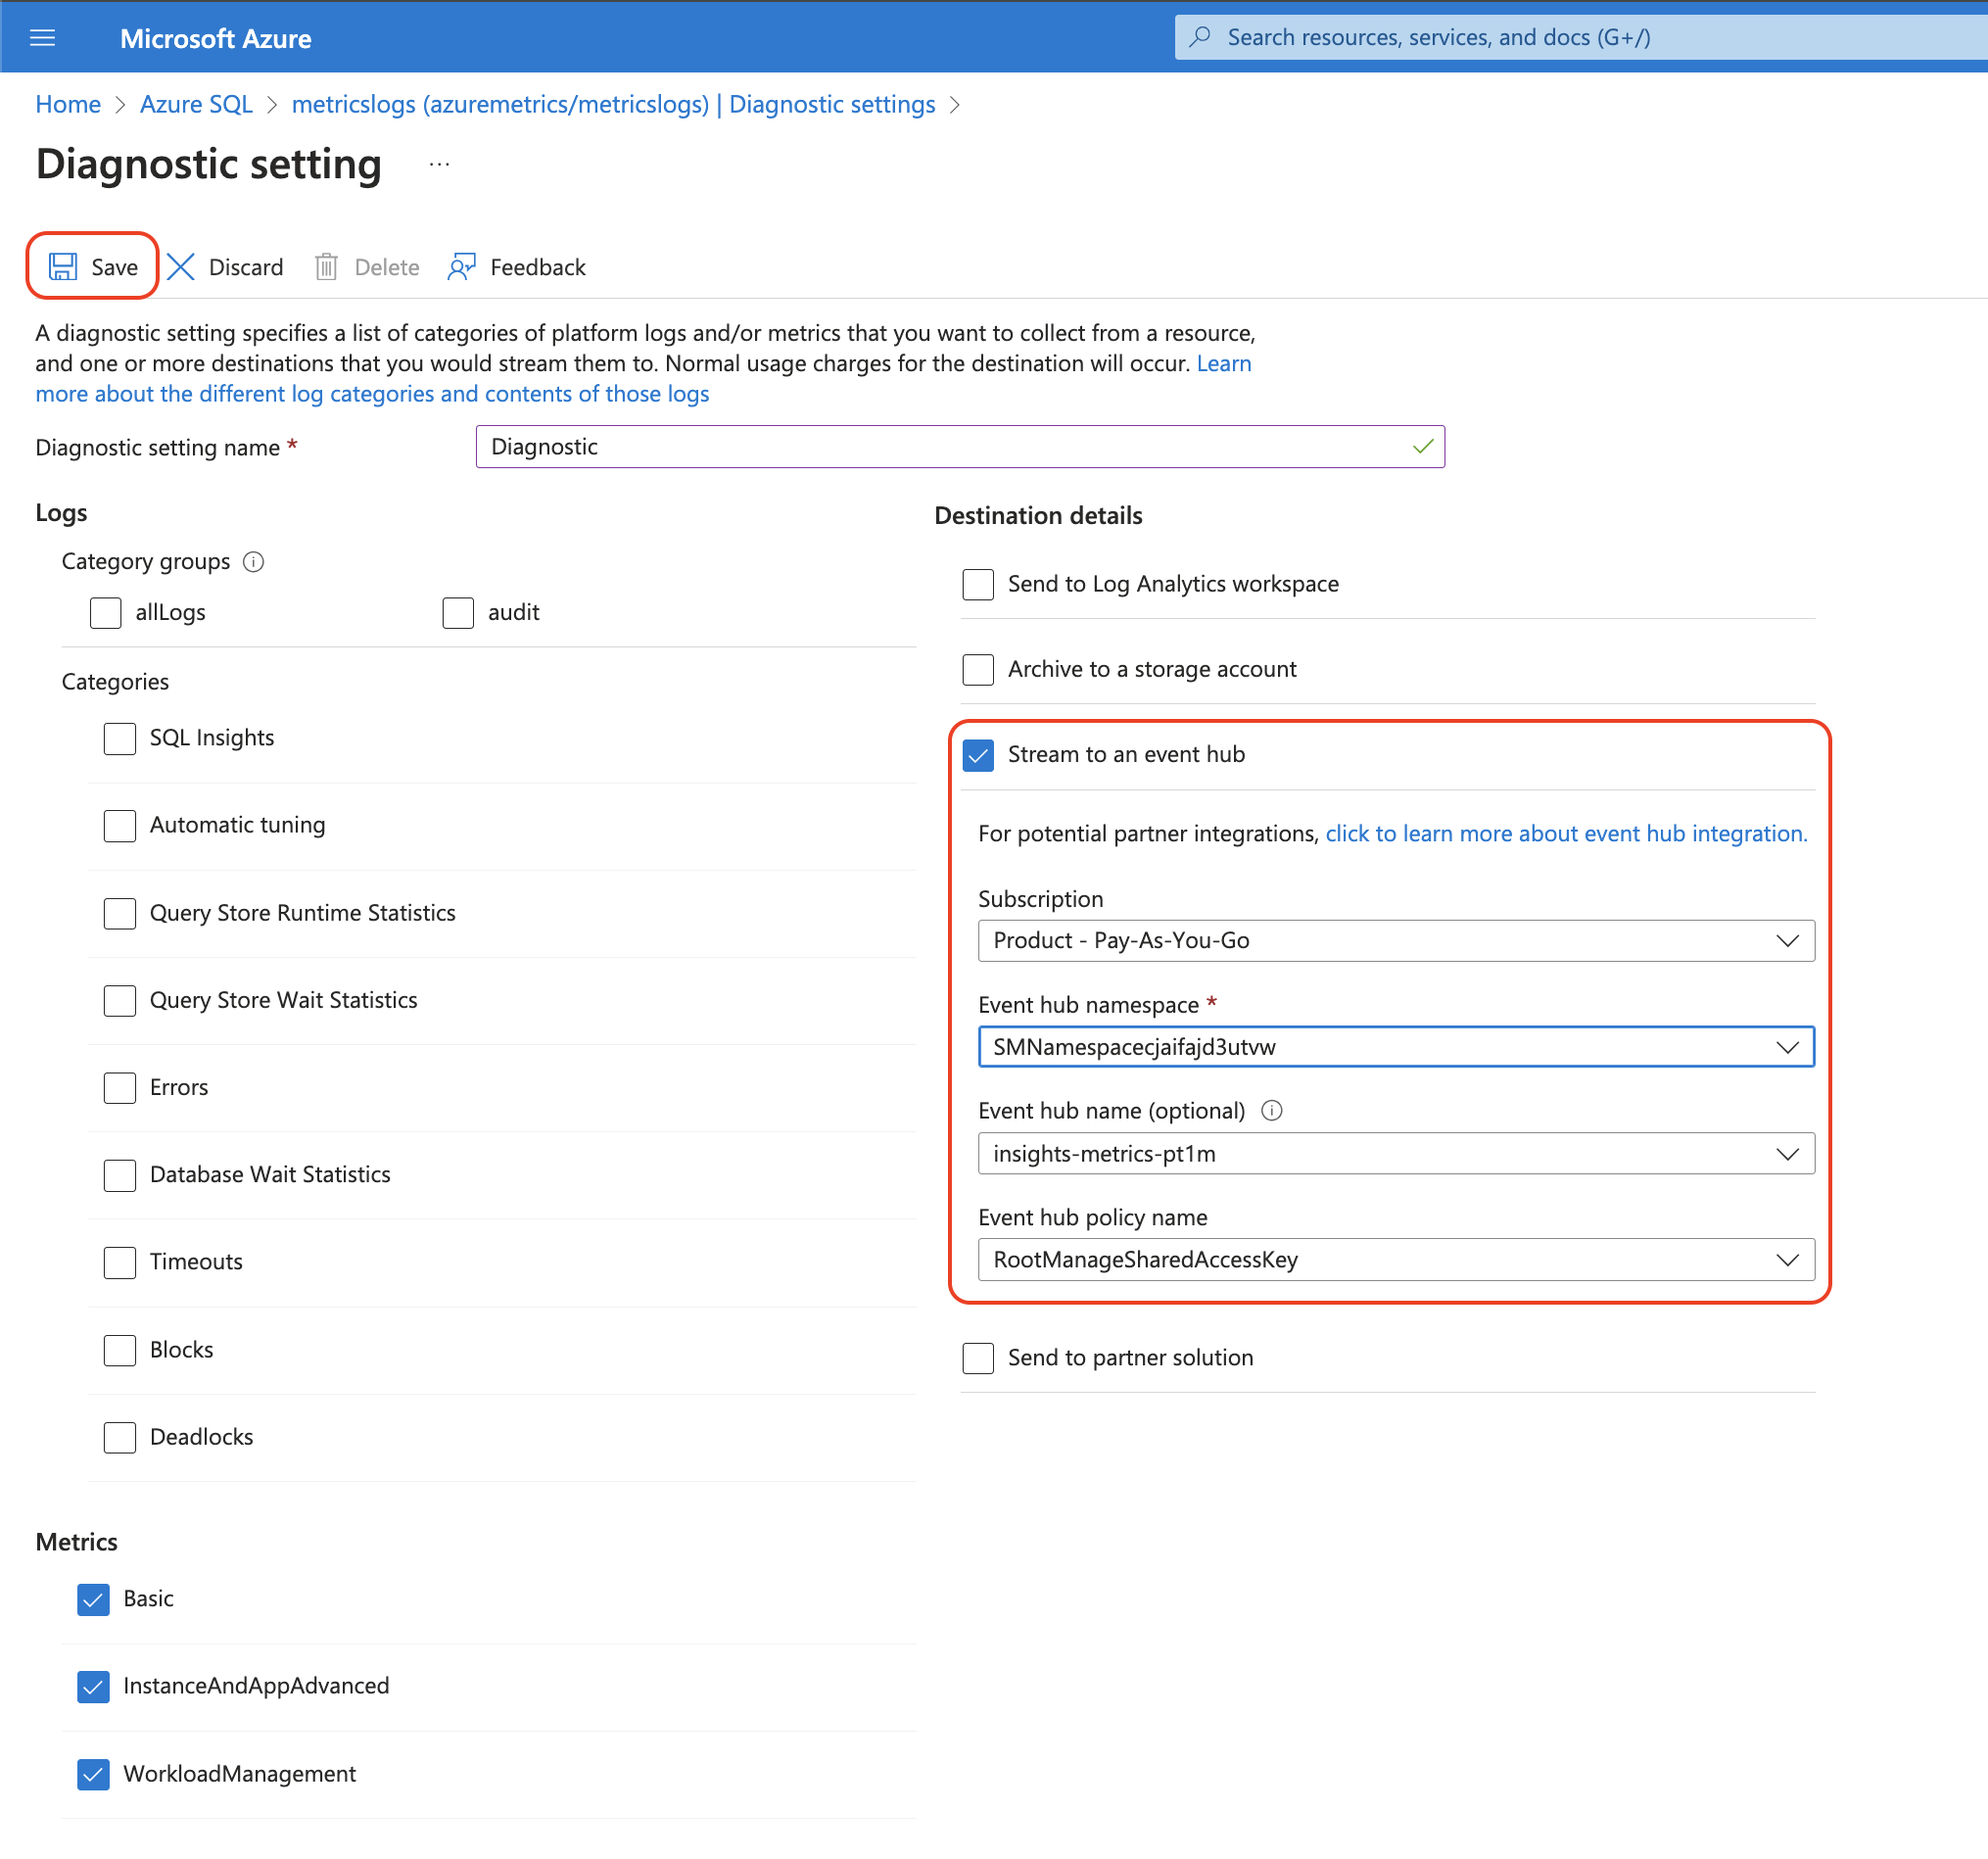
- In the right panel under Destination details section:
- Click the Stream to an event hub checkbox.
- Choose a Subscription.
- Select
SMNamespace<UniqueSuffix>as the Event hub namespace. - Select insights-metrics-pt1m as the event hub name.
- Select an event hub policy name. You can use the default policy RootManageSharedAccessKey.
- Save the Diagnostic settings.
Troubleshooting metrics collection
If metrics are not flowing into Sumo Logic, follow the steps below to investigate the problem.
Verify Configurations
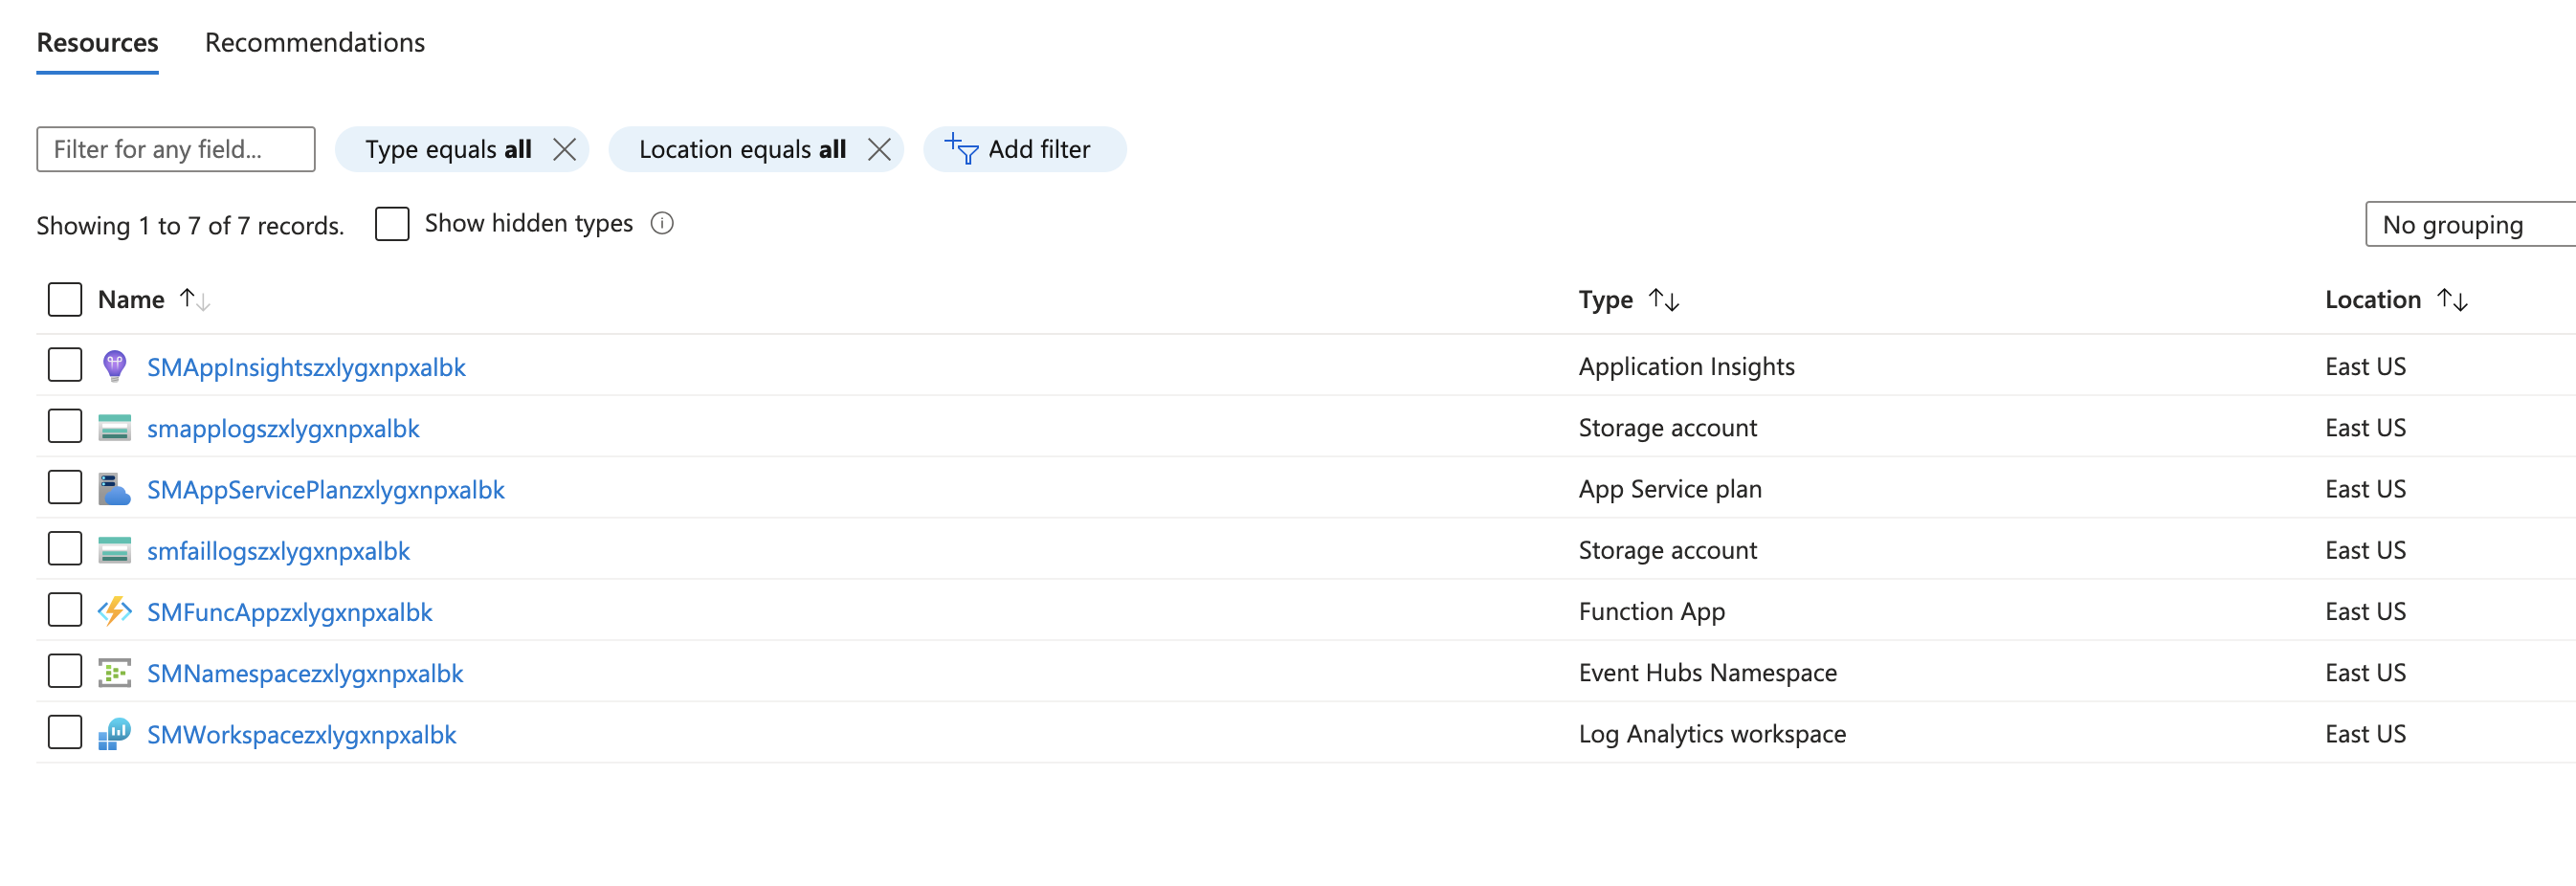
First, make sure that the resources you created above were successfully created.
Go to Resource groups, and select the resource group you created or selected in Step 2. Configure Azure resources using ARM Template. You should see the seven resources you created: an App Service plan, an App Service, an Event Hubs Namespace, Application Insights, Log Analytics workspace and two Storage accounts.
Verify Event Hub is receiving metrics
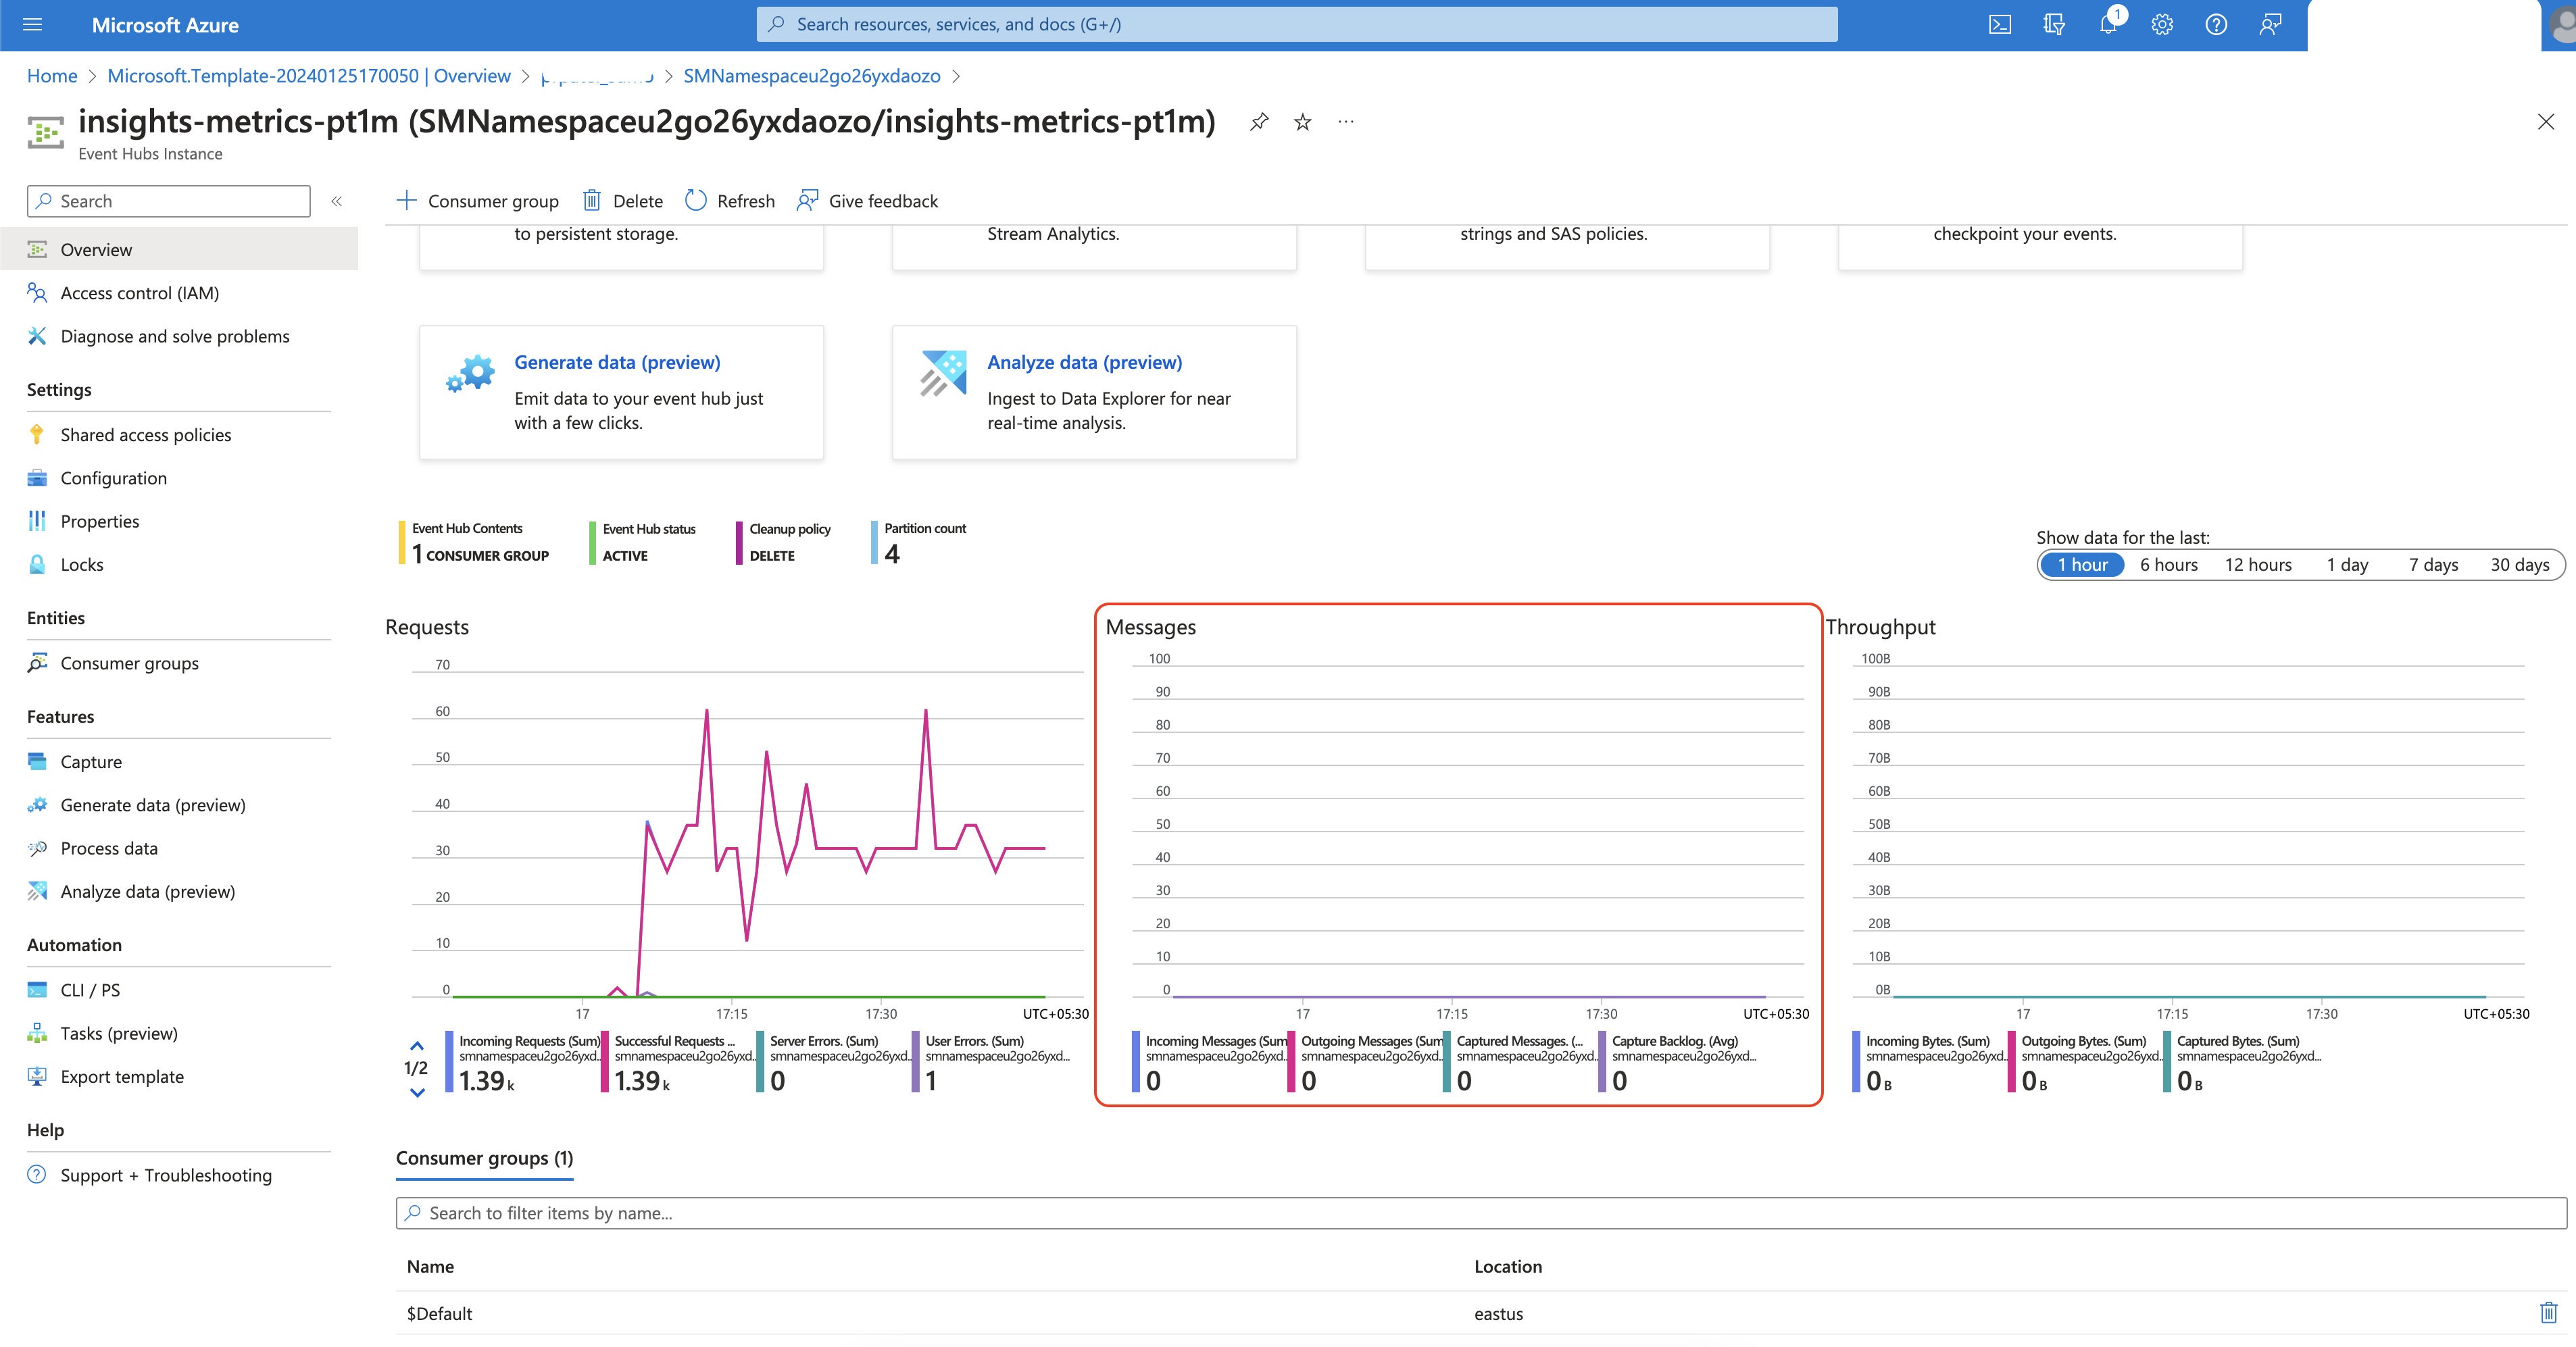
To verify that events are appearing in your event hub:
- Navigate to the event hub namespace present in your resource group you created or selected in Step 2. Configure Azure resources using ARM Template in the Azure Portal. And then go to the event hub.
- Scroll down and view the
Messageschart - Check that the Incoming Messages count is greater than zero and the Outgoing Messages count is greater than zero. If there are no Incoming Messages then check the Diagnostic Settings are configured correctly or not. If there are no Outgoing Messages then verify the trigger configuration in Function App. If both are present then verify the sumo logic HTTP source URL.
Verify the Event hub trigger configuration
- Go to Resource groups, and select the resource group you created or selected in Step 2. Configure Azure resources using ARM Template. Search for
SMFuncApp. You should find theSMFuncApp<random-string>Function App. Click it. - Under the Functions tab, click EventHubs_Metrics.
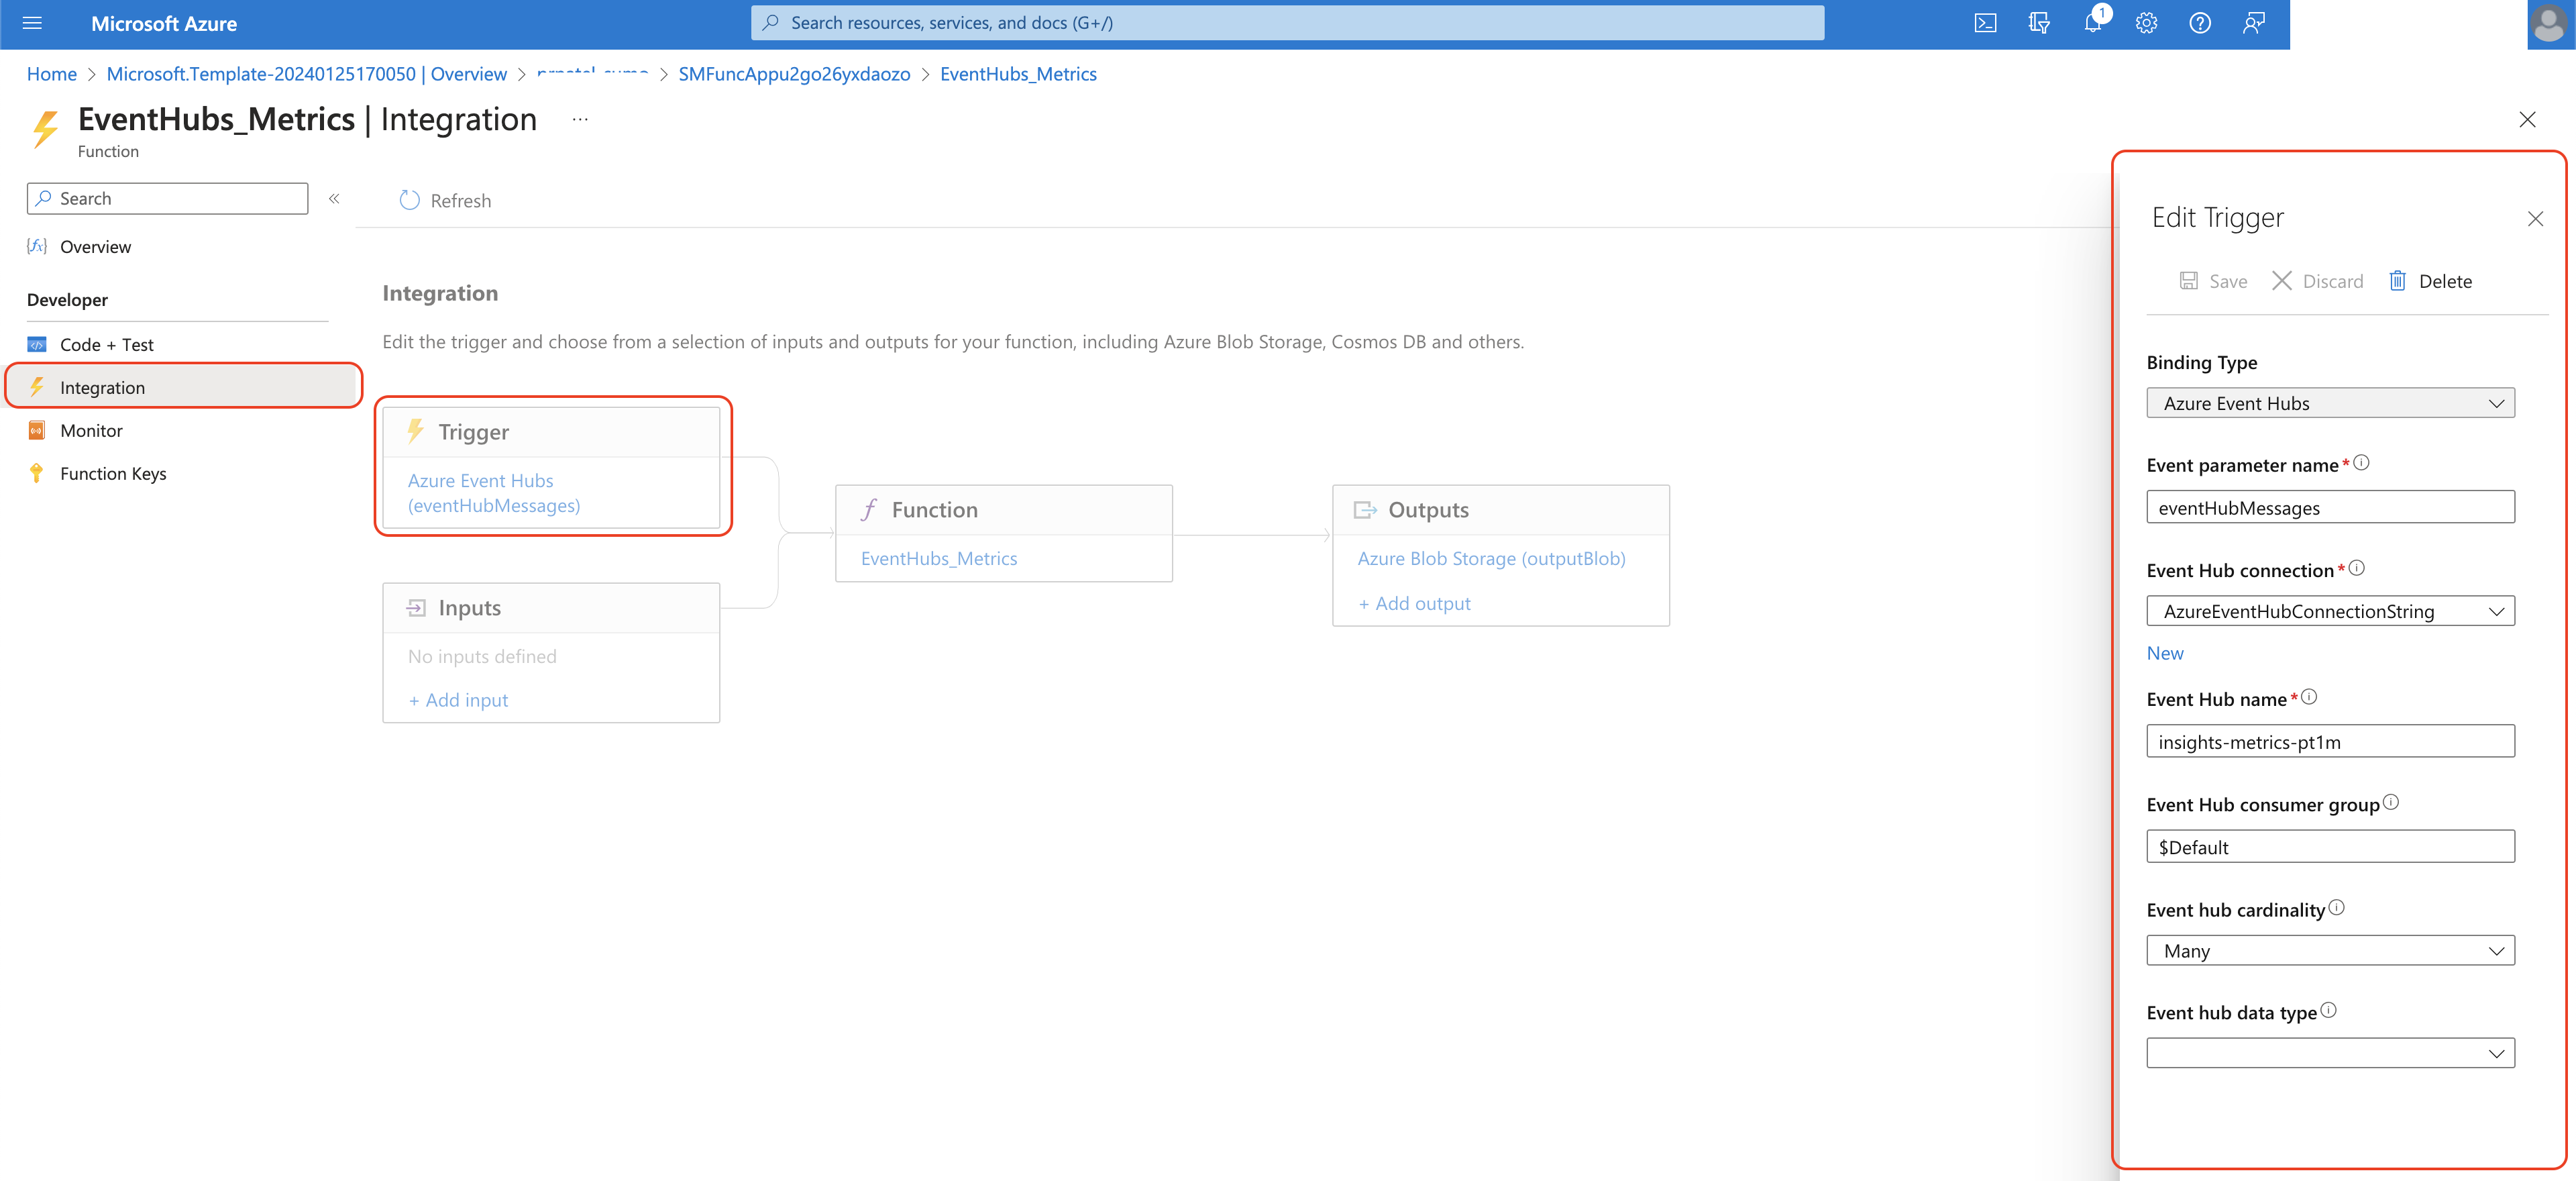
- Under the Developer section, click Integration. Click on
Azure Event Hubsunder the Triggers section and verify the event hub configuration, this should be same as the one where you are exporting the logs.
Verify Sumo Logic HTTP source URL.
- Go to Resource groups, and select the resource group you created or selected in Step 2. Configure Azure resources using ARM Template. Search for
SMFuncApp. You should find theSMFuncApp<random-string>Function App. Click it. - Click on Configuration under Settings in the left panel. Click on
SumoLabsMetricEndpoint. Check that the value of the SumoLabsMetricEndpoint field matches the HTTP source URL.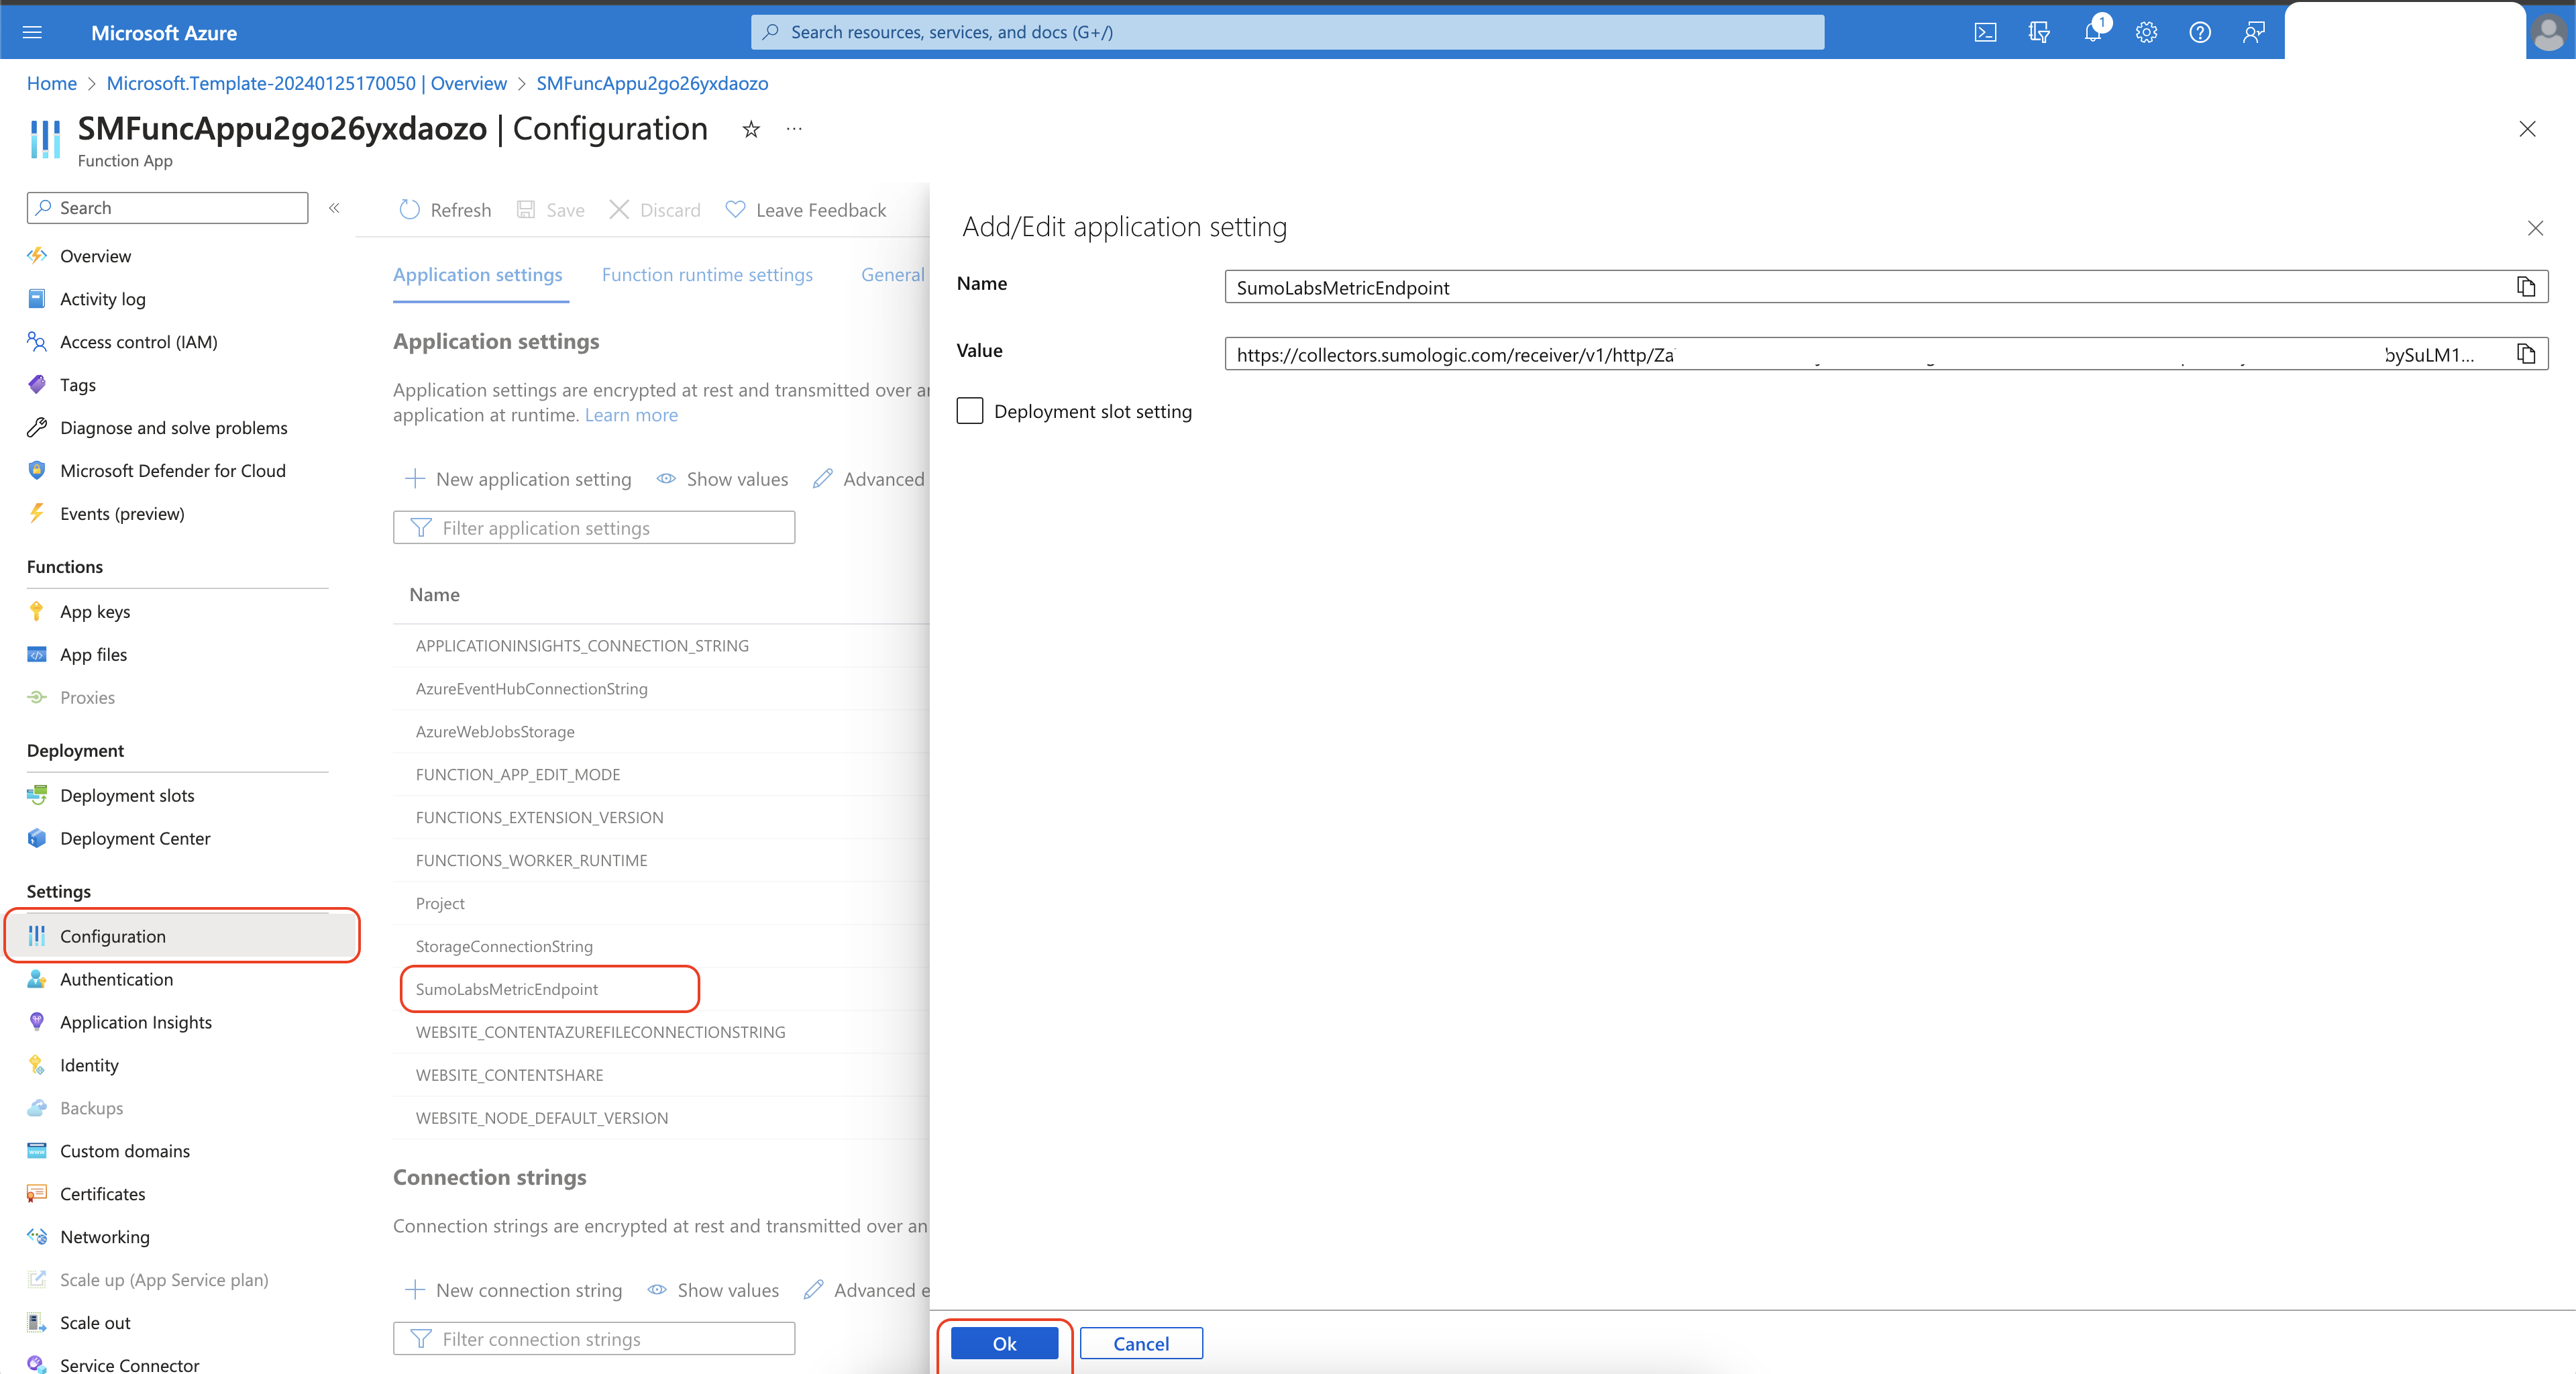
Verify Failure logs in Application Insights
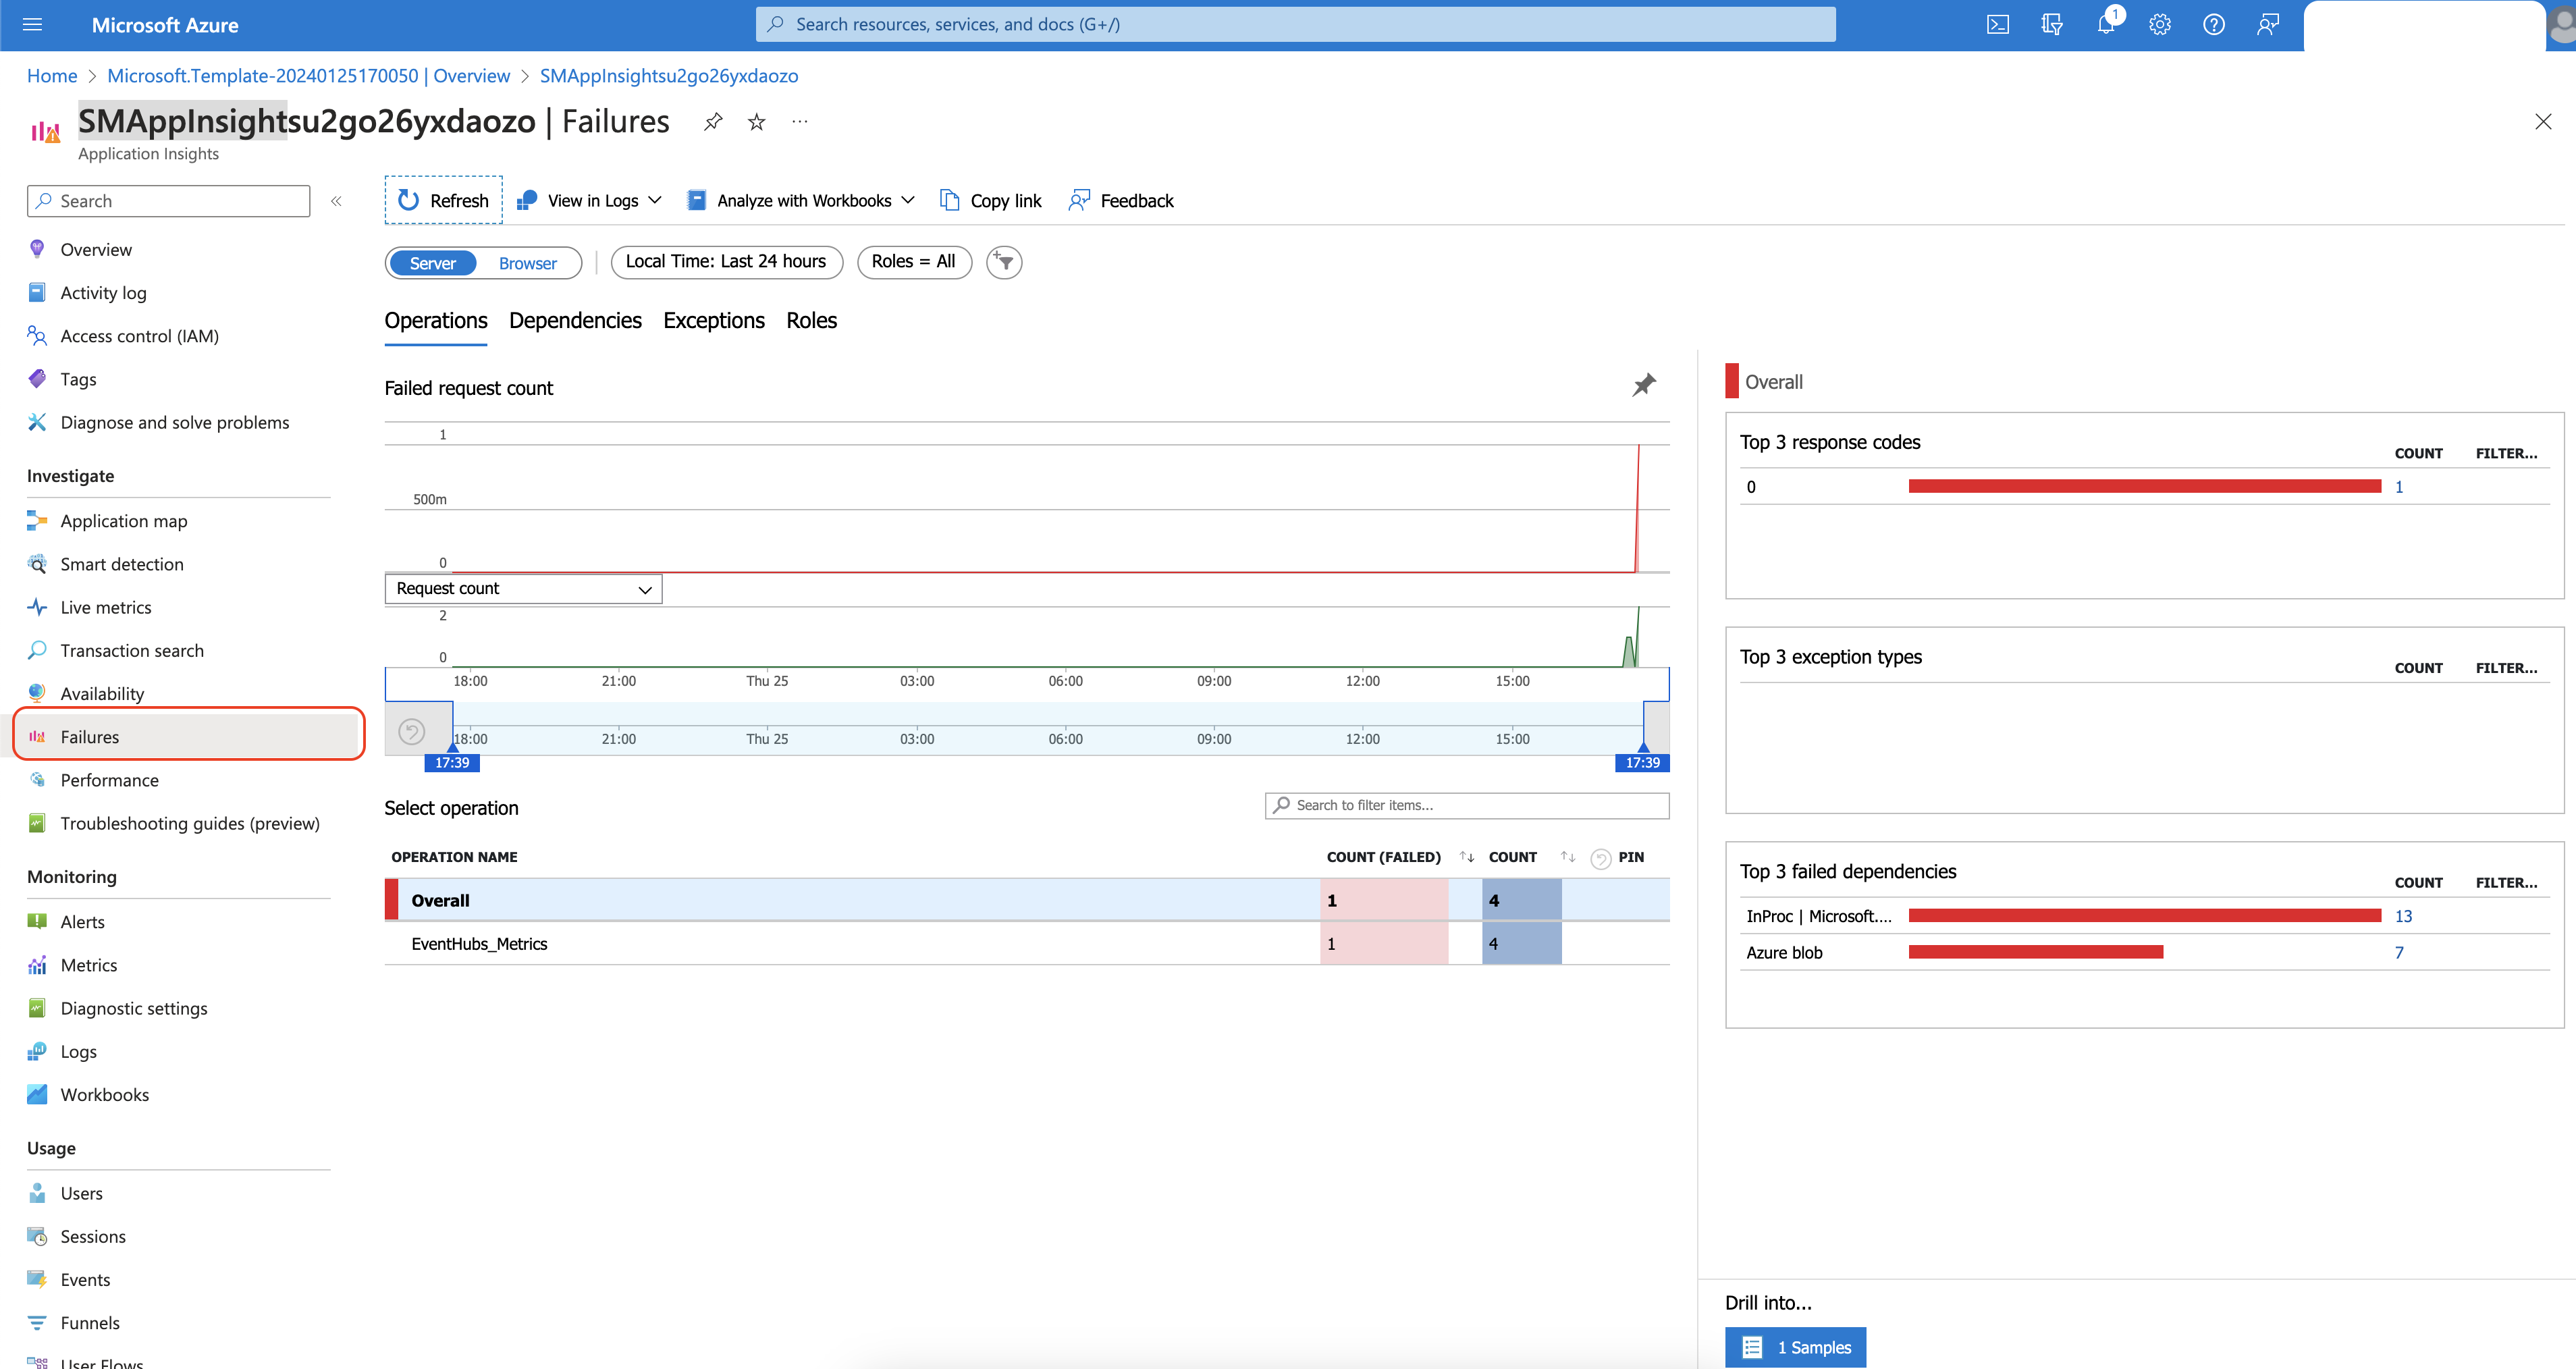
- Go to Resource groups, and select the resource group you created or selected in Step 2. Configure Azure resources using ARM Template. Search for
SMAppInsights. You should find theSMAppInsights<random-string>Application Insights. Click it. - In the left panel under Investigate click on Failures. Click on Count column on the rightmost panel, it will take you to the trace, select any trace and see the exception message.
Common errors
For common error messages, refer Event Hub export error messages section.