Telegraf Collection Architecture
This topic describes how to configure Telegraf plugins to fetch metrics from your applications and send them to Sumo Logic.
Telegraf is an open source, plugin-based collector/agent that uses built-in input plugins to fetch metrics from the managed application, service, or third-party API where Telegraf is running, and then uses output plugins to send those collected metrics to another system, such as Sumo Logic. The Sumo Logic output plugin sends the metrics collected by the input plugin to an HTTP Source running on a Sumo Logic Hosted Collector.
Telegraf is a popular choice for monitoring pipelines because it supports collection from a large number of applications and services. Input and output plugins are application-specific; for example, there are input plugins for Redis, Nginx, JMX, and more, and output plugins for services like Kafka, Prometheus, and of course Sumo Logic. You can see lists of Telegraf’s built-in input plugins here.
Collection architecture varies depending on whether you’re monitoring resources in a Kubernetes or a non-Kubernetes environment.
Telegraf in a non-Kubernetes deployment
The diagram below illustrates where Telegraf fits into a non-Kubernetes environment monitored by Sumo Logic. In this example, we’re running Redis on an Amazon EC2 host.
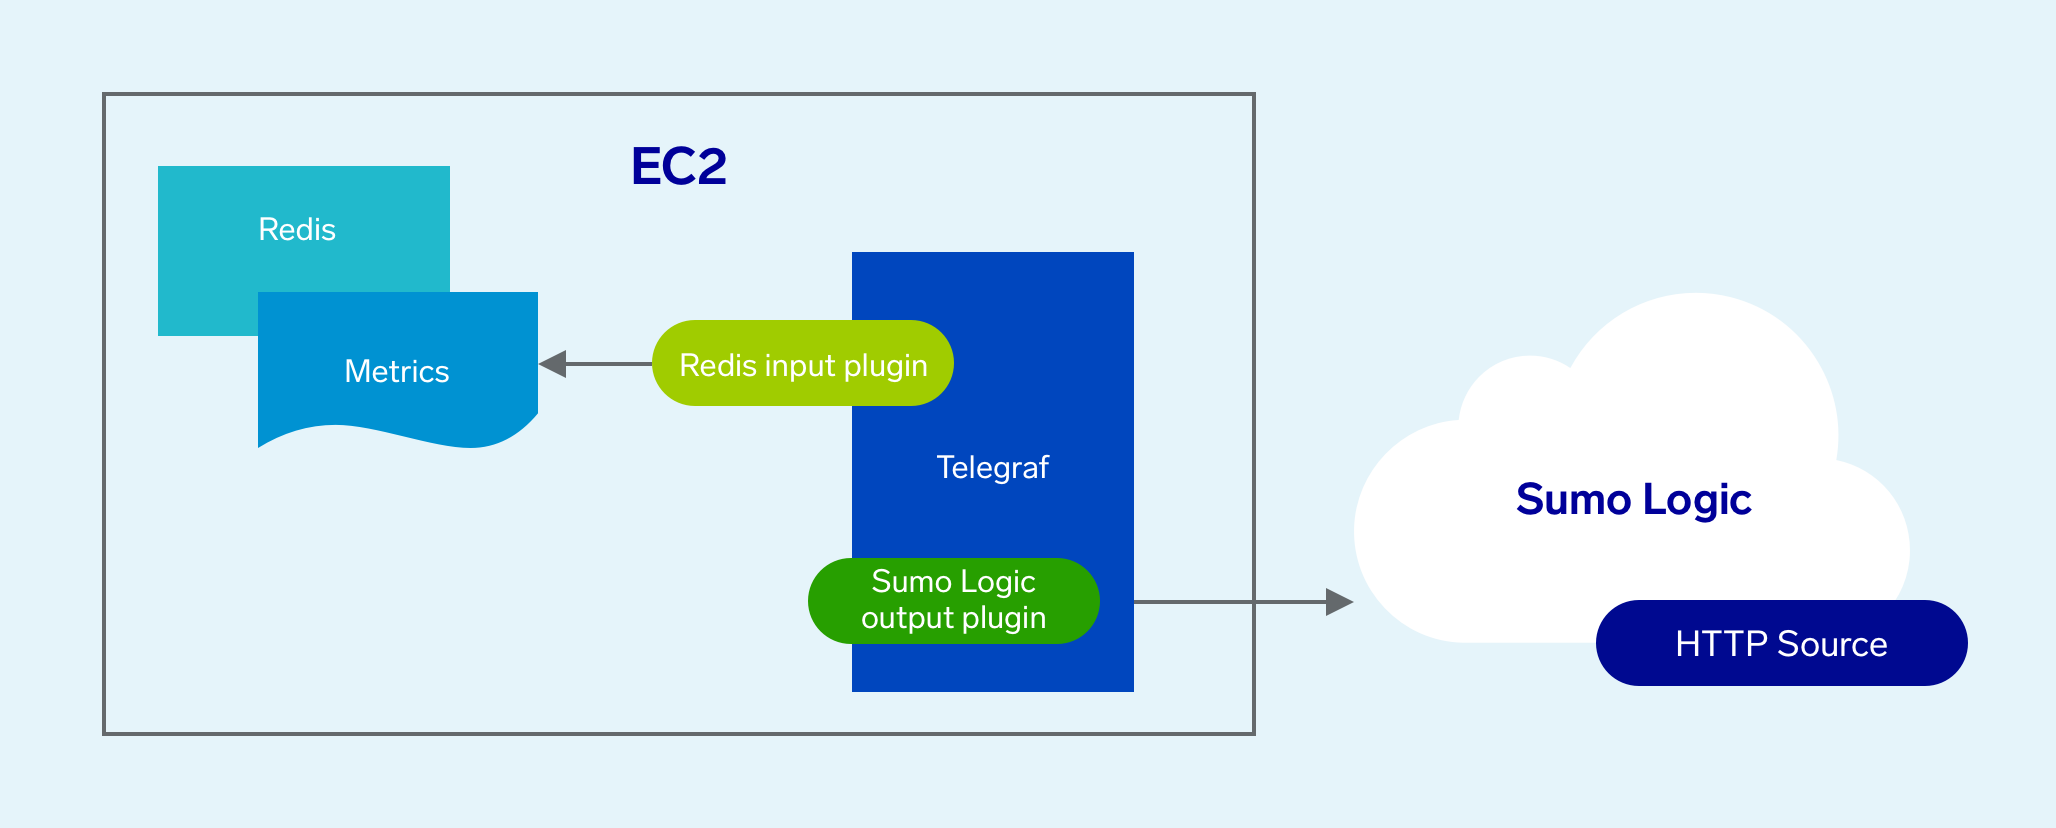
Metrics collection pipeline
The metrics collection pipeline for using Telegraf in a non-Kubernetes environment is simple: it’s all Telegraf. Telegraf runs on the same system as the monitored application, and uses application-specific input and output plugins to collect metrics and send them to Sumo Logic. In our example above, Telegraf uses the Redis input plugin to obtain Redis metrics, and the Sumo Logic output plugin to send the metrics to Sumo Logic.
Configuration process
- In non-Kubernetes environments, you'll need to install Telegraf on the system that hosts the application you want to monitor. For instructions, see Install Telegraf.
- Configure the appropriate application-specific input plugin and the Sumo Logic output plugin in the Telegraf configuration file. For more information, see Configure Telegraf Input Plugins and Configure Telegraf Output Plugin for Sumo Logic.
For applications that do not expose metrics
Some applications may not expose their metrics for another system to access, in which case you'll need to configure the application to expose the metrics so that Telegraf can collect them. Some examples:
- To collect metrics from Nginx, you'd need to configure it to expose metrics in the Nginx configuration file. For more information, see Collecting Logs and Metrics for Nginx.
- To collect JMX metrics from a Java application, you'd need to configure the application to use Jolokia, a JMX-HTTP bridge. For more information, see Collecting Metrics for JMX.
You select an existing HTTP Source on a Hosted Collection as the destination for the Telegraf-collected metrics, or configure a new collector and source, as desired.
Telegraf in a Kubernetes deployment
The diagram below illustrates where Telegraf fits into a Kubernetes environment monitored by Sumo Logic. In this example, we’re monitoring an Nginx in a Kubernetes cluster.
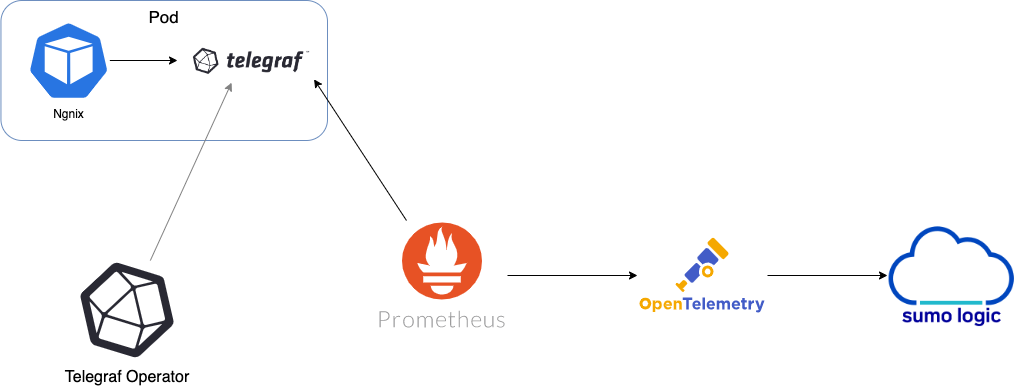
Telegraf Operator intercepts requests related to pods in the cluster, using the mutating webhooks functionality in Kubernetes. Telegraf Operator reads the pod annotations in the request and if an annotation says to add a Telegraf sidecar, then Telegraf Operator adds that instance as an additional container within that pod.
To summarize, here's how to collect metrics using the Telegraf Operator:
- User adds annotations to the pods where they want Telegraf to collect data from.
- Prometheus connects to Telegraf via the user's annotations. Sumo Logic preconfigures Prometheus to fetch the metrics.
- Prometheus then sends metrics to Sumo Logic Distribution for OpenTelemetry Collector.
- The Sumo Logic Distribution for OpenTelemetry Collector processes metrics, enriches metadata, and sends metrics to Sumo Logic.
Metrics collection pipeline
In the architecture shown above, there are three services that make up the metrics collection pipeline: Telegraf, Prometheus, and Sumo Logic Distribution for OpenTelemetry Collector.
The first service in the pipeline is Telegraf. Telegraf collects metrics from Nginx. Note that we’re running Telegraf in each pod we want to collect metrics from. This is known as a sidecar deployment: Telegraf runs in the same pod as the containers it monitors. Telegraf uses an input plugin to obtain metrics, in this case, the Nginx input plugin. (For simplicity, the diagram doesn’t show the input plugins.) The injection of the Telegraf sidecar container is done by the Telegraf Operator shown above.
There is no need for the Telegraf sidecar if your application can already expose metrics in the Prometheus format. In this case, you need to configure the application so that Prometheus knows it should scrape metrics from it.
Prometheus is the next service in the pipeline — its job is to scrape metrics from each of the Telegraf containers. Prometheus knows what to scrape and how by referring to Kubernetes prometheus.io annotations attached to the pods in the cluster. Prometheus sends the metrics to Sumo Logic Distribution for OpenTelemetry Collector using the remote write capabilities of Prometheus.
Sumo Logic Distribution for OpenTelemetry Collector enriches the metrics with metadata and sends the metrics to Sumo Logic.
Configuration process
-
To start collecting metrics from a Telegraf-supported application input plugin, you'll need to install the Sumo Logic Kubernetes Collection Helm Chart, which packages up all of these components as part of the collection process for the Sumo Logic Kubernetes Solution.
What is Helm?Helm is a Kubernetes package and operations manager. Helm charts simplify the process of deploying components to Kubernetes environments.
-
Enable the Telegraf Operator by setting
telegraf-operator.enabled=truein configuration for the Sumo Logic Kubernetes Collection Helm Chart.For example, suppose you're running Nginx in your Kubernetes cluster, and you've enabled the status module for Nginx. The following annotation added the Nginx deployment instructs the Telegraf Operator to configure an Nginx input for telegraf to read those metrics.
telegraf.influxdata.com/inputs: |+
  [[inputs.nginx]]
urls = ["http://localhost:8080/stub_status"] -
Add these annotations to tell Telegraf to make its metrics available to Prometheus, and instruct Prometheus to discover the metrics.
telegraf.influxdata.com/class: sumologic-prometheus
prometheus.io/scrape: "true"
prometheus.io/port: "9273"