Collector Troubleshooting and FAQ
To interact with other Sumo Logic users, post feedback, or ask a question, visit the Sumo Logic Community Collect Data Forum.
This section provides frequently asked questions about collecting data into Sumo Logic and the answers you need.
Collector fails to connect to Sumo
For this issue, the failure to connect may be due to the target server failed to respond or HTTP 504 or HTTP 408 errors.
Question
I'm not receiving any data from my new Collectors located in AWS EC2. Why do I see the following error in my collector.log files?
2015-01-12 17:29:48,216 [HTTP Sender - 15] WARN com.sumologic.scala.collector.CommonsHTTPTransmitter - ConnectException for receiver url: 'collectors.sumologic.com:443'; on attempt: '2'
org.apache.http.NoHttpResponseException: The target server failed to respond
Answer
This warning indicates that a brief lapse in network connectivity between your Collector and Sumo Logic has occurred. Normally it can be safely ignored because the Collector will automatically retry once per minute until a successful connection is established.
Here are a few troubleshooting steps to try when your Collector is consistently unable to connect to the Service:
- Test DNS resolution and connectivity to the Sumo servers:
curl -i https://collectors.sumologic.com
# you should see the word "Tweep" returned - Check whether there is a significant delay in performing the DNS lookup:
time nslookup collectors.sumologic.com - Rule out dropped packets due to jumbo frames being unsupported by your network end points. For example, MTU being set to 9001 bytes vs. the age old default of 1500 bytes. In newer AWS EC2 VPC's, the MTU is set to 9001 by default. This is referred to as using jumbo frames and can cause packet loss since not all devices on the internet support large packet sizes. Path MTU Discovery is responsible for ensuring that packets of the correct size are sent to each end point by first checking whether the end point can handle jumbo frames, and then resending the packet in smaller chunks until it's successfully sent. Packets will be dropped in cases where ICMP Unreachable messages are disabled on the receiving end since Path MTU Discovery relies on these messages to determine the correct packet size.
Setting the default MTU on a Linux Operating System
If your client runs in a Linux operating system, you can review and set the MTU value by using the ip command. Run the following command to determine the current MTU value:
$ ip addr show eth0
Review the value following mtu in the output. If the value is not 1500, run the following command to set it:
$ ip link set dev eth0 mtu 1500
Setting the default MTU on a Microsoft Windows Operating System
Browse to the following registry key:
HKEY_LOCAL_MACHINE\System\CurrentControlSet\Services\Tcpip\Parameters\Interfaces\adapter_ID
The value name is MTU and the data value should be set to 1500. This setting is a DWORD data type. Restart the computer after changing this setting for the new value to be applied.
Collector locking log files on Windows servers
The Sumo Logic Collector will hold a log file open for read while log messages are actively being written to the file, and may not close the file for up to a couple minutes after the log has stopped being written to. In some instances, this could prevent the log file from properly rotating. This issue can be resolved on 64-bit versions of Windows by upgrading to the 64-bit version of the Collector. This is a one-time manual update to existing Collectors. Any further upgrades of the Collectors through the UI will continue to update using the same 64-bit version.
To manually upgrade the Collector from 32-bit to 64-bit
-
Stop the existing Collector service.
-
Make a backup copy of the current
C:\Program Files (x86)\configdirectory and place this in a safe temporary location. -
Make a backup copy of the current
C:\Program Files (x86)\cachedirectory and place this in a safe temporary location. -
Run the Collector uninstall to completely remove the existing 32bit Collector.
-
Run the new 64-bit Collector install to reinstall the Collector.
noteThe new install will create a new collector in the UI with an appended epoch time. Deleted this from the UI as the last step in this process.
-
Stop the new Collector service. (It will have automatically started.)
-
Copy the previously backed up
/configand/cachedirectories and put them into the new Collector installation directory, overwriting the existing/configand/cachedirectories. -
Restart the Collector service.
This should safely update the Collector and keep all your existing configurations and Sources. The Collector will start back where it left off in the logs when the previous Collector was stopped.
Windows - This Collector does not seem to have tanuki wrapper integration enabled
Error messages on Windows: "This Collector does not seem to have tanuki wrapper integration enabled."
Question
When attempting to upgrade a Windows Collector from the UI, the upgrade fails and the following error is reported in the tool tip of the failed Collector:
"This Collector does not seem to have tanuki wrapper integration enabled."
Answer
This is a known issue regarding upgrading a Windows collector from versions 19.60-x to the latest released version. The cause is a missing wrapper.dll file, which is required during a pre-check test of the Collector during upgrade. To correct this issue and allow the upgrade to succeed, perform the following steps on the affected host:
-
Download the wrapper-dll.zip file attached to this article, which includes the missing wrapper.dll files.
-
Stop the Sumo Logic Collector service running on the host.
-
Unzip the downloaded file and place the extracted .dll files into the following directory, where <version> is the "current version" listed in the upgrade UI in Sumo Logic:
C:\Program Files\Sumo Logic Collector\<version-specific>\bin\native\lib -
Restart the Sumo Logic Collector service.
-
Classic UI. In the main Sumo Logic menu, select Manage Data > Collection > Collection.
New UI. In the Sumo Logic top menu select Configuration, and then under Data Collection select Collection. You can also click the Go To... menu at the top of the screen and select Collection. -
Click Upgrade Collectors, and select the Retry option next to the failed Collector.
-
Configure Limits for Collector Caching
Caching of outbound data is supported for Installed Collectors when a Collector is throttled or paused or the connection is broken. Data is cached first in memory and then on disk.
You can configure the amount of space available for caching of log and metric data on disk.
By default, the Collector supports caching the following amount of compressed data:
-
Up to 4GB total disk space, including:
- Up to 3GB for log data
- Up to 1GB for metric data
To raise or lower the disk limits for Collector caching:
-
Stop the Sumo Logic Collector service.
- On Windows:
net stop sumo-collector - On Linux:
sudo ./collector stop
- On Windows:
-
Modify the collector.properties file located in the config subdirectory of the Sumo Logic Collector installation directory. Make the following changes and save the file.
- To set the limit for disk caching for logs (for example, 2GB), add the following line:
queue.max.disk.gb = 2 - To set the limit for disk caching for metrics (for example, 2GB), add the following line:
queue.metrics.max.disk.gb = 2
- To set the limit for disk caching for logs (for example, 2GB), add the following line:
-
Start the Sumo Logic Collector service.
- On Windows:
net start sumo-collector - On Linux:
sudo ./collector start
- On Windows:
You can revert back to a default configuration by removing the corresponding line from the collector.properties file and restarting the Collector service.
Flushing Mode
Unlike the fixed size cache, which evicts old data to make room for new data, Flushing Mode stops collection of new data and focuses only on sending existing data (flushing the cache).
The Collector enters Flushing Mode when less than 10% of free disk space remains on the disk where the Collector is installed.
To raise or lower the disk limits for Flushing Mode:
-
Stop the Sumo Logic Collector service.
- On Windows:
net stop sumo-collector - On Linux:
sudo ./collector stop
- On Windows:
-
Modify the collector.properties file located in the config subdirectory of the Sumo Logic Collector installation directory. Make the following changes and save the file.
- To set the free space percentage threshold for entering flush mode (by default, 10%), add the following line:
freeSpace.threshold.percent = 10 - To disable Flushing Mode:
freeSpace.threshold.percent = 0
- To set the free space percentage threshold for entering flush mode (by default, 10%), add the following line:
-
Start the Sumo Logic Collector service.
- On Windows:
net start sumo-collector - On Linux:
sudo ./collector start
- On Windows:
You can revert back to a default configuration by removing the corresponding line from collector.properties file and restarting the Collector service.
Delete data already collected to Sumo Logic
Question
Is it possible to delete data already collected into Sumo Logic? I've ingested some private information into my Sumo Logic account by mistake and I want to remove it so that search results do not show this data. Is this possible?
Answer
Sumo Logic does not support the deletion of specific log messages. You can either delete the entire data ingested in a given time range and index or choose to hide the specific log message. Following is a explanation of these techniques:
- To request data deletion from your account, you can send a request to Sumo Logic Support through your account administrator. We will be able to delete all data within the specified time range for particular views/partitions that you have set up.
- If you do not want to delete all the data in the specified time range, an alternative is hiding the selective messages. You can achieve this in one of the two available ways:
- Create Role filters that will hide the unwanted data so it is not searchable within the account. To do this, you can apply a role filter query string matching this data to the user roles for whom the unwanted data should not be visible.
- You can reach out to Sumo Logic Support through your account administrator, who can help in applying filters across your account so that all users in your organization are not able to access the unwanted logs.
It is also important to note that deleting data has no effect on the log ingestion rate that is displayed on the Accounts Page. Once data has been received by Sumo Logic it is counted against your account limits. However, on-demand charges are based on a daily average across the entire billing cycle and most daily spikes can be absorbed over a billing period.
Enabling updated Remote Windows Event Collection with 19.155 Collector
The 19.155 release of the Sumo Logic collector introduces a new collection approach for Remote Windows Event sources. The new approach provides increased collection throughput, lower resource consumption, and easier configuration.
However, system configuration requirements for the new implementation differ from those of earlier collector versions. For the sake of compatibility, the new implementation is left as "opt-in" for version 19.155. This topic describes how to enable this new capability.
This topic applies only to the 19.155 version of the Sumo Logic collector, and only relates to Remote Windows Event Log sources.
Enabling updated remote event collection
Take the following steps to opt-in to the updated Remote Windows Event source:
-
Stop the Sumo Logic collector service
net stop sumo-collector -
Modify the text file "collector.properties", located in the "config" subdirectory of the Sumo Logic collector installation directory. Add the following line, and save:
windows.remote.jni = true -
Start the Sumo Logic collector service:
net start sumo-collector
You can revert back to legacy WMI-based event collection at any time by removing this line from "collector.properties" (or setting the value to "false"), and restarting the collector service.
File Locking problems when using Windows UNC with Local File Sources
The contents of this article are only valid for Collector versions later than 19.73.
The Sumo Logic Collector uses two different code paths when attempting to Collect from local file sources on Windows:
- "Windows Rollable" path: This code path will be used by a Collector for local files that are not UNC paths.
- Normal code path: Anything else. This code path is more efficient, but it could block rolling on some Windows files.
Historically, the Windows Rollable path had some issues collecting from UNC file paths that pointed to mounted network drives, which is why the "Windows Rollable" option for UNC paths was disabled altogether. If you're collecting local files via UNC paths, its likely the locking semantics of the local filesystem are preserved, which does not allow for the rotation.
The Collector has an option to override the default path it uses for collection. The following flag will tell the Collector to use the Windows Rollable path for UNC file paths and should address any problems with file locking on the remote system.
-
Open
/<sumo_home>/config/collector.propertiesto edit. -
Add the following parameter to the end of the file or update the existing parameter:
collector.localfile.inputType = nonblocking -
Save the new collector.properties file.
-
Restart the Collector service.
Increase Collector Memory
Collectors are set to use 128MB of RAM by default. If your Collectors ingest more than a few files, you should consider increasing the max heap size the Collector can use.
Memory Error
A Collector may fail to launch if there isn't adequate memory available. The Collector logs will have the following error:
WrapperSimpleApp Error: java.lang.OutOfMemoryError: GC overhead limit exceeded
New Collector
When registering a new Collector you can specify the parameter wrapper.java.maxmemory in user.properties with a higher memory value than the default 128MB. For example, a user.properties file with a memory setting of 2048MB would look like:
name = My Collector
accessid = accessId
accesskey = accessKey
wrapper.java.maxmemory = 2048
| Parameter | Description | Can be changed after installation? |
|---|---|---|
wrapper.java.maxmemory | Sets the maximum java heap size, in MB. Default: 128 | Yes, with Collector restart. |
Command line installer
When using the command line (shell script) installer you can specify the parameter -Vwrapper.java.maxmemory with a higher memory value than the default 128MB. For details and example commands on Collector installation, see Install a Collector on Linux, Install a Collector on MacOS, and Install a Collector on Windows.
For example, the parameter with a memory setting of 2048MB would look like:
-Vwrapper.java.maxmemory=2048
| Parameter | Description | Can be changed after installation? |
|---|---|---|
wrapper.java.maxmemory | Sets the maximum java heap size, in MB. Default: 128 | Yes, with Collector restart. |
Existing Collector
If user.properties contains the content listed in Increase memory for collectors upgraded from versions before 19.137 below, follow the instructions in that section.
To increase the maximum Java Heap size:
-
On the computer running the Collector, open
install_directory/config/user.properties. -
Add or locate the following parameter:
wrapper.java.maxmemory=128 -
Increase the
wrapper.java.maxmemoryvalue, based on the number of files you expect to collect from.- 512MB for dozens of files
- 1024MB for 100 files
- 2048MB for more than 100 files
- 4096MB for more than 1000 files
These are general guidelines since your exact memory requirement depends on how many sources are configured, log volume, use of wildcards and recursive scans in the path expressions, and filters.
If you're using centralized data collection, you must increase collector memory.
- Restart the collector using the command:
install_directory/collector restart
Monitor memory issues
To monitor collectors for out-of-memory issues, ingest the collector logs, and schedule following search to run every 15 minutes with time range last 15 minutes.
_sourceCategory=*LocalCollectorLogs* "java.lang.OutOfMemoryError: Java heap space"
| timeslice 15m
| count by _timeslice, _collector
| "/docs/send-data/collector-faq#increase-memory-in-a-collector" as sumoHelp
| concat ("collector: ", _collector, " identified with insufficient max heap memory. Increase java heap space allocation for it. Refer: ", sumoHelp) as msg
| sort by _timeslice, _collector | fields -sumoHelp
Increase memory for collectors upgraded from versions before 19.137
If the user.properties file contains these lines:
wrapper.app.parameter.2=-b
wrapper.app.parameter.3=installerSources/selected.json
wrapper.filter.trigger.1000=java.lang.OutOfMemoryError
you must append the following to the end of the Sumo_install_dir/config/wrapper.conf file:
# Overwrite the defaults with any properties in user.properties
#include ./config/user.properties
Then update user.properties as follows:
- Delete the above-mentioned three lines (the lines that begin with
wrapper.) - Add the following line:
wrapper.java.maxmemory=<some_value>
You can now restart the Collector as described in Start or Stop a Collector Using Scripts.
Increase Max Threads for Collector
The Collector will use three threads per available CPU by default. For example, if you have a six CPU system the default number of threads used by Sources would be 18. This may not be enough to keep up with data collection.
If you're noticing a delay in ingestion and the data you do see is being ingested in batches check your Collector /logs/ directory for the following type of log:
2018-09-26 15:14:15,701 -0400 [Blade0000000000000000-Scanner] INFO com.sumologic.scala.collector.blade.wildcard.WildcardBlade$$anon$1 - purely dealing with non backlog items with 6 threads
If this log is present you need to increase the threads available to the Collector or reduce the rate and volume of data for it to collect. To increase the thread count:
-
Stop the current Collector service/process.
-
Locate the Collector configuration file
/<sumo_install_dir>/config/collector.properties. -
Add the following parameter to increase the max threads count. We suggest a max setting of 60.
source.max.threads.num = 60 -
Restart the Collector process/service.
Increase the number of Windows Event messages a Collector can retrieve
The Sumo Logic Collector currently has a hard limit on the number of events a Source can retrieve from an Event Log Source every second. This limit is set to 512 events every 300ms by default. The following message in the Collector logs reference this setting.
2015-01-12 11:20:10,616 -0800 [Blade: 00000000074AB69D - localWinEvent] INFO com.sumologic.scala.collector.blade.win.LocalWinEventLogJNIInput - Retrieved 512 from Security log from RN 2118395523
On Windows servers where the generated number of events is much higher than approximately 1536 events per second, for any single event type, the Collector could start to fall behind on Collection. To address this issue there is a parameter that can be set within the Collector to increase this limit.
-
Open
/<sumo_home>/config/collector.propertiesfor editing. -
Add the following parameter to the end of the file, or update the existing parameter.
localWindowsEventLog.batchSize=1024 -
Save the new
collector.propertiesfile. -
Restart the Collector service.
How to Ingest Old or Historical Data
The overwhelming majority of log data processed by Sumo are nearly real-time messages. For this reason, Sumo's timestamp detection and data indexing systems are optimized to handle streams of data originating in the recent past.
Ingested old or historical data, especially when mixed with recent or real-time data in one source, may occasionally be misinterpreted.
This article describes the assumptions that Sumo makes about customer data, tips to help you make sure your data is handled correctly, and guidance on when to contact Sumo Logic Support regarding historical data uploads.
See using _format for troubleshooting timestamps.
Assumption: Data is less than 30 days but within 365 days
- To ingest historical data older than 30 days but within 365 days, you must specify a
timestampfield using a regex locator and a valid date format.
Assumption: Data is older than 365 days
Sumo Logic assumes that all log message times fall within a window of -1 year through +2 days compared to the current time. Any log messages with a parsed timestamp outside of that window are automatically re-stamped with the current time.
- Data older than 365 days can still be ingested. However, even if a custom timestamp is provided, it will be autocorrected to the current time unless technical support disables this function at the organization level.
- To ingest data older than 365 days with the original timestamp intact, you'll need to contact Support to disable the autocorrection function at the org level.
Assumption: Data from a source will have similar timestamps
Sumo Logic assumes that all log messages coming from a particular source will have timestamps that are close together. If a message comes through that appears to be more than one day earlier or later than recent messages from that source, it will be auto-corrected to match the current time.
Best practices for working with historical data
Use the following tips for working with historical data:
- Avoid mixing old data and new data in the same source. As a best practice, create dedicated sources specifically for historical data.
- To ingest data with timestamps earlier than one year in the past, you must contact Sumo Logic Support. Historical data will be re-stamped with the current time if no adjustment is made to your account.
- To avoid quota throttling during initial upload of historical backlogs, break up your data and load it in chunks. Load the data in sequence, earliest to newest.
- Searching historical data is generally slower than searching more recent data.
Troubleshooting time discrepancies
In most scenarios, the message time and receipt time of a log message in Sumo Logic should be almost the same, within a minute of each other. However, network latency, random (not continuous) spikes in data volume, and service disruptions can cause delays, leading to a discrepancy between message time and receipt time. Large discrepancies can lead to incorrect events being displayed, and may even cause search performance issues. On some occasions, it can also prevent Dashboards from populating with data.
This page explains the elements that can be involved in time discrepancies and offers solutions for troubleshooting your problem.
See details on the supported Timestamps, Time Zones, Time Ranges, and Date Formats.
Message time and receipt time
- Message time represents the time of your log events. This is parsed from your logs by the Collector. When adding a Source to a Collector, most users choose to automatically detect timestamps in their logs and parse them by selecting Extract timestamp information from log file entries in the Source configuration settings.
- Receipt time is the timestamp the log message was received by the Collector. See Use Receipt Time for details.
If Enable Timestamp Parsing is not selected for your Source, Sumo Logic automatically sets the message time to be equivalent to the receipt time.
Time zone configuration
Large time discrepancies are typically related to time zone settings that were specified for a Source during the Collector setup process. When a time zone is incorrectly configured for a data source, it can lead to message time and receipt time discrepancies.
Pay careful attention to the Time Zone specified for a Source. The Use time zone from log file option assumes that a time zone is part of the message timestamp and that it is in a supported Java SimpleDateFormat, as shown below:
| Letter | Date or Time Component | Example |
|---|---|---|
| z | Time zone (General time zone) | Pacific Standard; PST; GMT-08:00 |
| Z | Time zone (RFC 822 time zone) | -0800 |
If no time zone is found in the message, or if the time zone is in an unsupported format, Sumo Logic uses the selected fallback option and applies the appropriate offset to the message time.
Potential time zone configuration issues
The following scenarios represent common time zone-related configuration issues for Sumo users. Review these use cases for insights into potential issues with your time zone configuration.
Example 1 - Unsupported Time Zone format in File
Source Time Zone selection: UTC
Sample Message Timestamp: Sep 28 19:00:00 US/Pacific
In this scenario, “US/Pacific” is not in a valid time zone format, so instead of using GMT-08:00, Sumo Logic applies the UTC time zone. And because of this mismatch, when users run a search for the “last 15 minutes”, the events being retrieved are inaccurate.
Example 2 - Improperly configured Time Zone configuration
Source Time Zone selection: None Selected (”Select a Time Zone” appears in the UI)
Sample Message Timestamp: Sep 28 19:00:00
In this scenario, there is no time zone in the sample message at all. However, the server where the logs were sourced from is located in Los Angeles, so the expectation is that the time zone is GMT-08:00. Because no time zone option was actually selected for the Source, Sumo Logic applies the default UTC time zone to these messages. And similar to the first example, when users run a search for the “last 15 minutes”, the events being retrieved are inaccurate.
Troubleshooting a misconfigured time zone
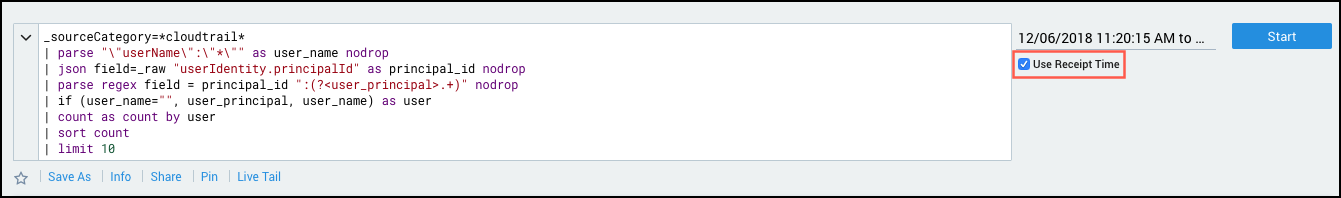
If you are experiencing apparent delays during ingest (receiving data), select the "Use Receipt Time" check box under the time picker. This will present data in the order in which it was received by Sumo, as well as display the timestamp that has been detected/applied.
A gap between the two values indicates a potential misconfiguration of the time zone setting, particularly when the gap is (nearly) a multiple of hours, such as in the following example.
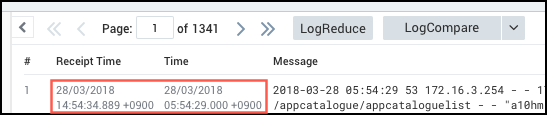
Review your time zone settings, and apply a time zone on the Source that reflects what the time zone is of the sending application. For example, if your application is sending events with a UTC timestamp, you can specify this in the Source configuration.
Finding timestamp deltas
The query below can be executed in your account to find the number of messages for each of your Sources where the receipt time and message time are more than 30 minutes apart. This should at least give you a good starting place for you to run additional analysis.
*
| _receiptTime as r
| _messageTime as t
| t - r as d
| toInt(d) as i
| abs(i) as i
| 30 as minutes
| minutes * 60 * 1000 as milliseconds
| where i > milliseconds
| formatDate(fromMillis(r),"MM/dd hh:mm") as r
| formatDate(fromMillis(t),"MM/dd hh:mm") as t
| count by _collector, _source
| order by _count
After identifying a list of (problematic) Sources in the previous search, you can then use the query below to view the time delay average, the max delay, and the min delay for each Source. Substitute <problem_child> with the Source(s) that you uncovered in the initial query above.
_source=<problem_child>
| _format as format
| formatDate(fromMillis(_receipttime),"MM/dd hh:mm") as r
| formatDate(fromMillis(_messagetime),"MM/dd hh:mm") as t
| abs(_receipttime - _messagetime) as delt| delt/1000/60 as delt
| min(delt), max(delt), avg(delt), stddev(delt), count(*) by _collector, _sourceName
If the average, max, and min delay values are very close in range, then the time difference is most likely the symptom of an incorrect time zone setting. You’ll want to go back and ensure that your Source configurations line up correctly with the log messages. Switch to the raw messages tab and the “format” field shows how the timestamp is parsed from the file.
For both searches above, it’s a good idea to use a relative time range that locates messages over the last 30 minutes based on receipt time.
How can I tell if I'm collecting data?
After installing a Collector and configuring a Source, your data should appear in Sumo Logic in a matter of minutes. How can you confirm that your data is being collected? Try any of the following options.
Check the Status page of Sumo Logic
You can view the total message volume (the volume of all Collectors in your account) and the volume of data from each Collector.
Classic UI. In the main Sumo Logic menu, select Manage Data > Collection > Status.
New UI. In the Sumo Logic top menu select Configuration, and then under Data Collection select Status. You can also click the Go To... menu at the top of the screen and select Status.
As long as you see that some messages are present, your Sumo Logic account is up and running.
Make sure that you're viewing Running Collectors or All Collectors in the Status page. If the Stopped Collectors option is selected, you won't see accurate message volume information.
Try a search
Collected data should be searchable within a couple of minutes. You can run a search based on when Sumo Logic received your data by running a search by Receipt Time. Try specifying the Collector with the metadata field _collector and the Collector name, like _collector=<name>.
If your user account is not an administrator check your Role assignment for any search filters that may be restricting access to the data.
Verify that your Collectors are running
Collectors and Sources in your account are listed on the Collectors page. Collectors and Sources that are running (able to communicate with Sumo Logic and configured to send data) are marked with ![]() . Stopped Collectors and Sources are marked with
. Stopped Collectors and Sources are marked with ![]() . Stopped Collectors do not send any data.
. Stopped Collectors do not send any data.
If a Collector is stopped, you can verify the Collector's status and restart it if necessary.
To check a Collector's status:
-
On the host with the Collector navigate to the Collector's [install_dir]/ and run
#./collector status. The default Collector installation locations are:- Linux:
/opt/SumoCollector/or/usr/local/SumoCollector - Windows:
C:\Program Files (x86)\Sumo Logic CollectororC:\Program Files\Sumo Logic Collector
- Linux:
-
If the status is "stopped" you can restart the Collector by running
#./collector start.Running a Collector on Windows? The Collector's status can be found by running services.msc from an Admin cmd.exe shell, or from the Control Panel. The service is listed under SumoLogic Collector; the startup type should be set to Automatic.
Check timestamp settings
If your log files have missing or faulty time stamp data it can affect the log messages you'll see collected; search results are also affected if time stamp information is incorrect. For example, if a Collector is running on a computer that doesn't contain a UTC offset time (like UTC-0800), the time stamp could be off by several hours, so if you attempted to search logs within the past 15 minutes no search results will appear.
When you configure a Source, you can choose one of three timestamp options. First, make sure that your log data is using a supported timestamp and date format.
To view Source settings:
-
Classic UI. In the main Sumo Logic menu, select Manage Data > Collection > Collection.
New UI. In the Sumo Logic top menu select Configuration, and then under Data Collection select Collection. You can also click the Go To... menu at the top of the screen and select Collection. -
Click Edit to the right of the Source's name.
-
Under Advanced, choose one of the following:
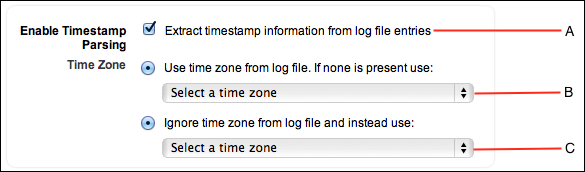
- Extract timestamp information from log file entries. Select this option if you'd like Sumo Logic to always extract timestamps from log messages. If no timestamp is detected, Sumo Logic uses the time when the data is received. Generally, this is the best option (it's also selected by default).
- Use time zone from log file. Choose a time zone that Sumo Logic can use if log files do not have a time stamp. If a Collector is running on a computer set to the UTC time zone without an offset, Sumo Logic will use this time zone.
- Ignore time zone from log file. Choose a time zone to override any time zone information found in log files. If you're collecting log files from disparate time zones, choose this option to set all your Sources to the same time zone.
Changes you make to this option aren't applied retroactively; they are applied to log messages moving forward.
For more information, see Timestamps, Time Zones, Time Ranges, and Date Formats.