AWS Kinesis Firehose for Metrics Source
This page has information about Sumo Logic’s AWS Kinesis Firehose for Metrics source.
You can use the AWS Kinesis Firehose for Metrics source to ingest CloudWatch metrics from the Amazon Kinesis Data Firehose. AWS CloudWatch Metrics can be streamed using AWS Metric Streams, a managed service that exports CloudWatch metrics data with low latency, and without management overhead or custom integration. With Metric Streams, you can create dedicated, continuous streams of metric data that can be delivered to Sumo Logic by Kinesis Data Firehose.
How it works
The diagram below illustrates the metrics collection pipeline.
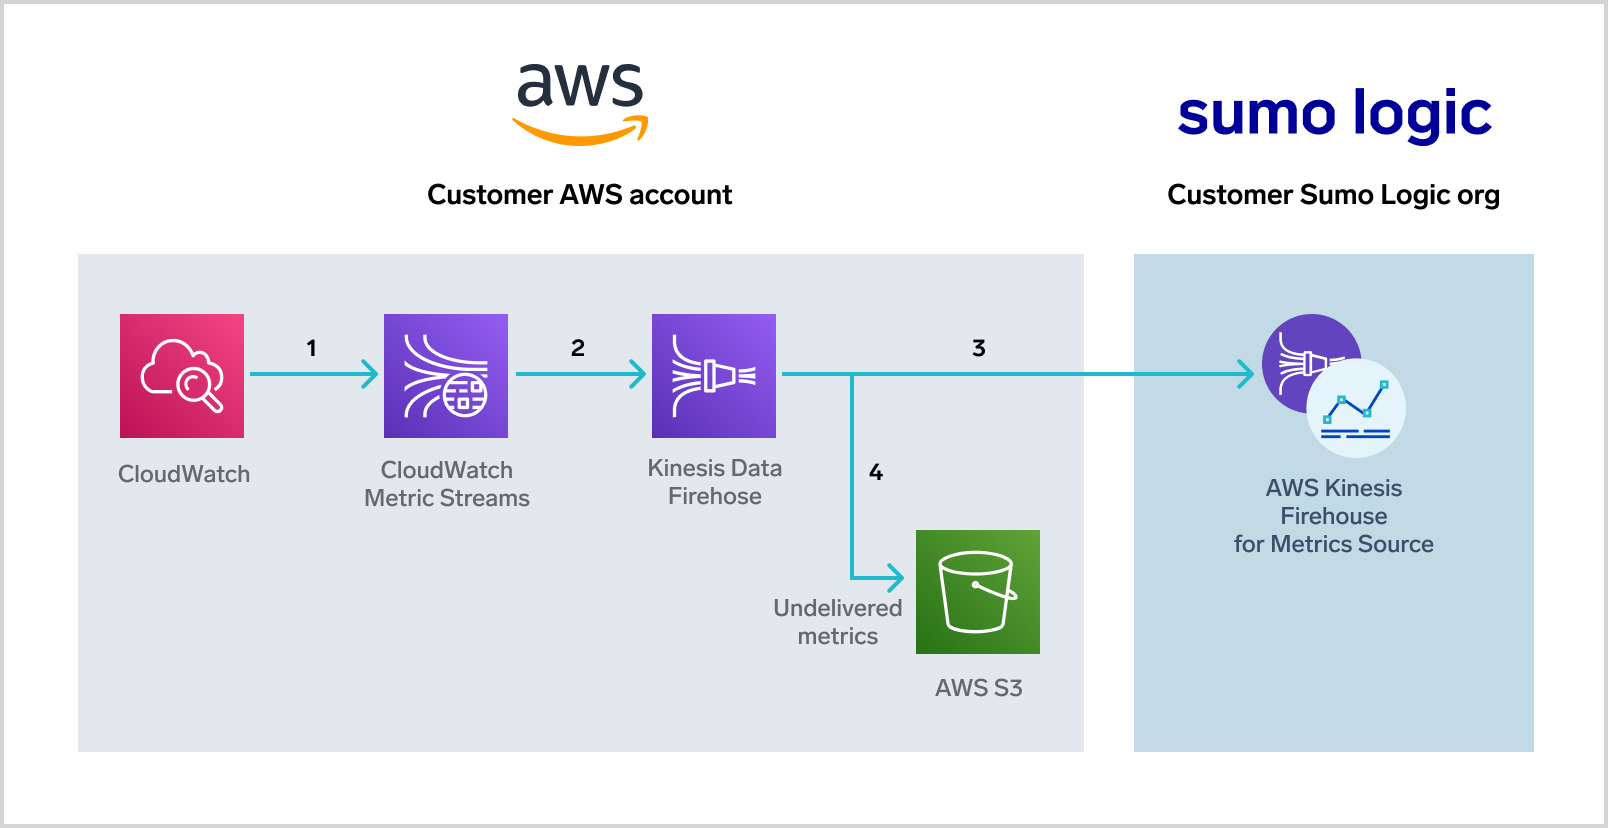
- AWS CloudWatch Metrics are streamed at a 1-minute resolution to the Metric Stream service.
- The Metric Streams service delivers metrics to the Kinesis Data Firehose service.
- The Kinesis Data Firehose service delivers the metrics to the AWS Kinesis Firehose for Metrics source for ingestion. The metrics are in the OpenTelemetry format.
- You can query the metrics in the Sumo Logic Metrics Search.
- Undelivered metrics are routed to a customer S3 bucket.
How long it takes for metrics to be delivered to Sumo Logic depends on the buffering settings configured for the Firehose stream—such buffering is expressed in maximum payload size or maximum wait time, whichever is reached first. If these are set to the minimum values, which are 60 seconds and 1MB respectively, the expected latency is within 3 minutes, if the selected resources have active metric updates.
Kinesis Firehose source or CloudWatch source?
In addition to the new AWS Kinesis Firehose for Metrics source, Sumo Logic also provides the Amazon CloudWatch Metrics source.
The key difference between the sources is how they get metrics. The CloudWatch source polls CloudWatch on a periodic basis. The Kinesis Firehose source receives metrics in streaming mode from Kinesis Firehose. Streaming metrics offers lower latency and higher durability, and avoids your AWS accounts being throttled.
The benefits of a streaming source over a polling source include:
- No API throttling. The Kinesis Firehose for Metrics source doesn’t consume your AWS quota by making calls to the AWS CloudWatch APIs. This offers both efficiency and cost benefits.
- Automatic retry mechanism. Kinesis Firehose has an automatic retry mechanism for delivering metrics to the Kinesis Firehose for Metrics source. In the event of a glitch, the metrics are re-sent after the service is restored. If that fails, Firehose stores all failed messages in a customer-owned S3 bucket for later recovery.
- Consistent speed. Latency is the same for all metrics, whether new, old, sparse, or continuous. This is a benefit over the AWS CloudWatch Metrics source, which doesn’t reliably ingest old or sparsely published metrics.
- High resolution. The Kinesis Firehose streams all metrics at a 1-minute resolution. The AWS CloudWatch Metrics source supports scans as low as 1 minute, but that resolution can result in AWS account throttling and higher AWS bills
The AWS CloudWatch Metrics source uses AWS’s GetMetricStatistics API and as a result, supports the Unit parameter. When a request includes the Unit parameter, only metrics with the unit specified, for example, bytes, Microseconds, and so on, are reported. The Kinesis Firehose for Metrics does not currently support the Unit parameter.
Step 1: Set up the source
In this step, you create the AWS Kinesis Firehose for Metrics source.
- New UI. In the Sumo Logic main menu select Data Management, and then under Data Collection select Collection. You can also click the Go To... menu at the top of the screen and select Collection.
Classic UI. In the main Sumo Logic menu, select Manage Data > Collection > Collection. - Click Add Source next to a Hosted Collector.
- Select AWS Kinesis Firehose for Metrics.
- Enter a Name for the source.
- (Optional) Enter a Description.
- For Source Category, enter any string to tag the output collected from this Source. Category metadata is stored in a searchable field called
_sourceCategory.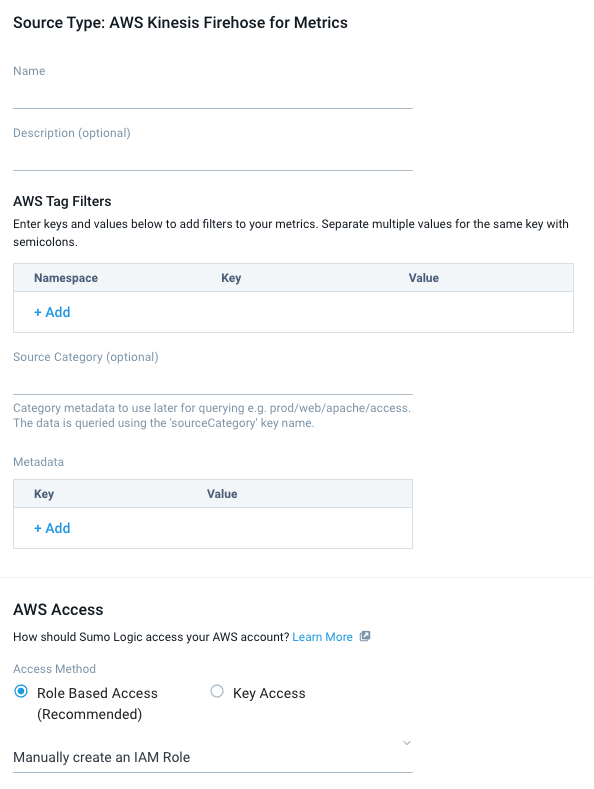
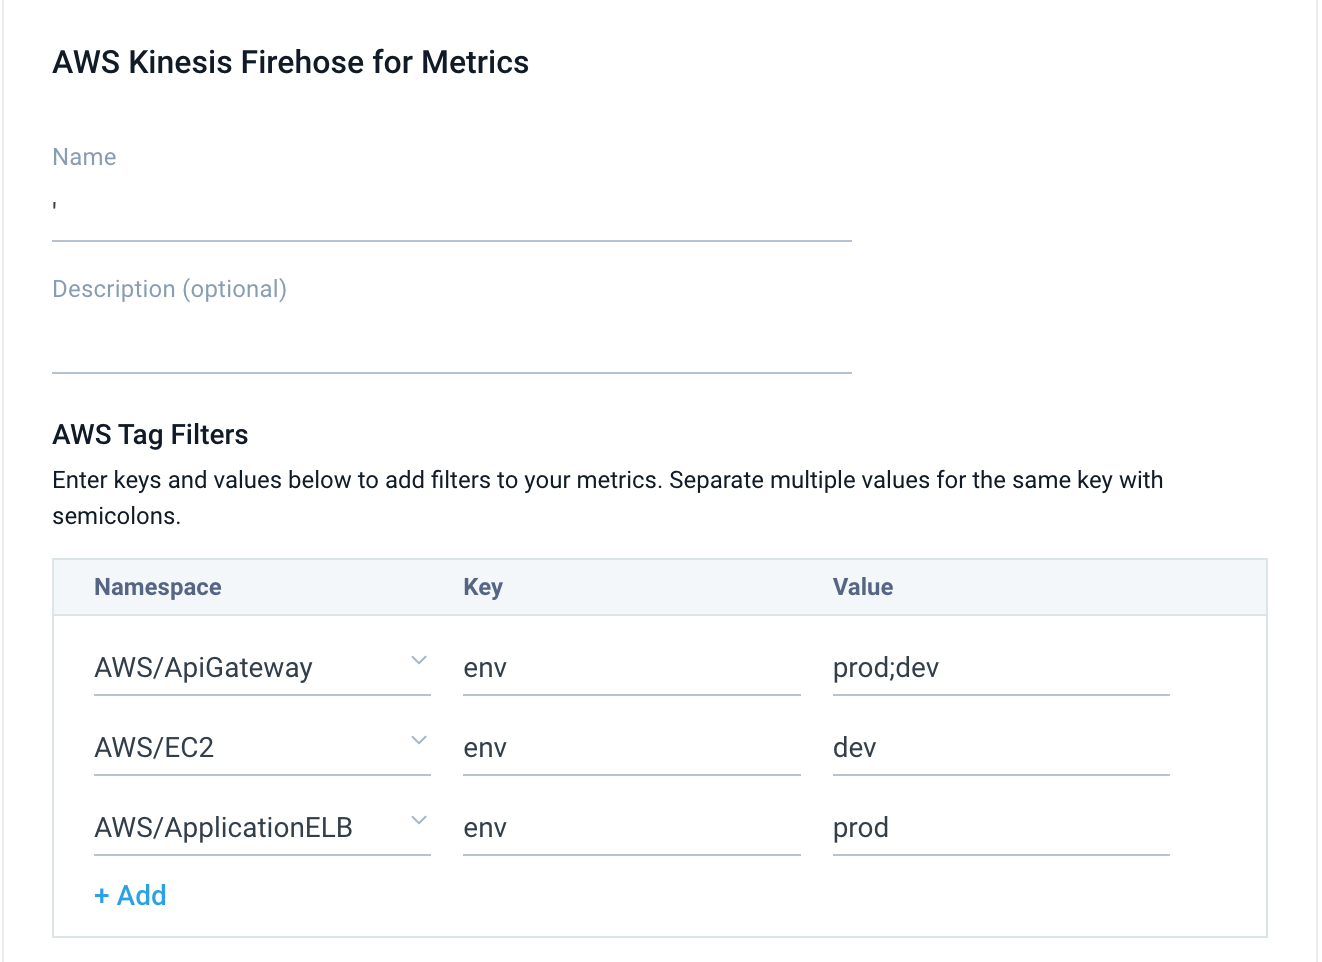
- For AWS Tag Filters (Optional) , enter keys and values to add filters to your metrics. AWS Tag filters are supported for AWS namespaces but not for custom namespaces.
Example
- For AWS Access of a Kinesis Metric source, the role requires
tag:GetResourcespermission. The Kinesis Log source does not require permissions. - Click Save.
Step 2: Set up AWS Metric Streams
In this step, you set up the AWS Metric Streams service to stream metrics to Kinesis Data Firehose using a CloudFormation template:
- Go to Services > CloudFormation in the AWS console.
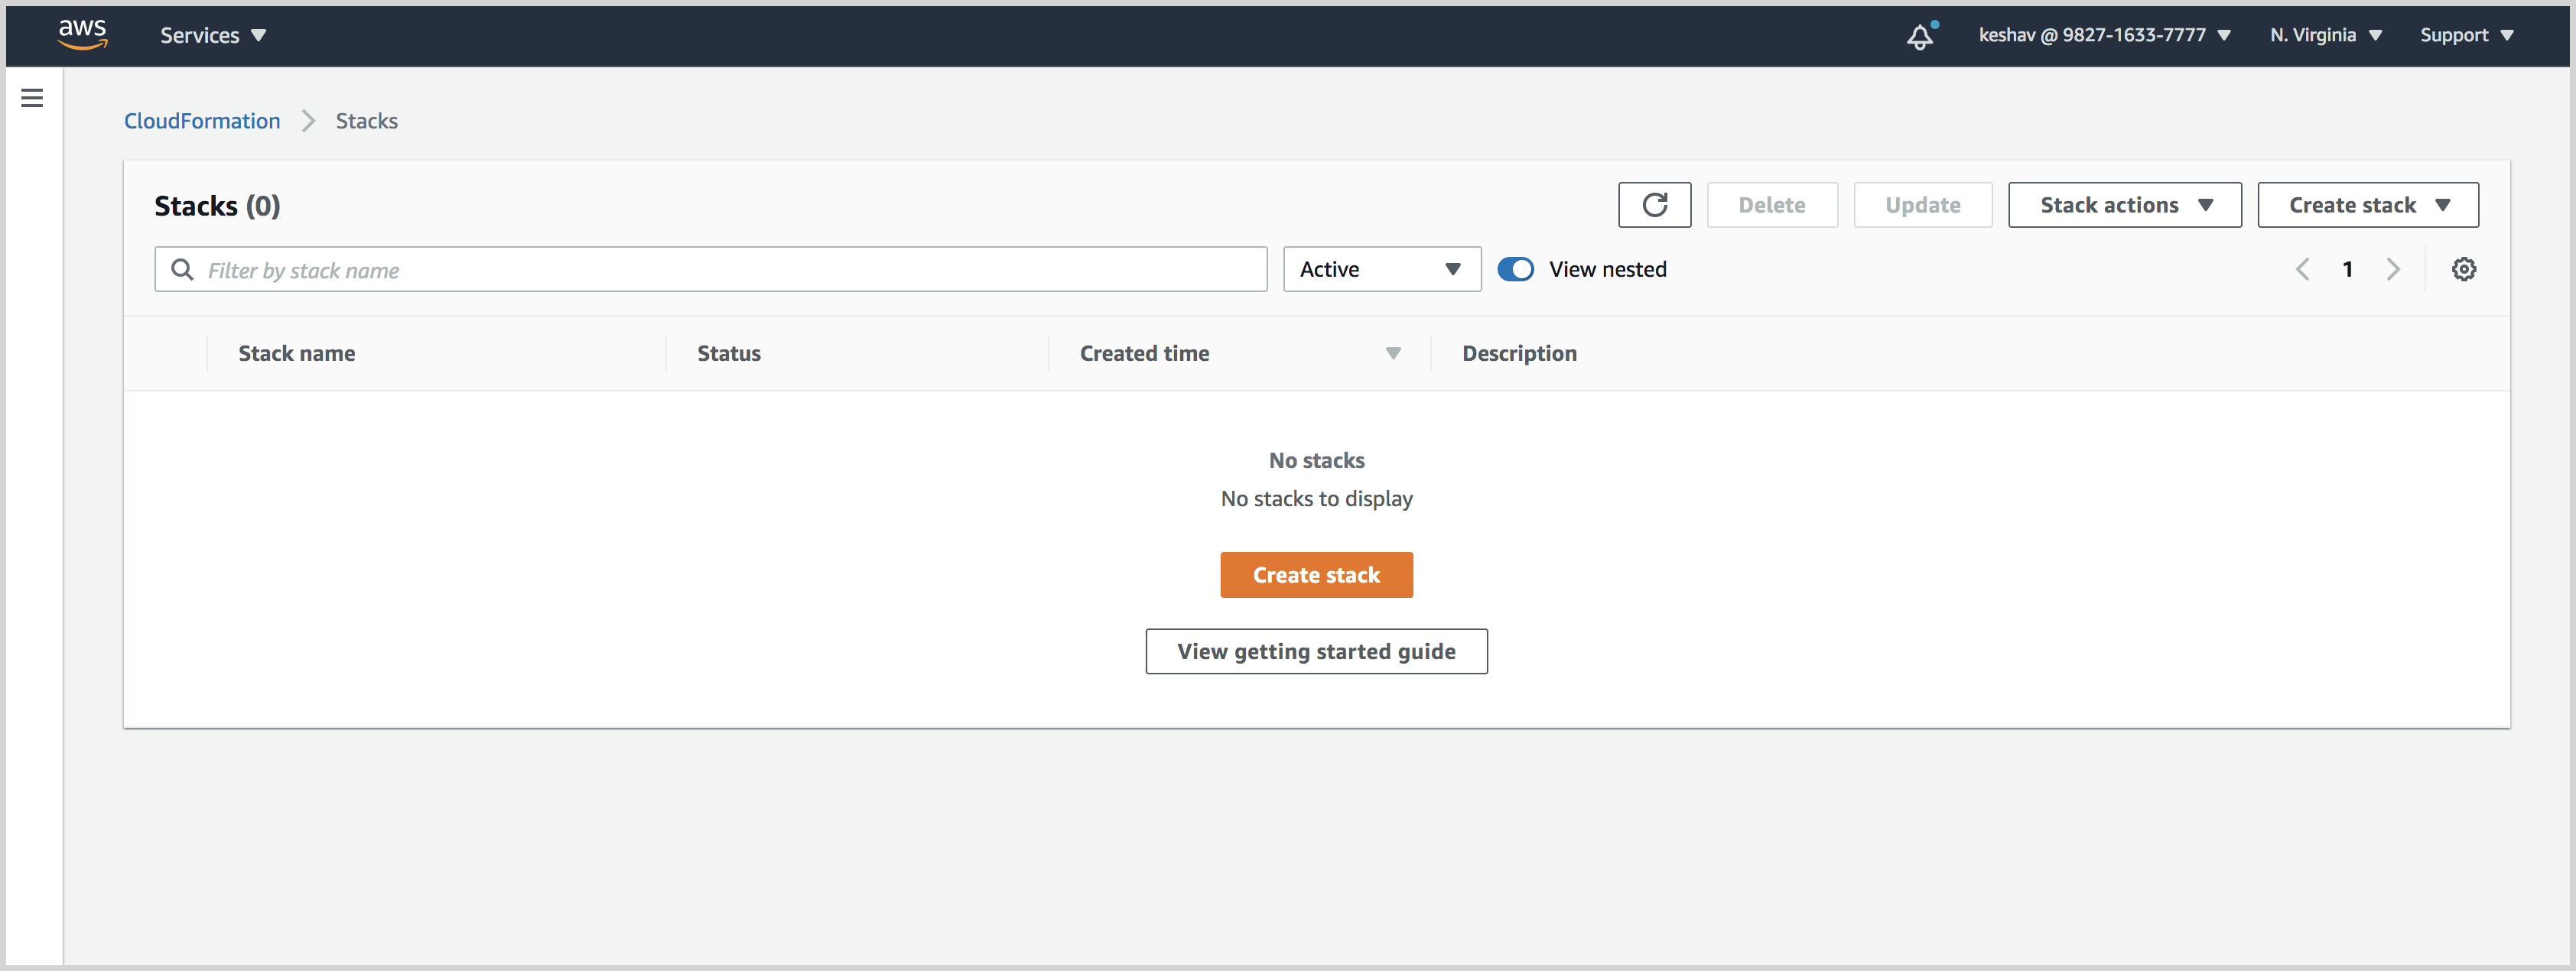
- On the CloudFormation > Stack page, click Create stack.
- On the Create stack page:
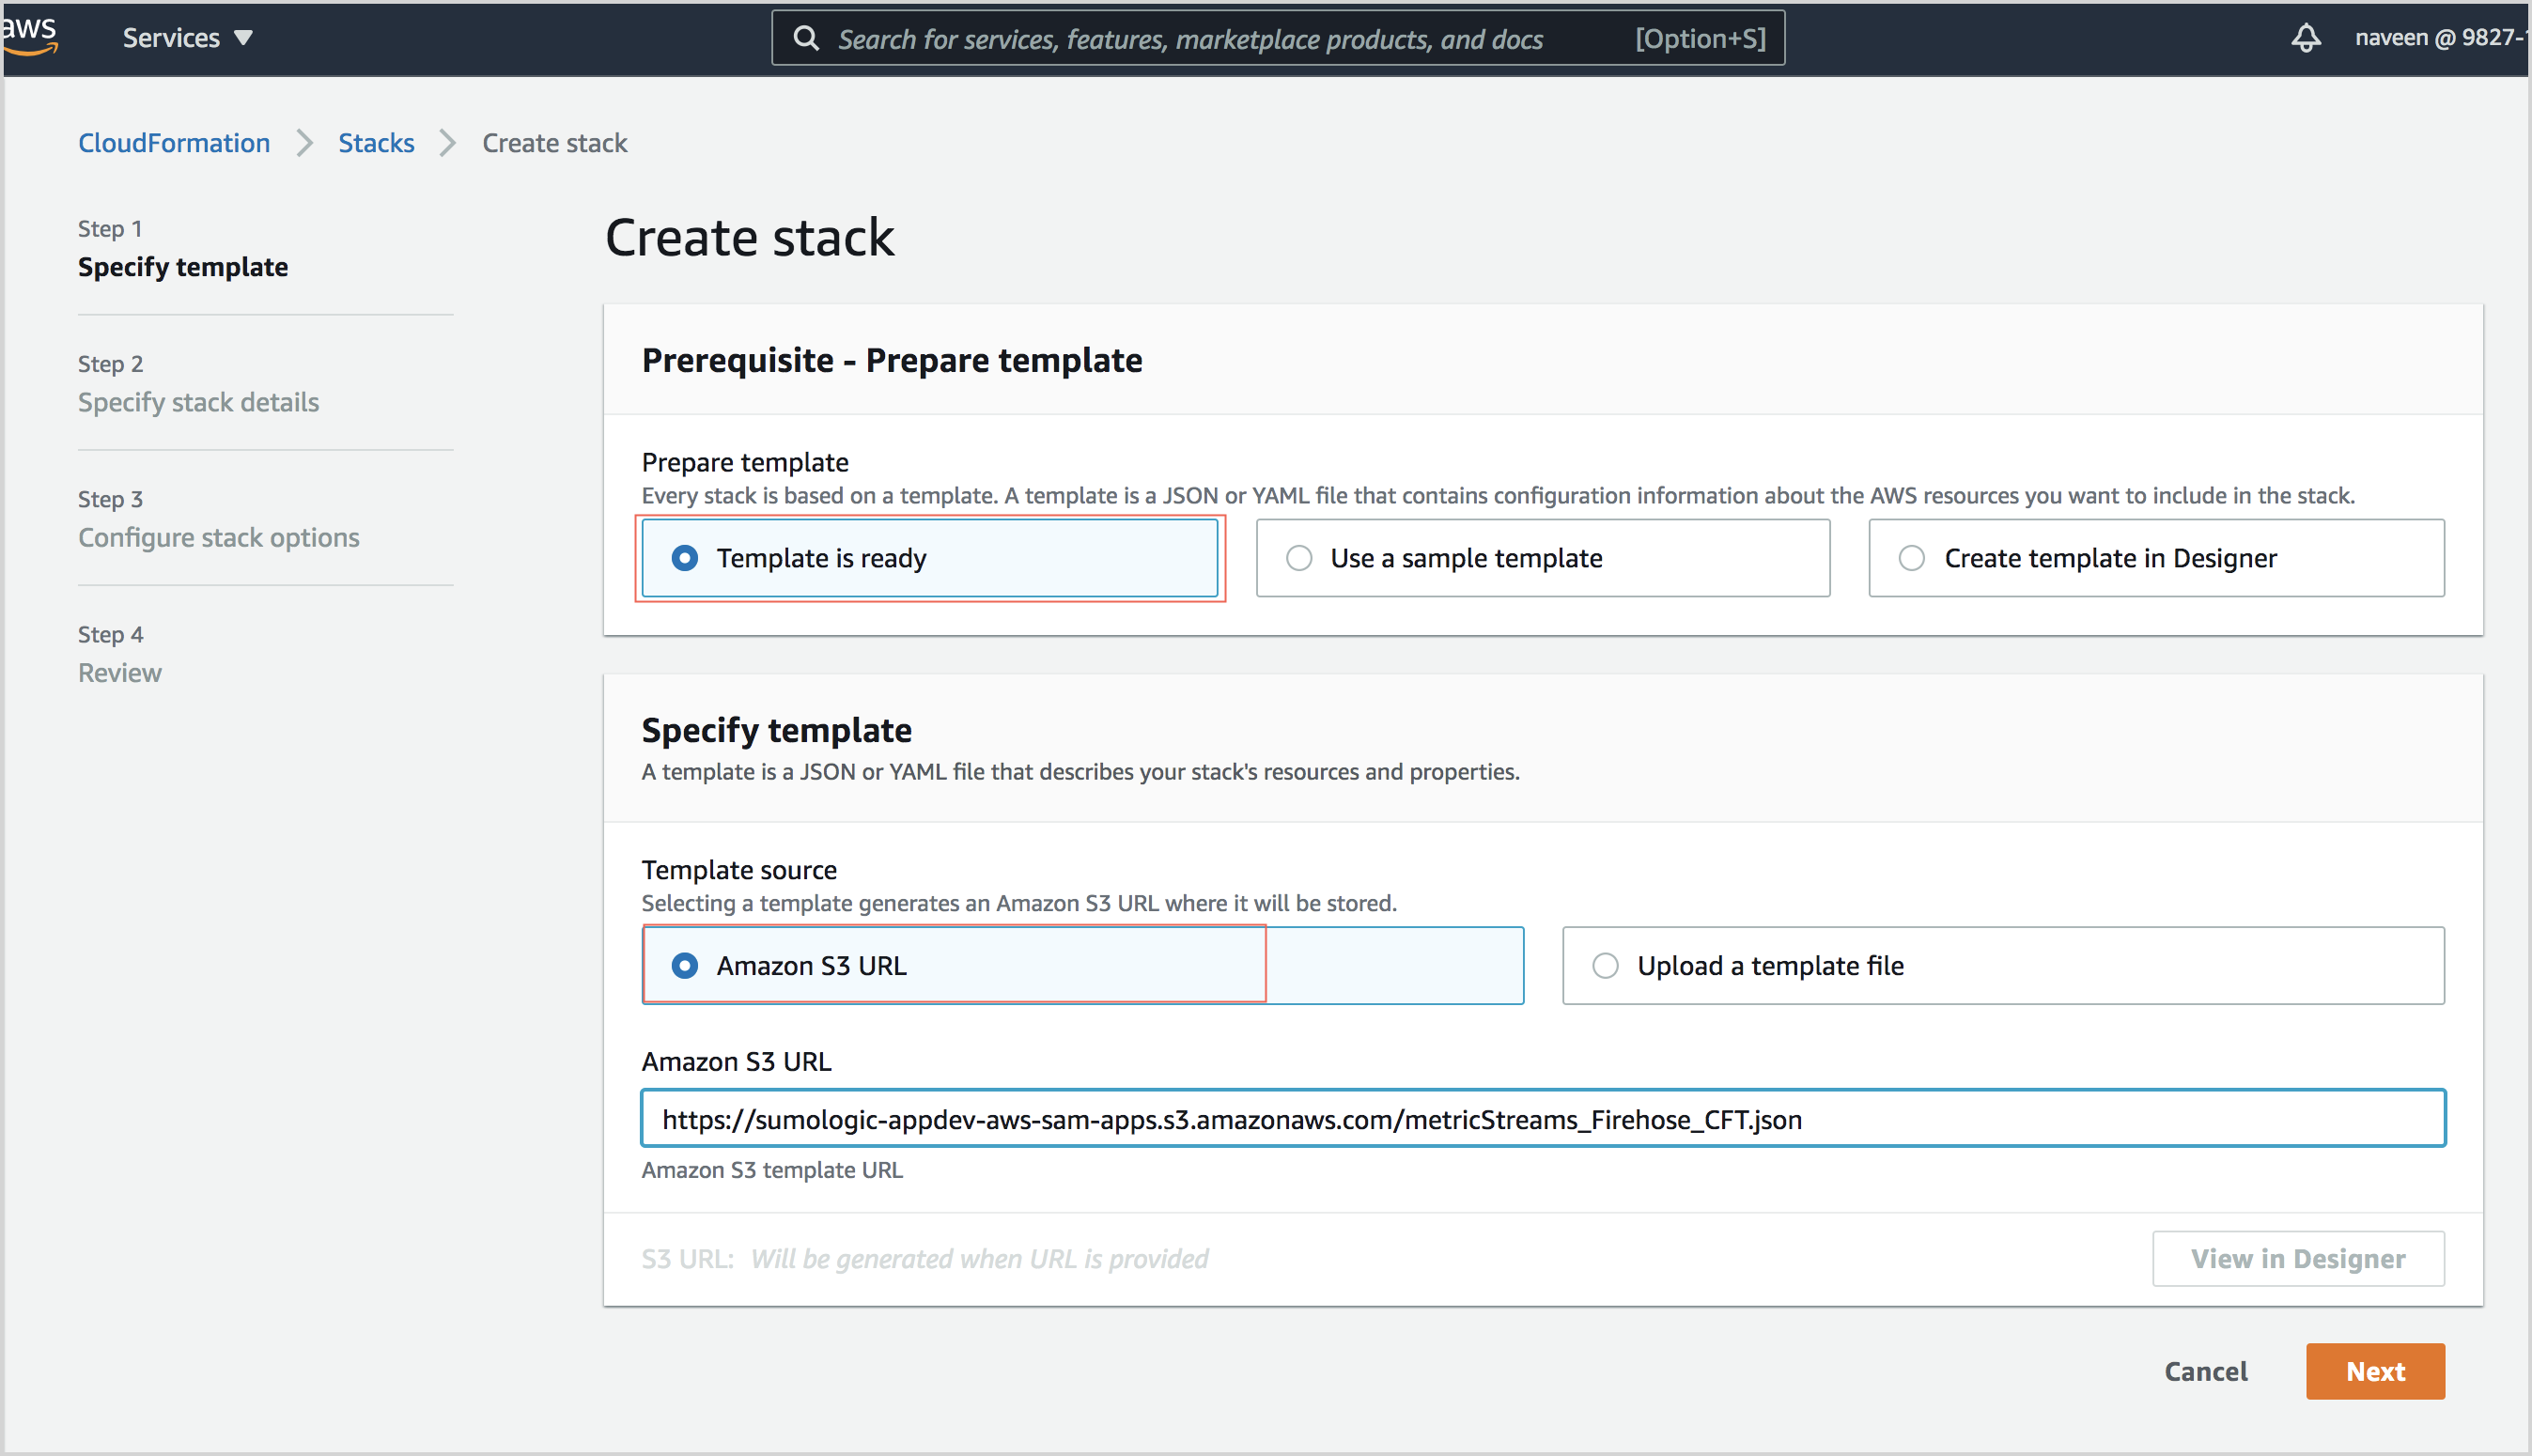
- Click Template is ready.
- Click Amazon S3 URL and paste this URL into the URL field: https://sumologic-appdev-aws-sam-apps.s3.amazonaws.com/KinesisFirehoseCWMetrics.template.yaml.
- Click Next.
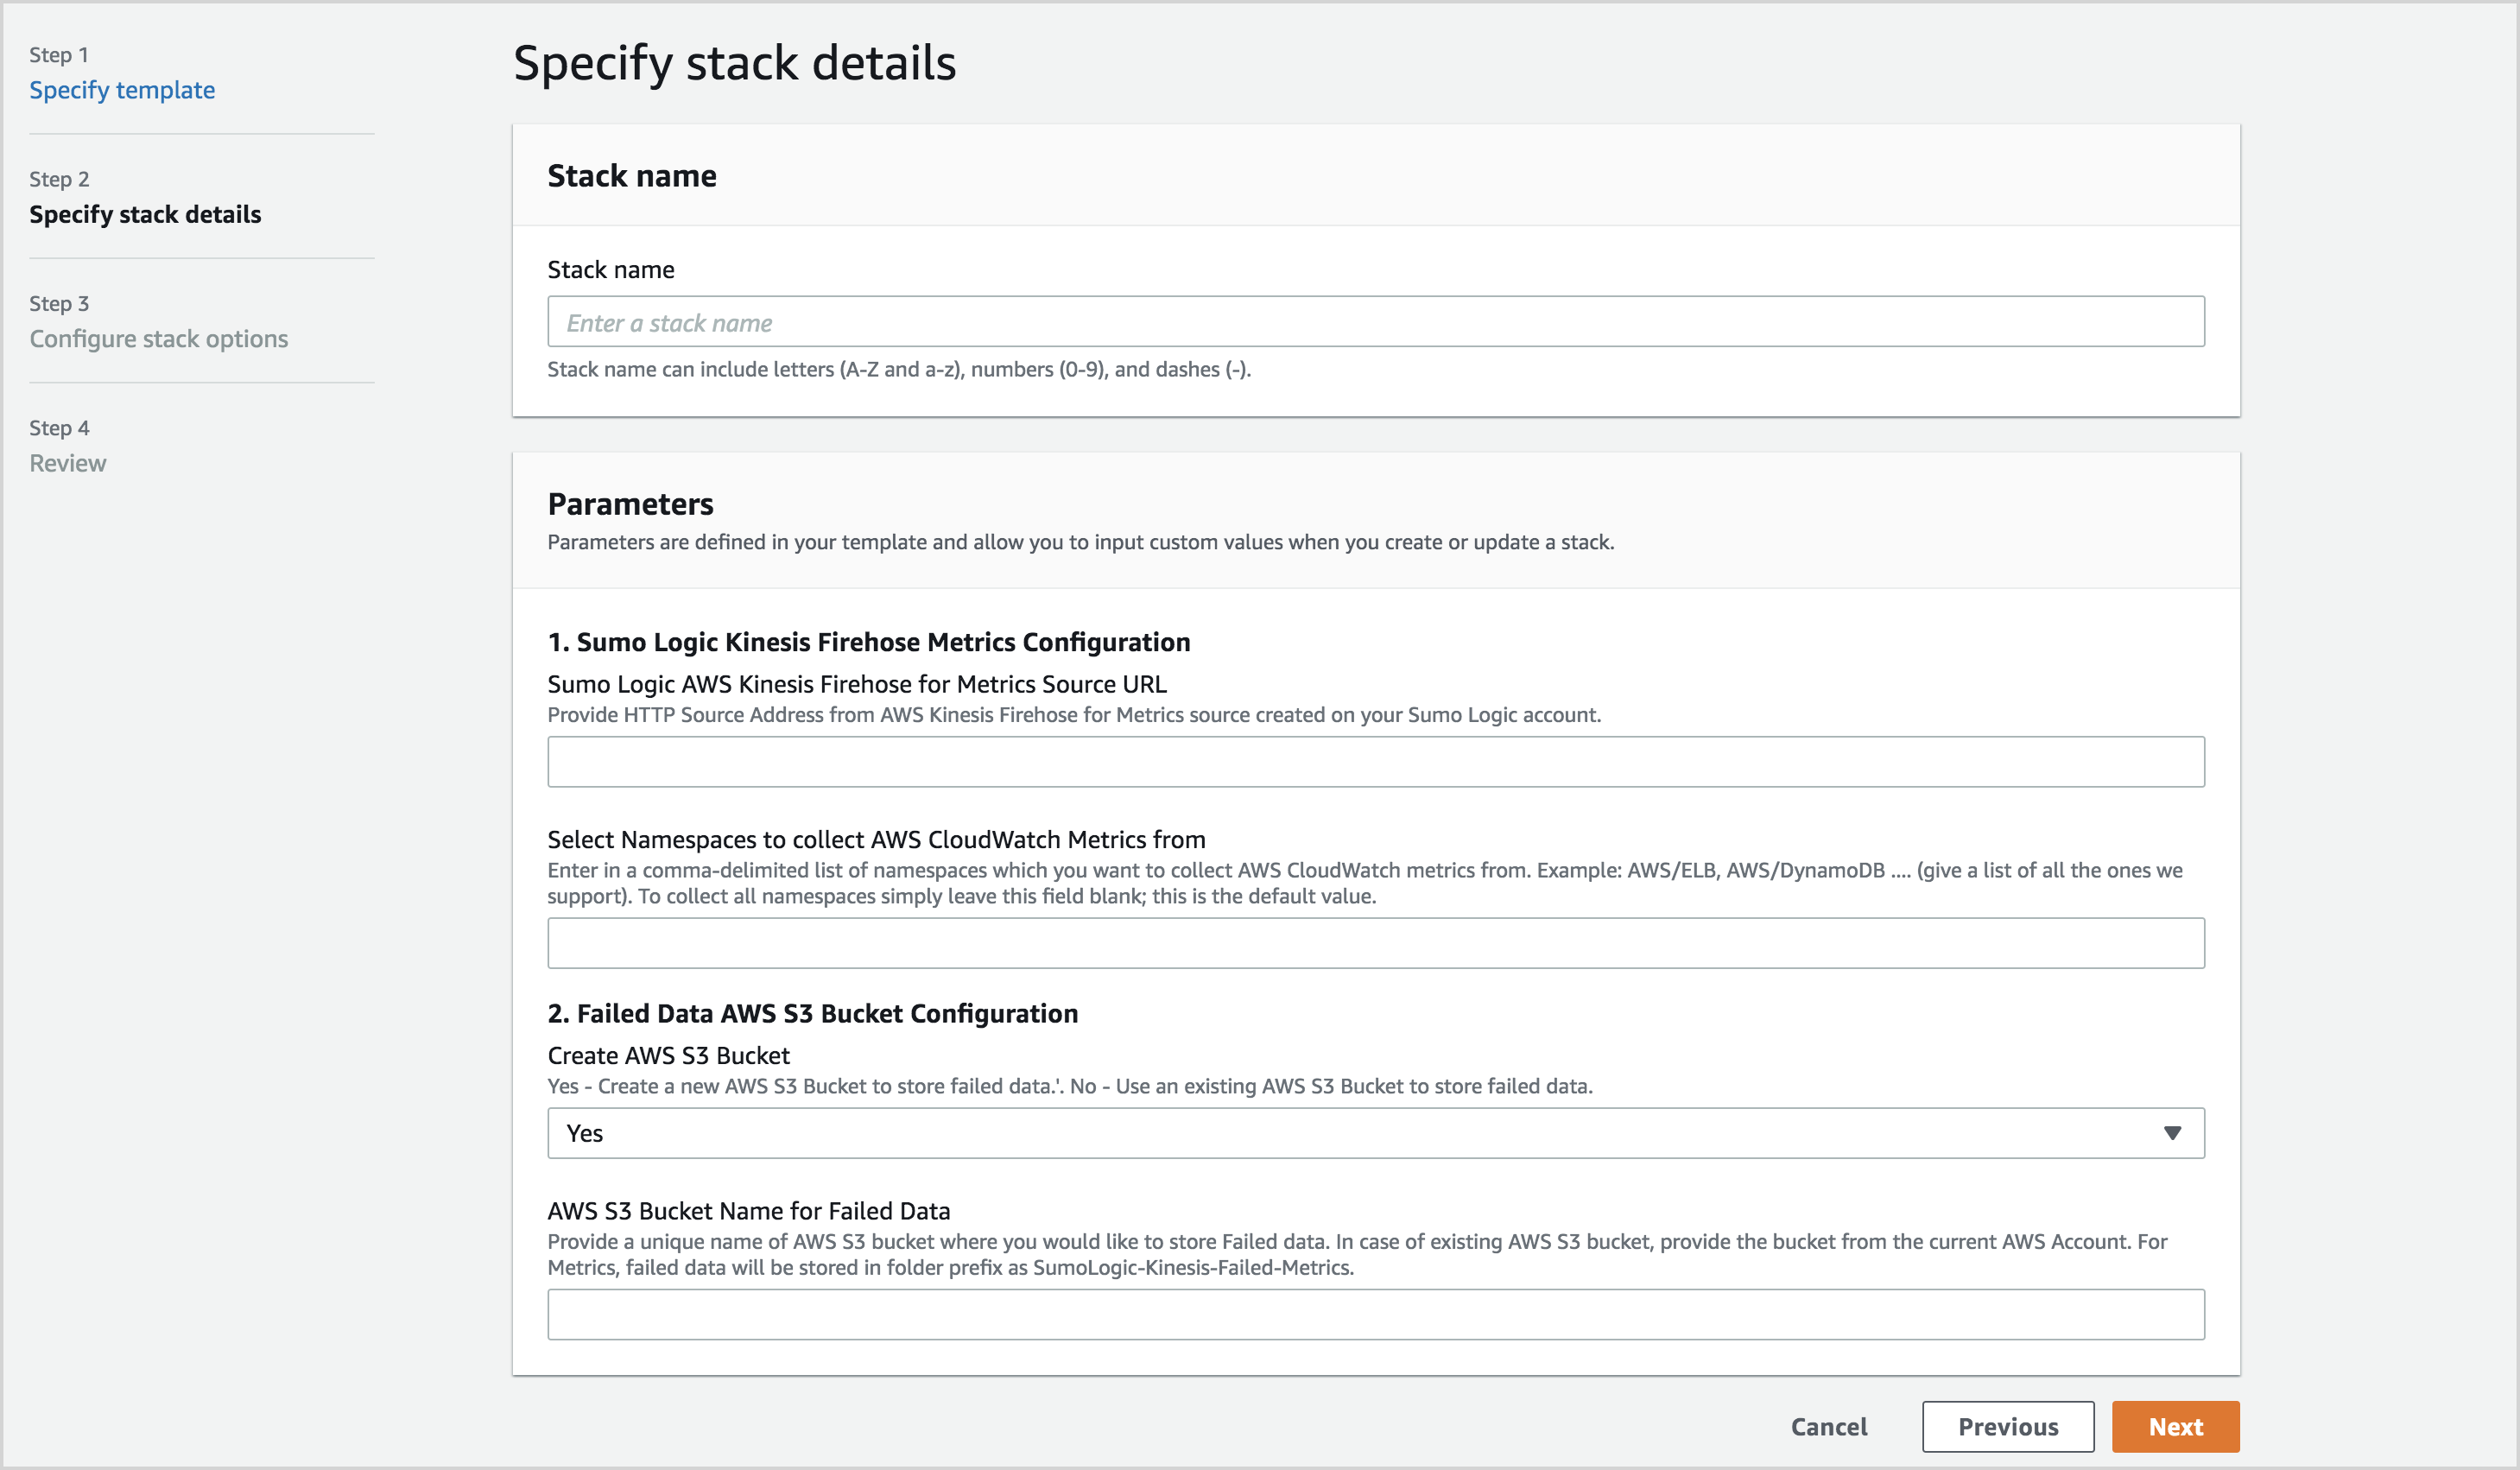
- On the Specify stack details page:
- Stack name. Enter a name for the stack.
- Sumo Logic Kinesis Firehose Metrics Configuration. (Required) Enter the URL of the AWS Kinesis Firehose for Metrics source.
- Select Namespaces to collect AWS CloudWatch Metrics. Enter a comma-delimited list of the namespaces from which you want to collect AWS CloudWatch metrics.
- Failed Data AWS S3 Bucket Configuration. Enter Yes to create a new bucket, or "No" if you want to use an existing bucket.
- AWS S3 Bucket Name for Failed Data. Provide the name of Amazon S3 bucket to create, or the name of an existing bucket in the current AWS Account.
- Click Next.
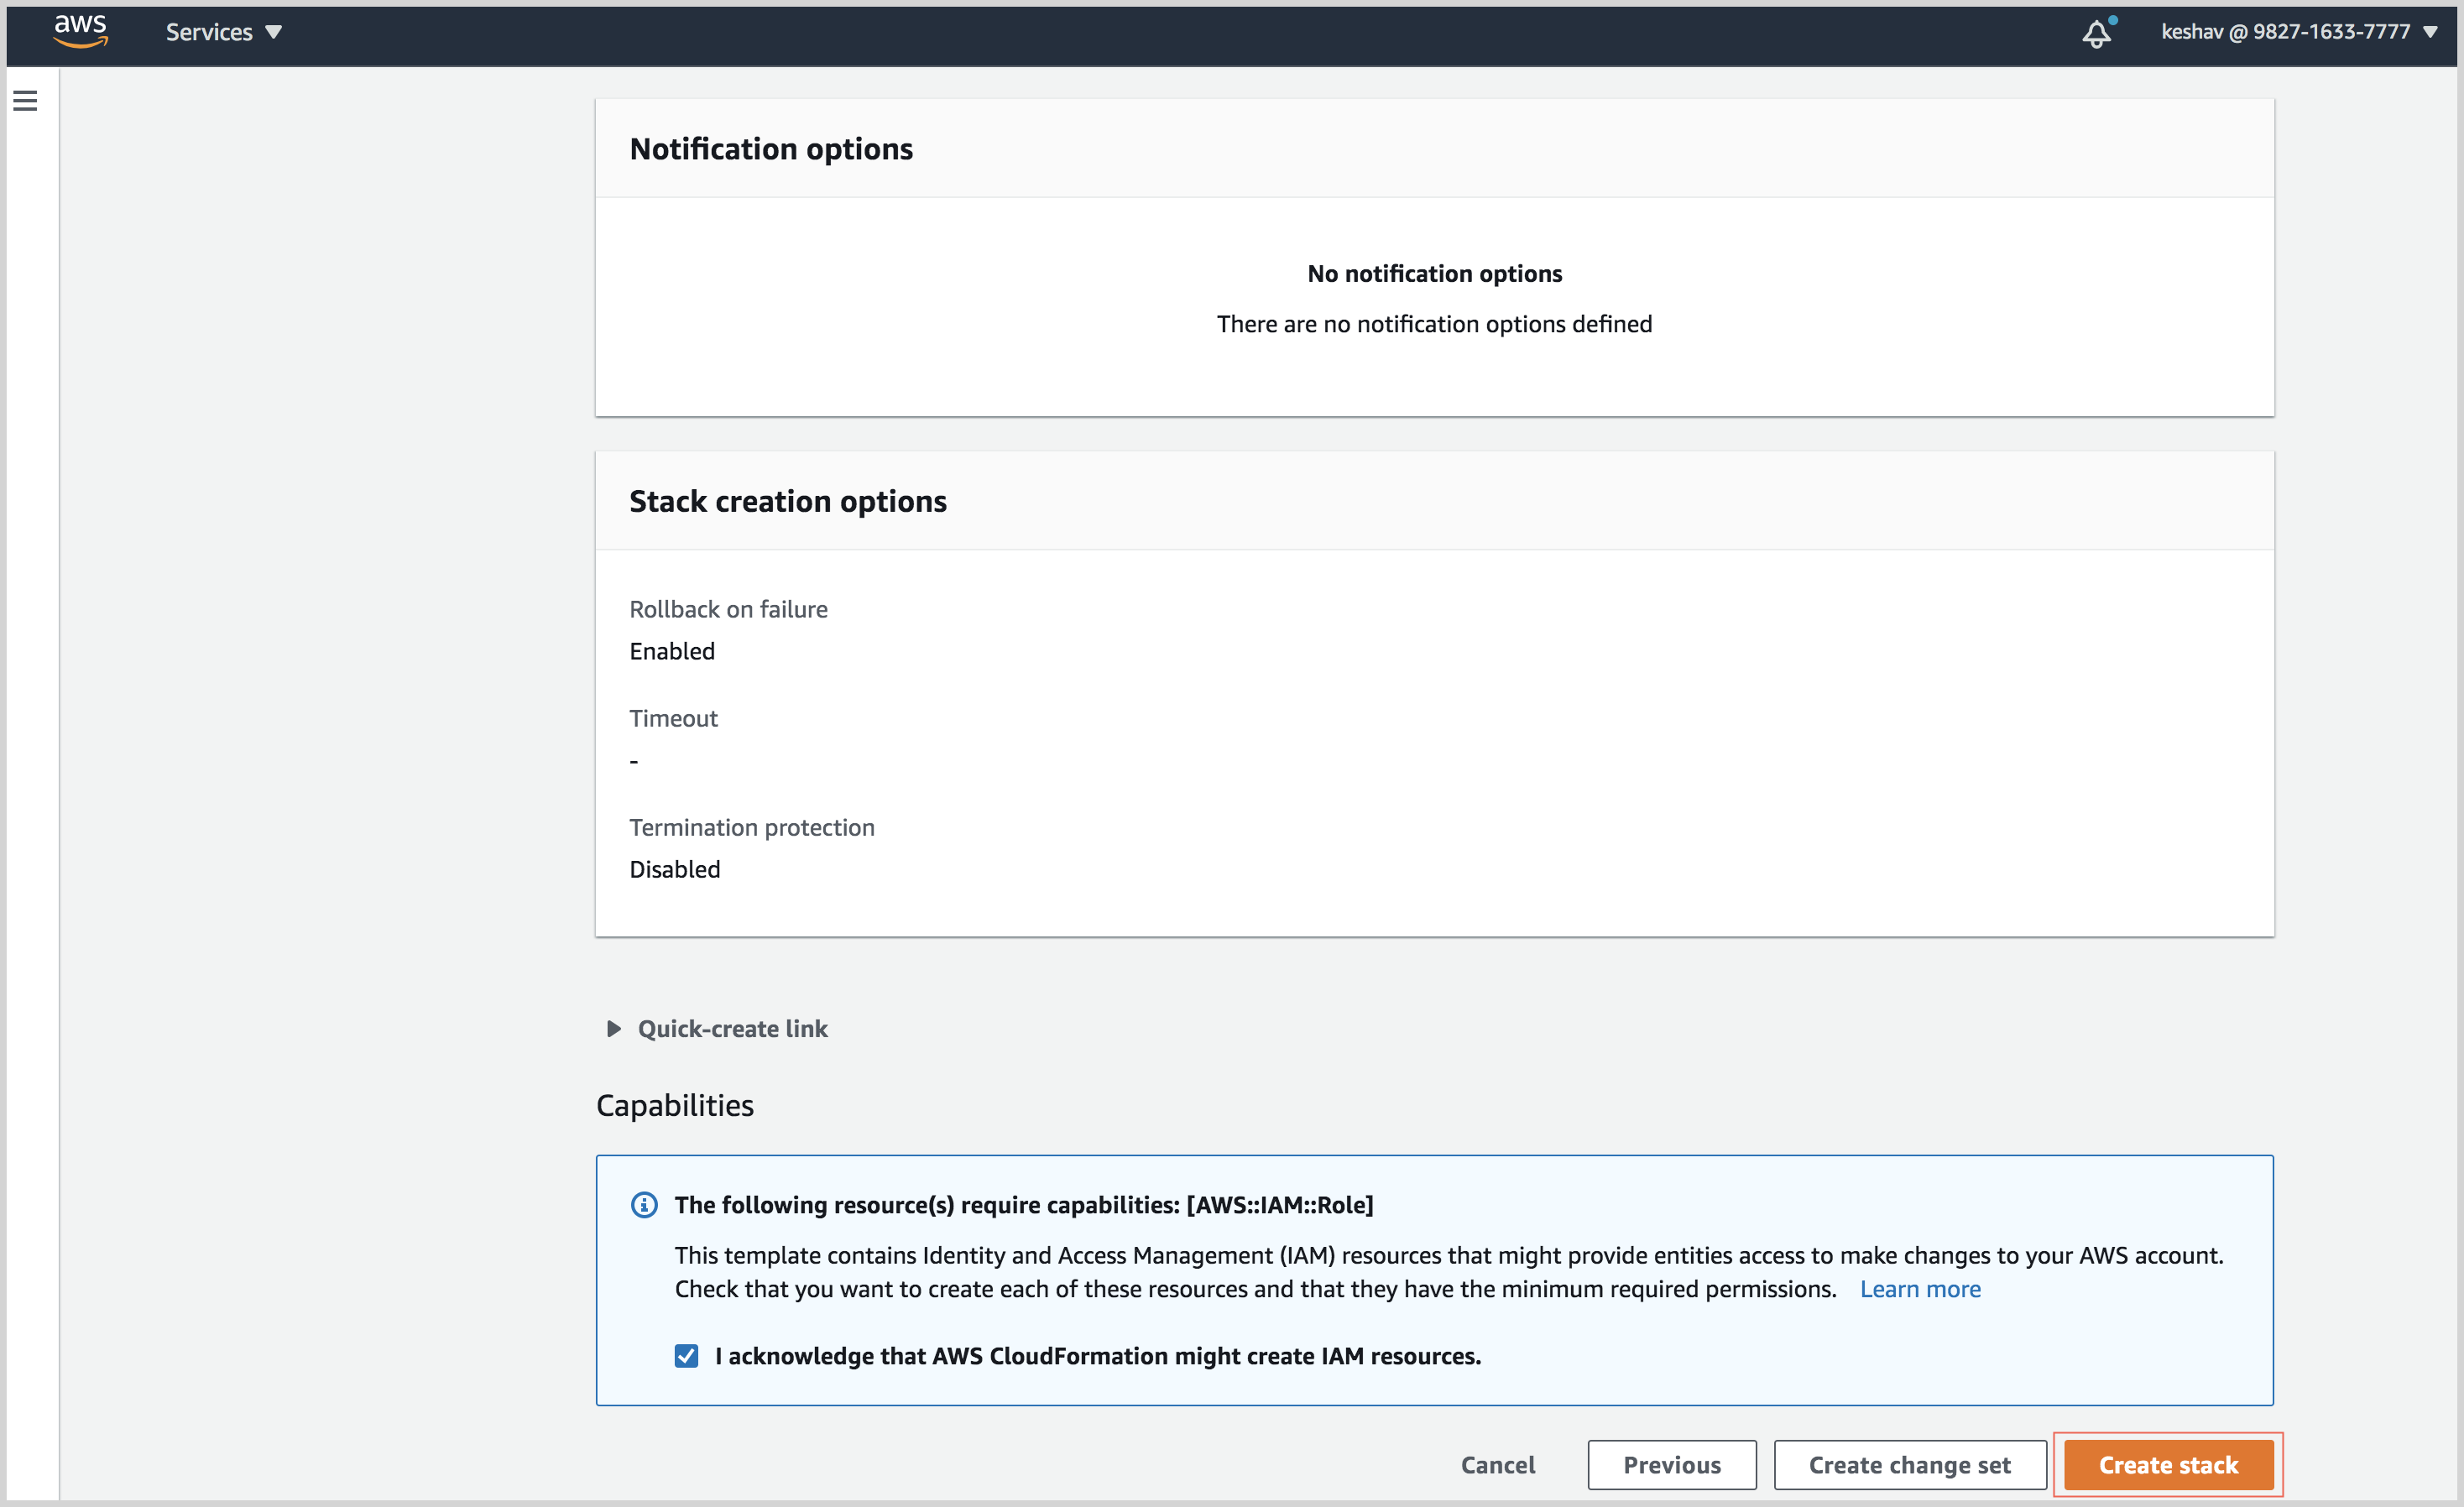
- Click Create stack.
- The AWS console displays the resources in the newly created stack.
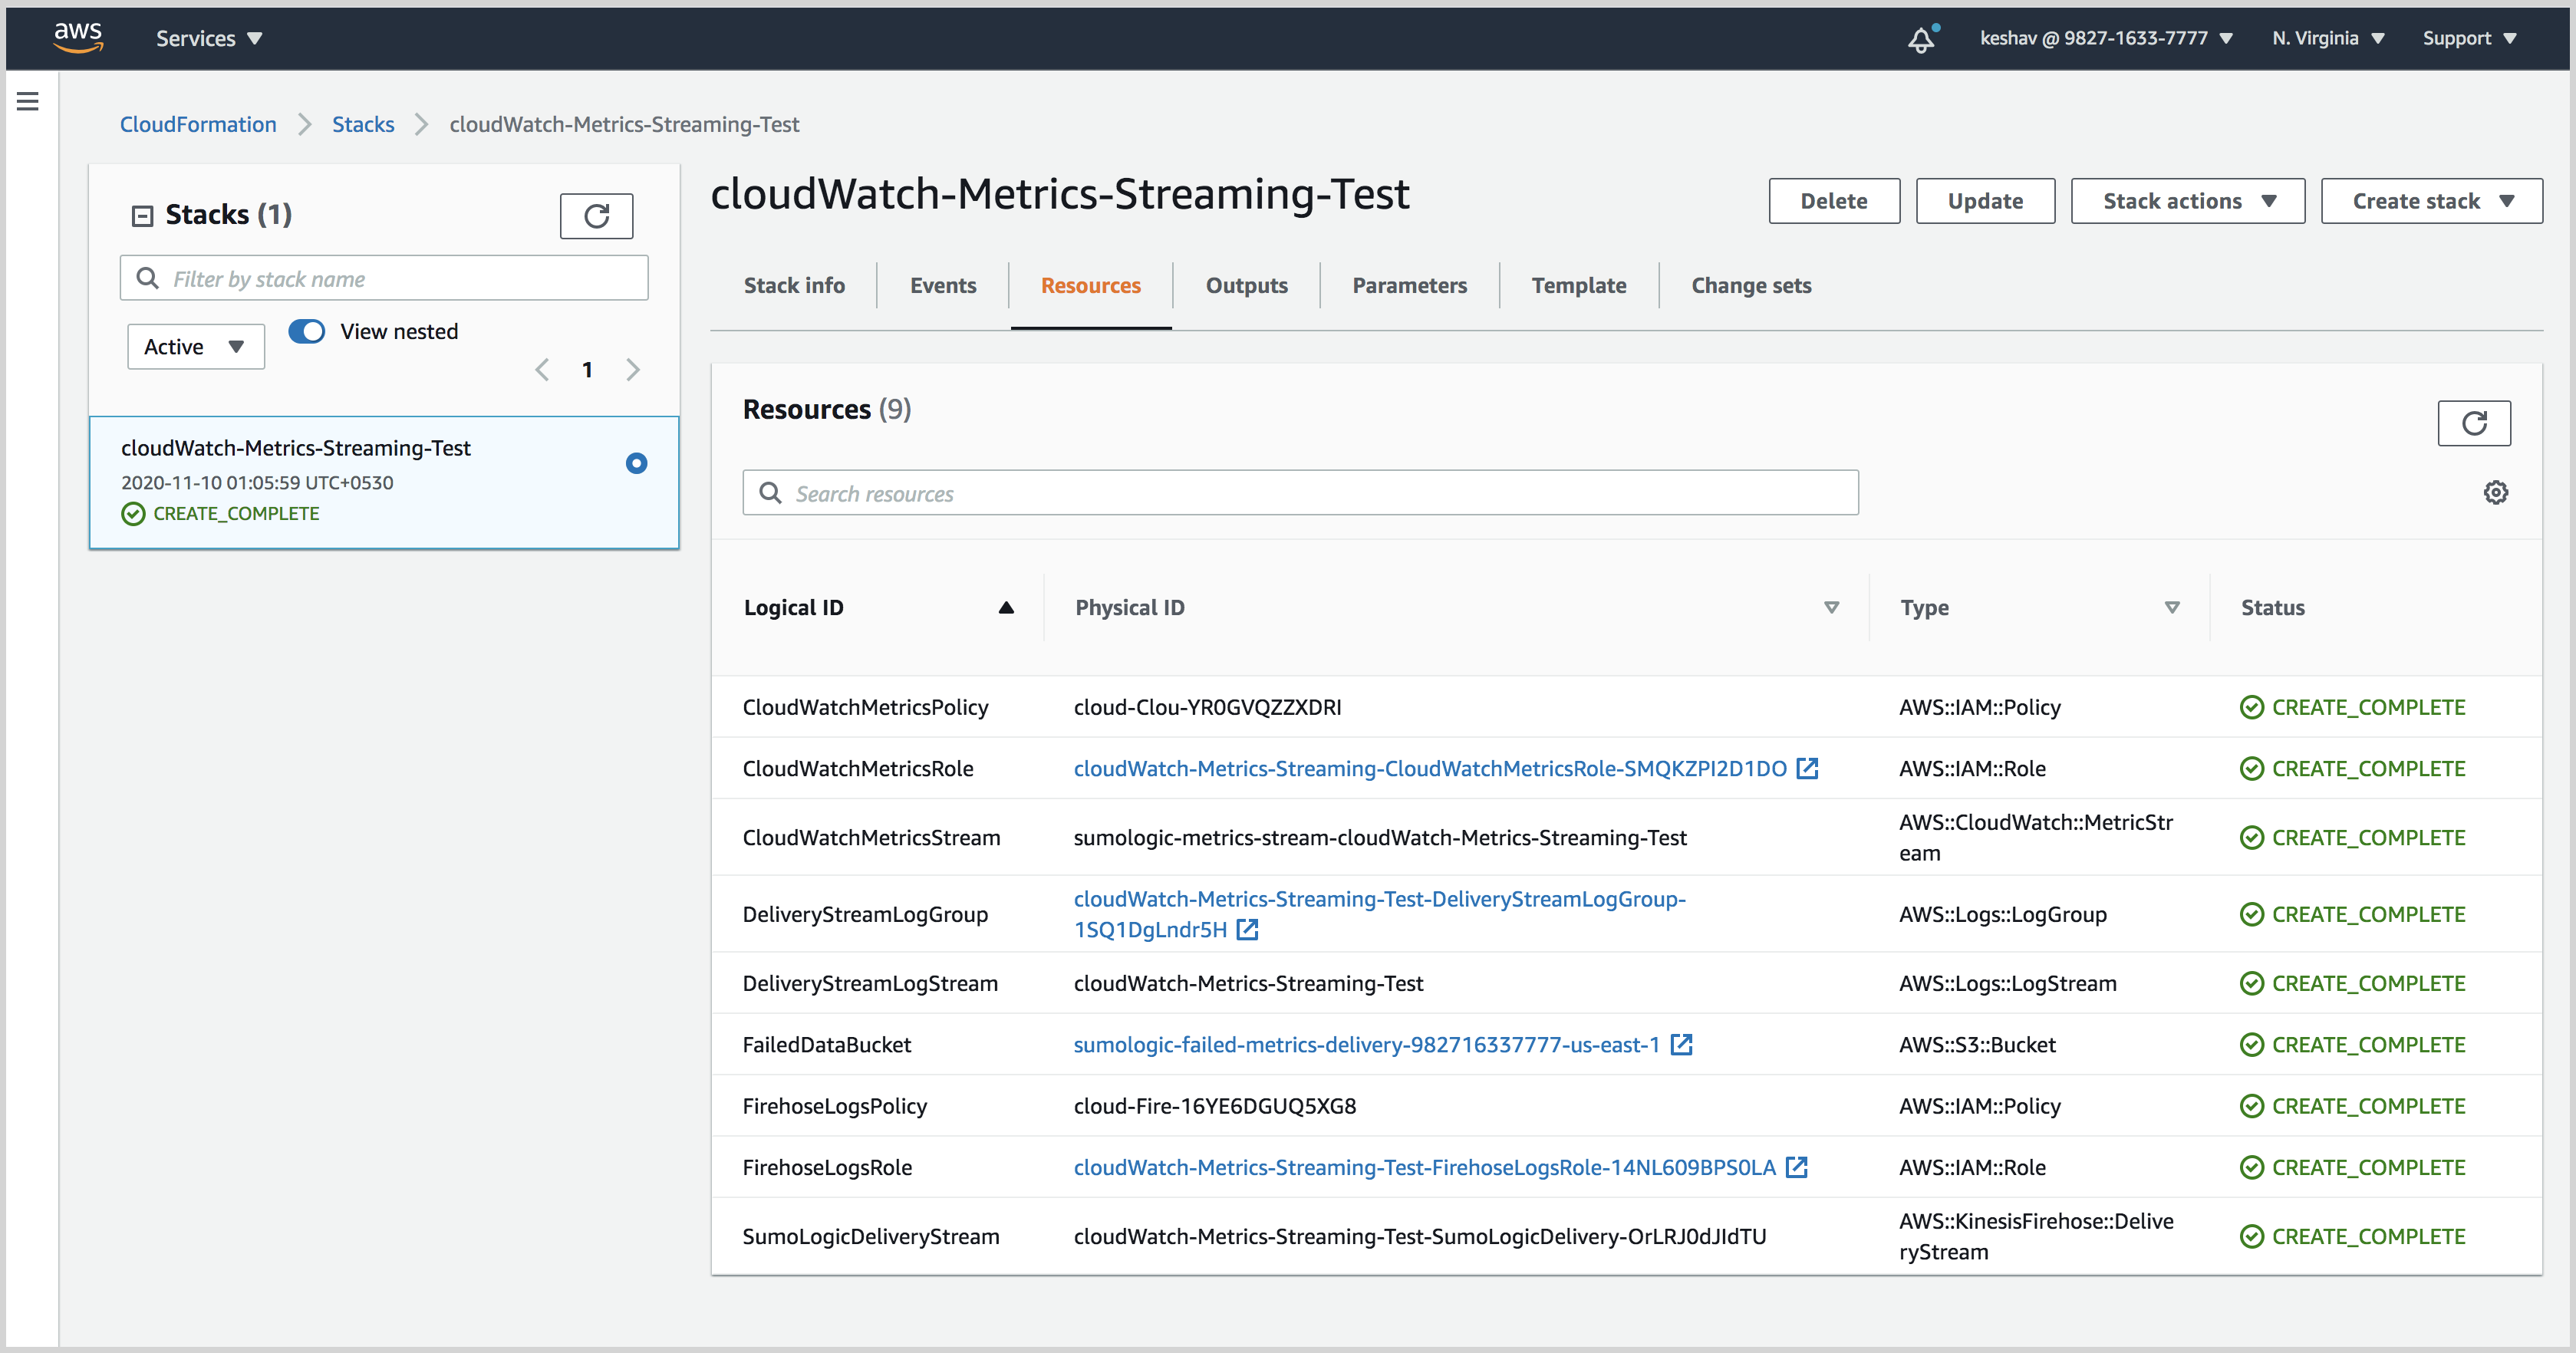
Filter CloudWatch metrics during ingestion
You can choose metrics to send or not send to Sumo Logic by setting filters on the Metric Stream that sends the metrics or by using AWS Tag Filters above. While using filters on Metrics Streams in AWS, you can filter by AWS namespace, either by specifying namespaces from which you want to collect metrics from, or namespaces from which you don’t. Once you configure namespaces to include or exclude, CloudWatch will only send metrics that match the rules.
Inclusive and exclusive filters can’t be combined. You can choose namespaces to exclude or namespaces to include, but not both.
Include metrics by namespace
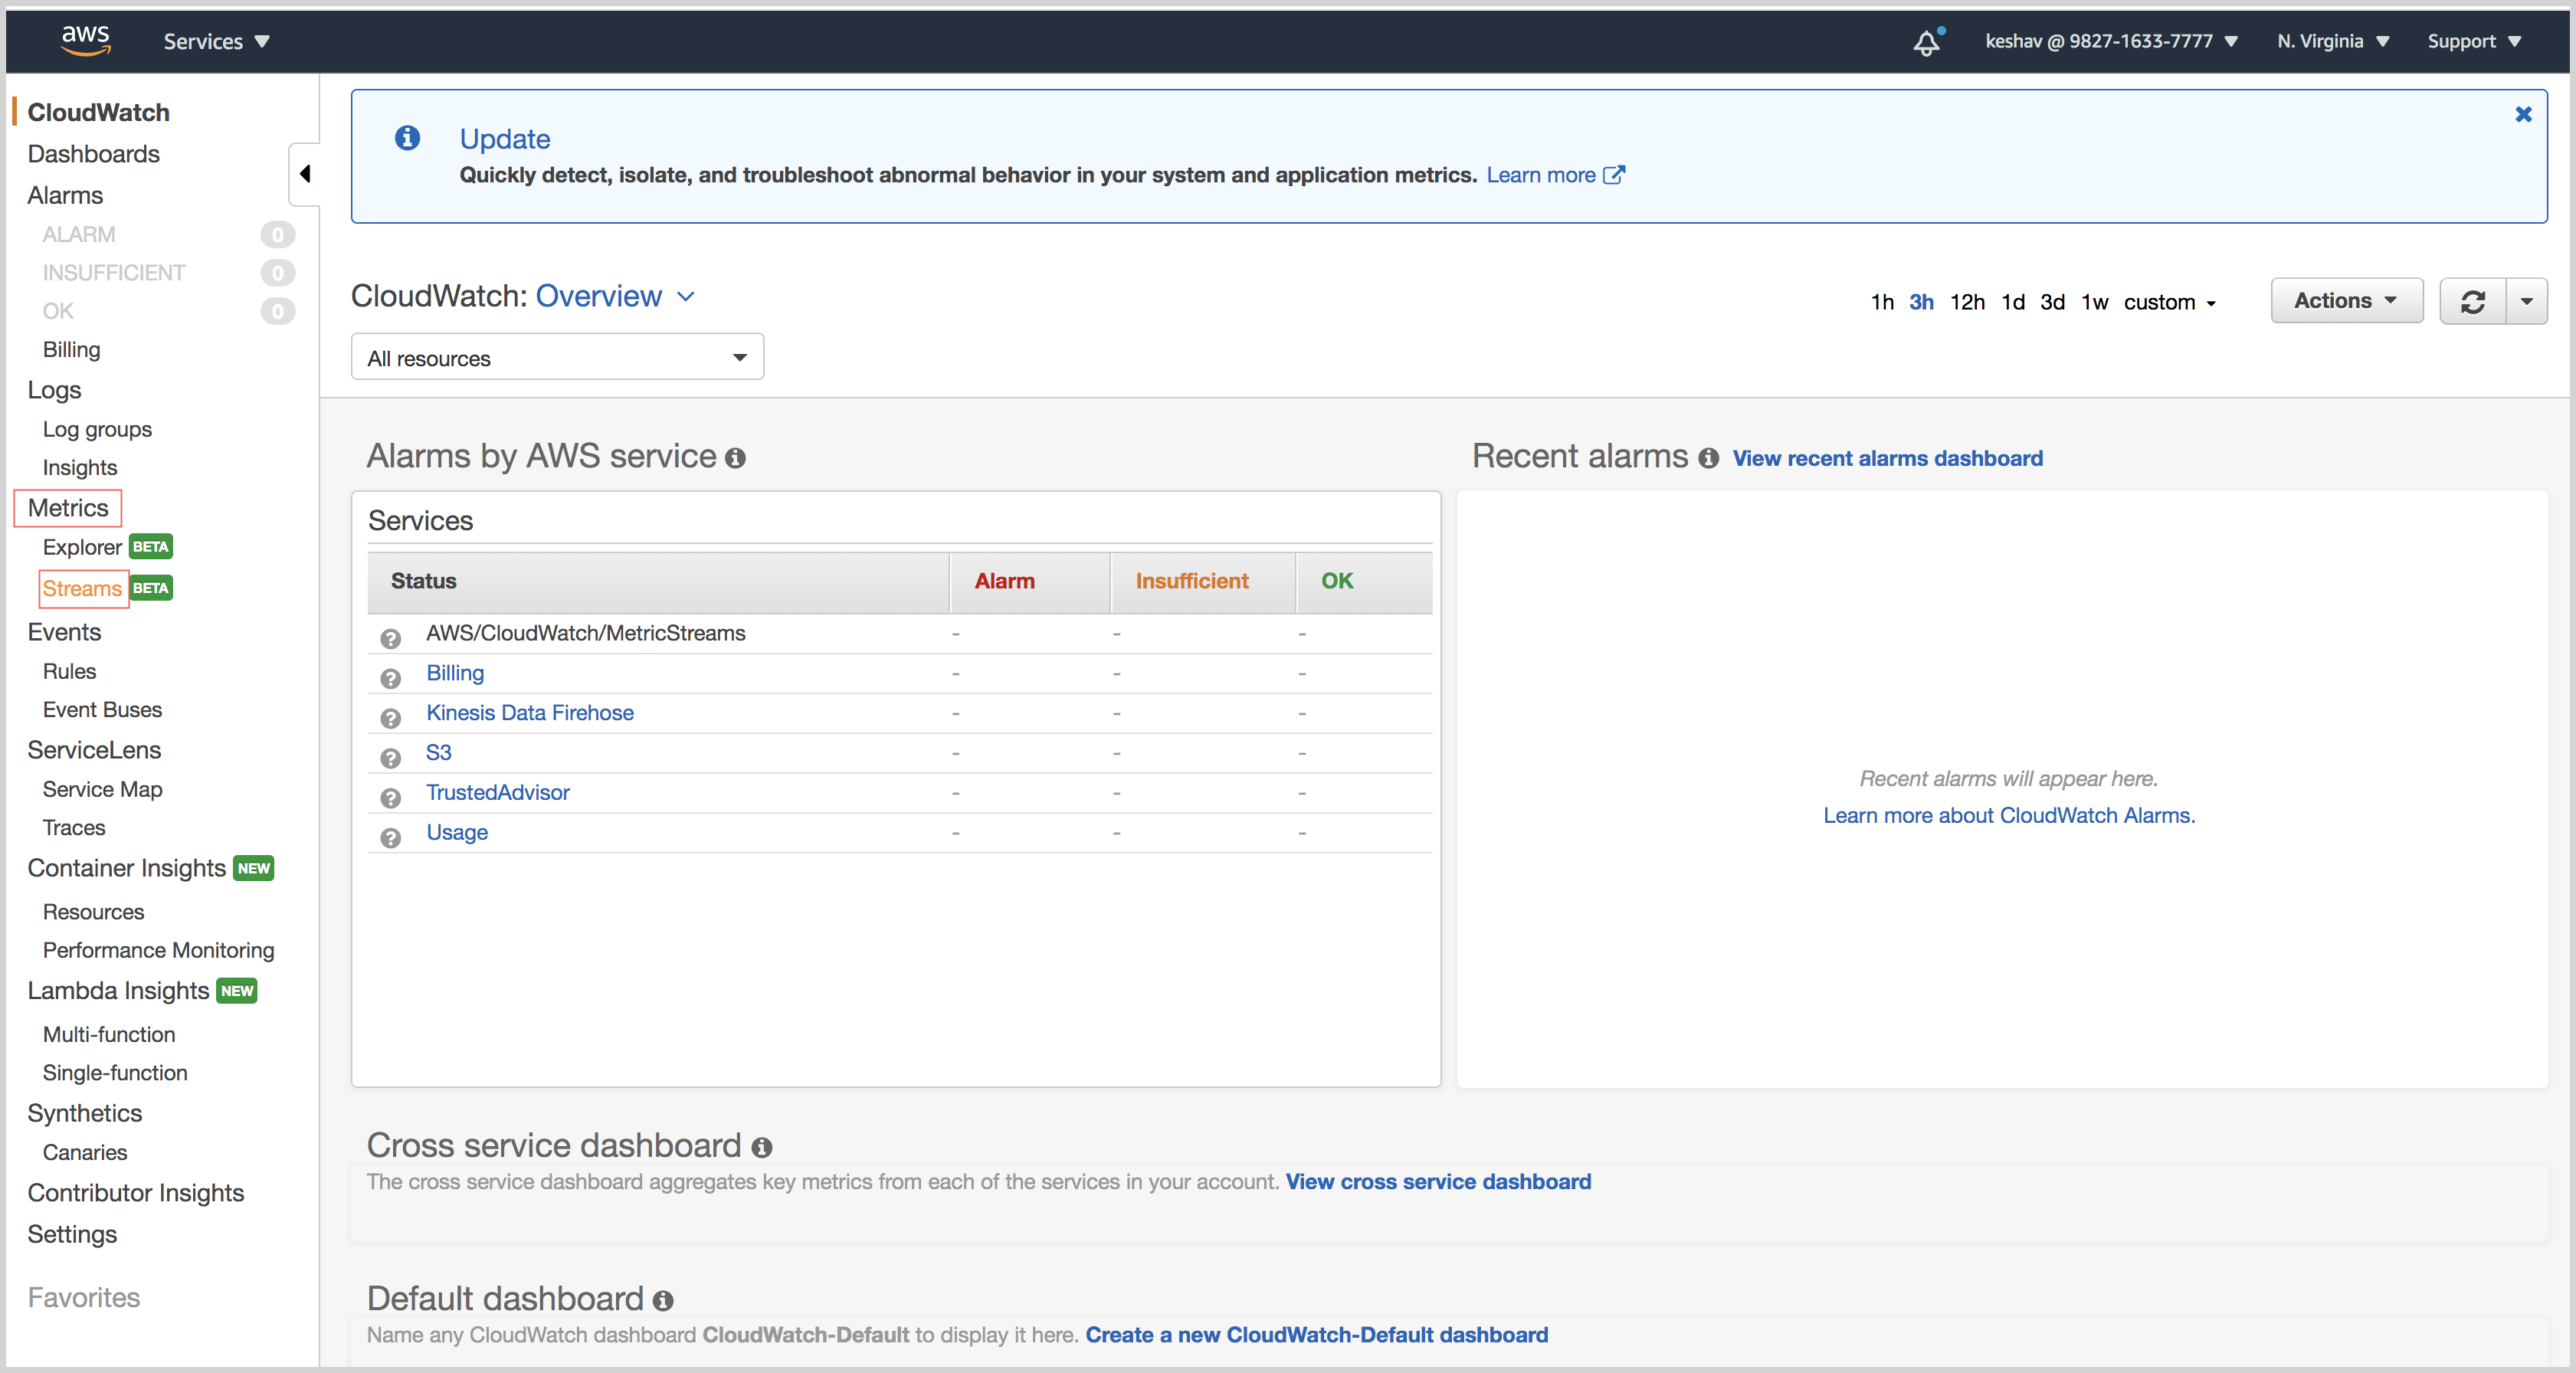
- Open the CloudWatch console.
- In the navigation pane, choose Metrics.
- Under Metrics, select Streams.
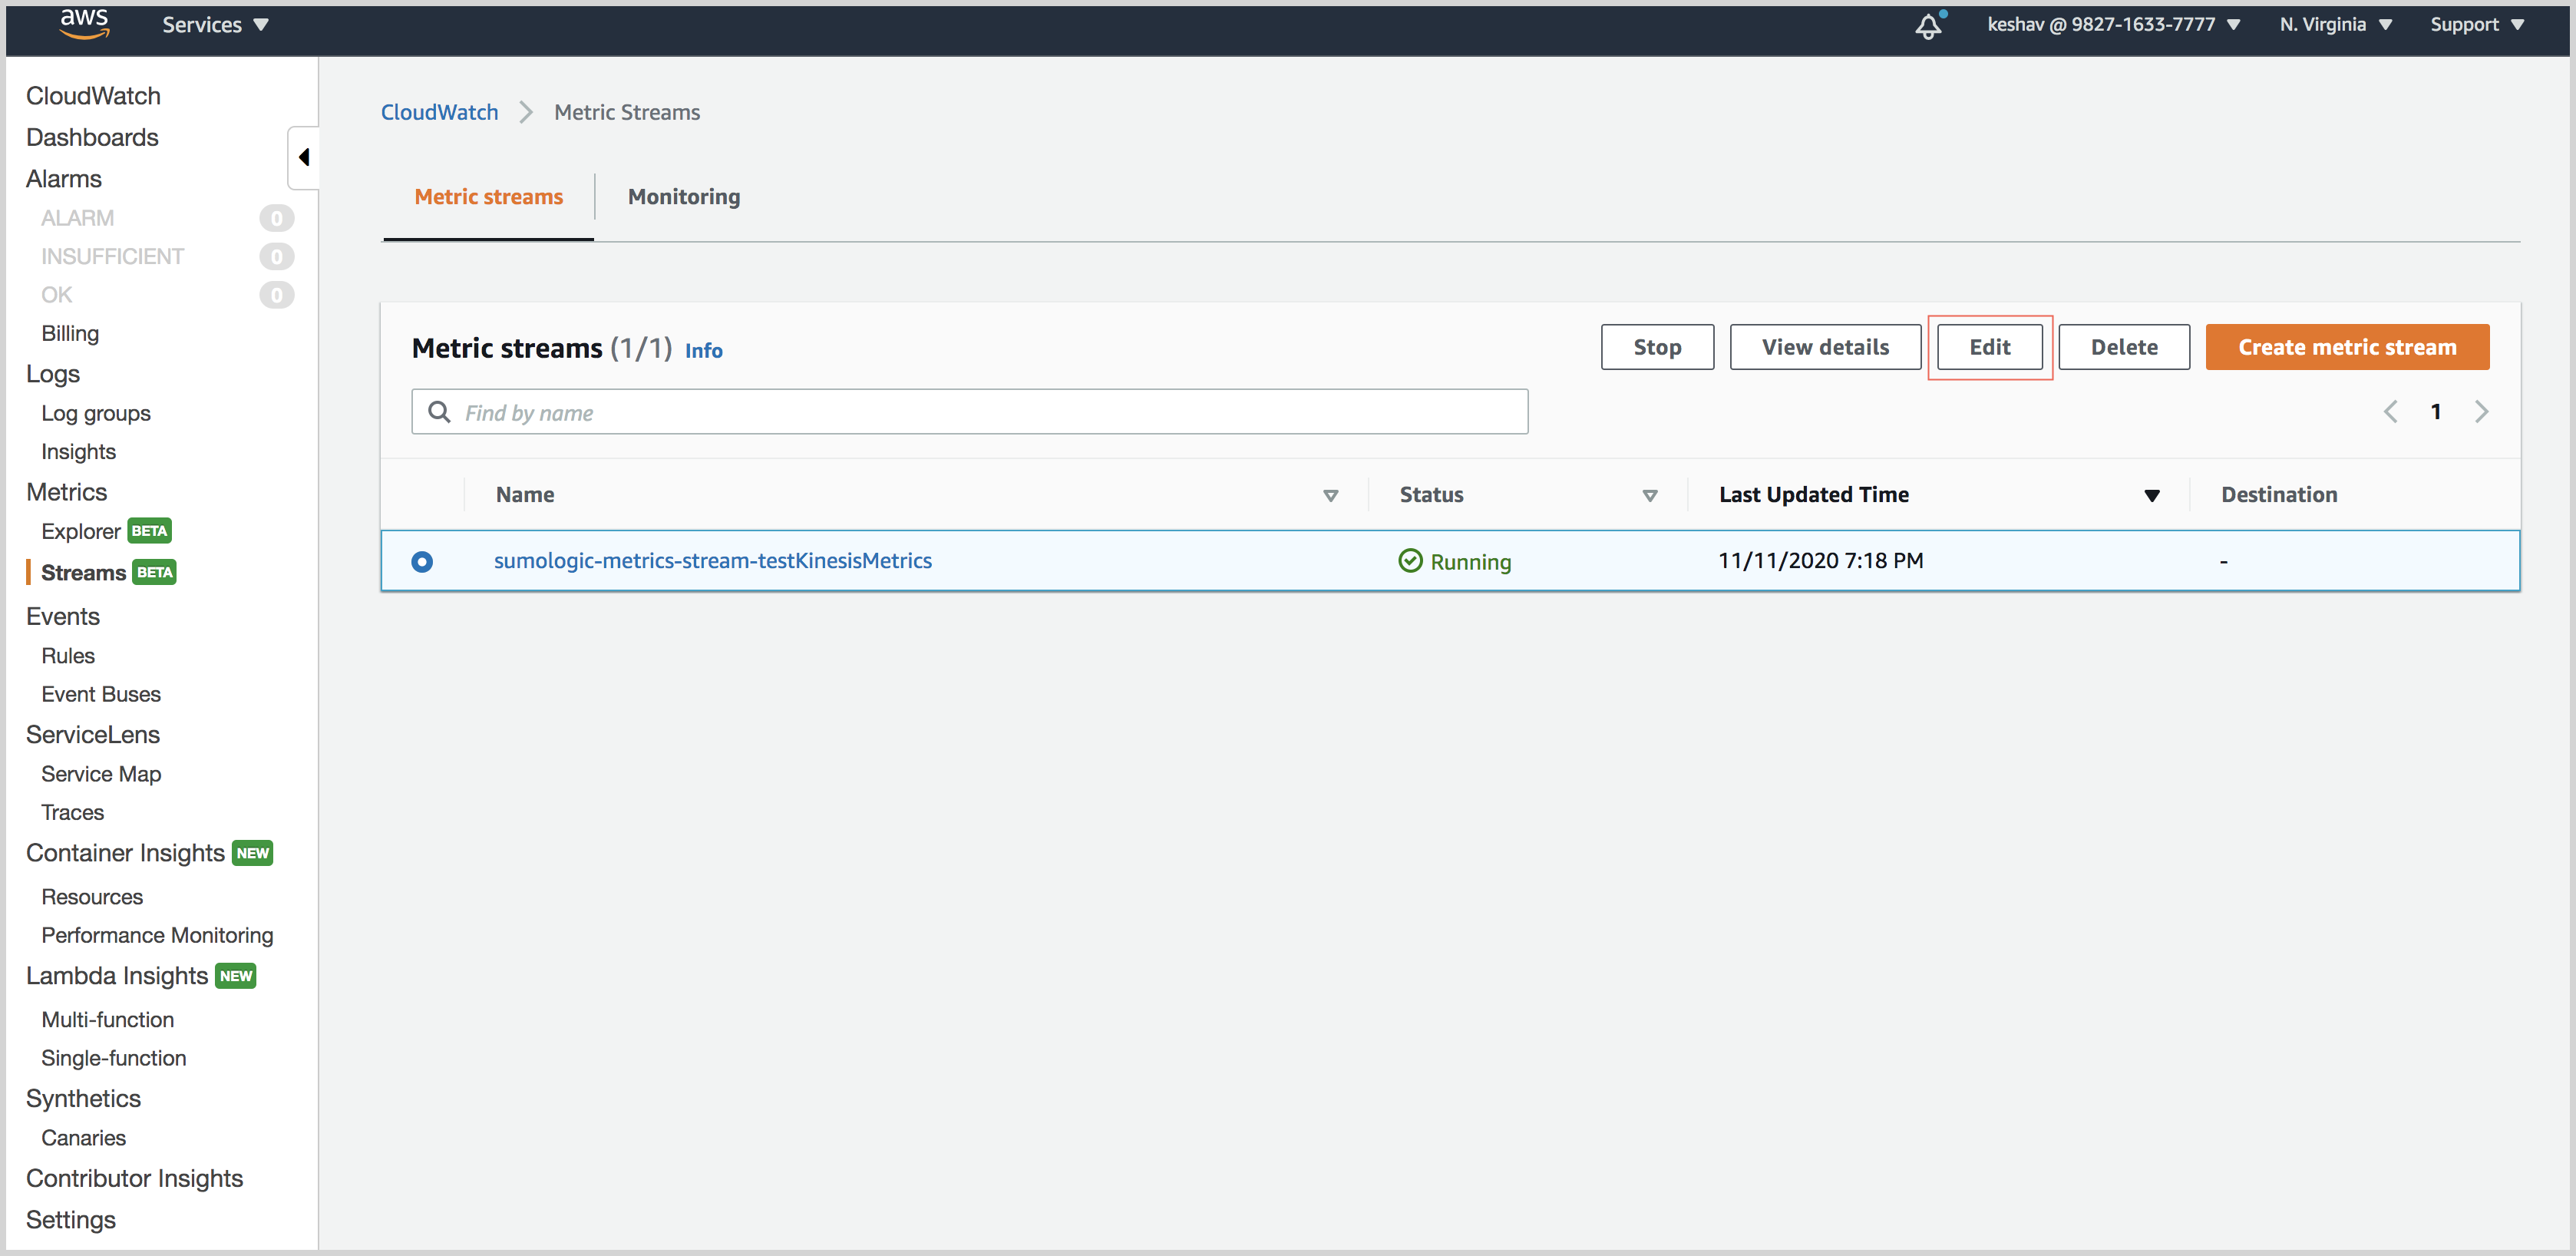
- Select the metric stream and click Edit.
- Click Selected namespaces.
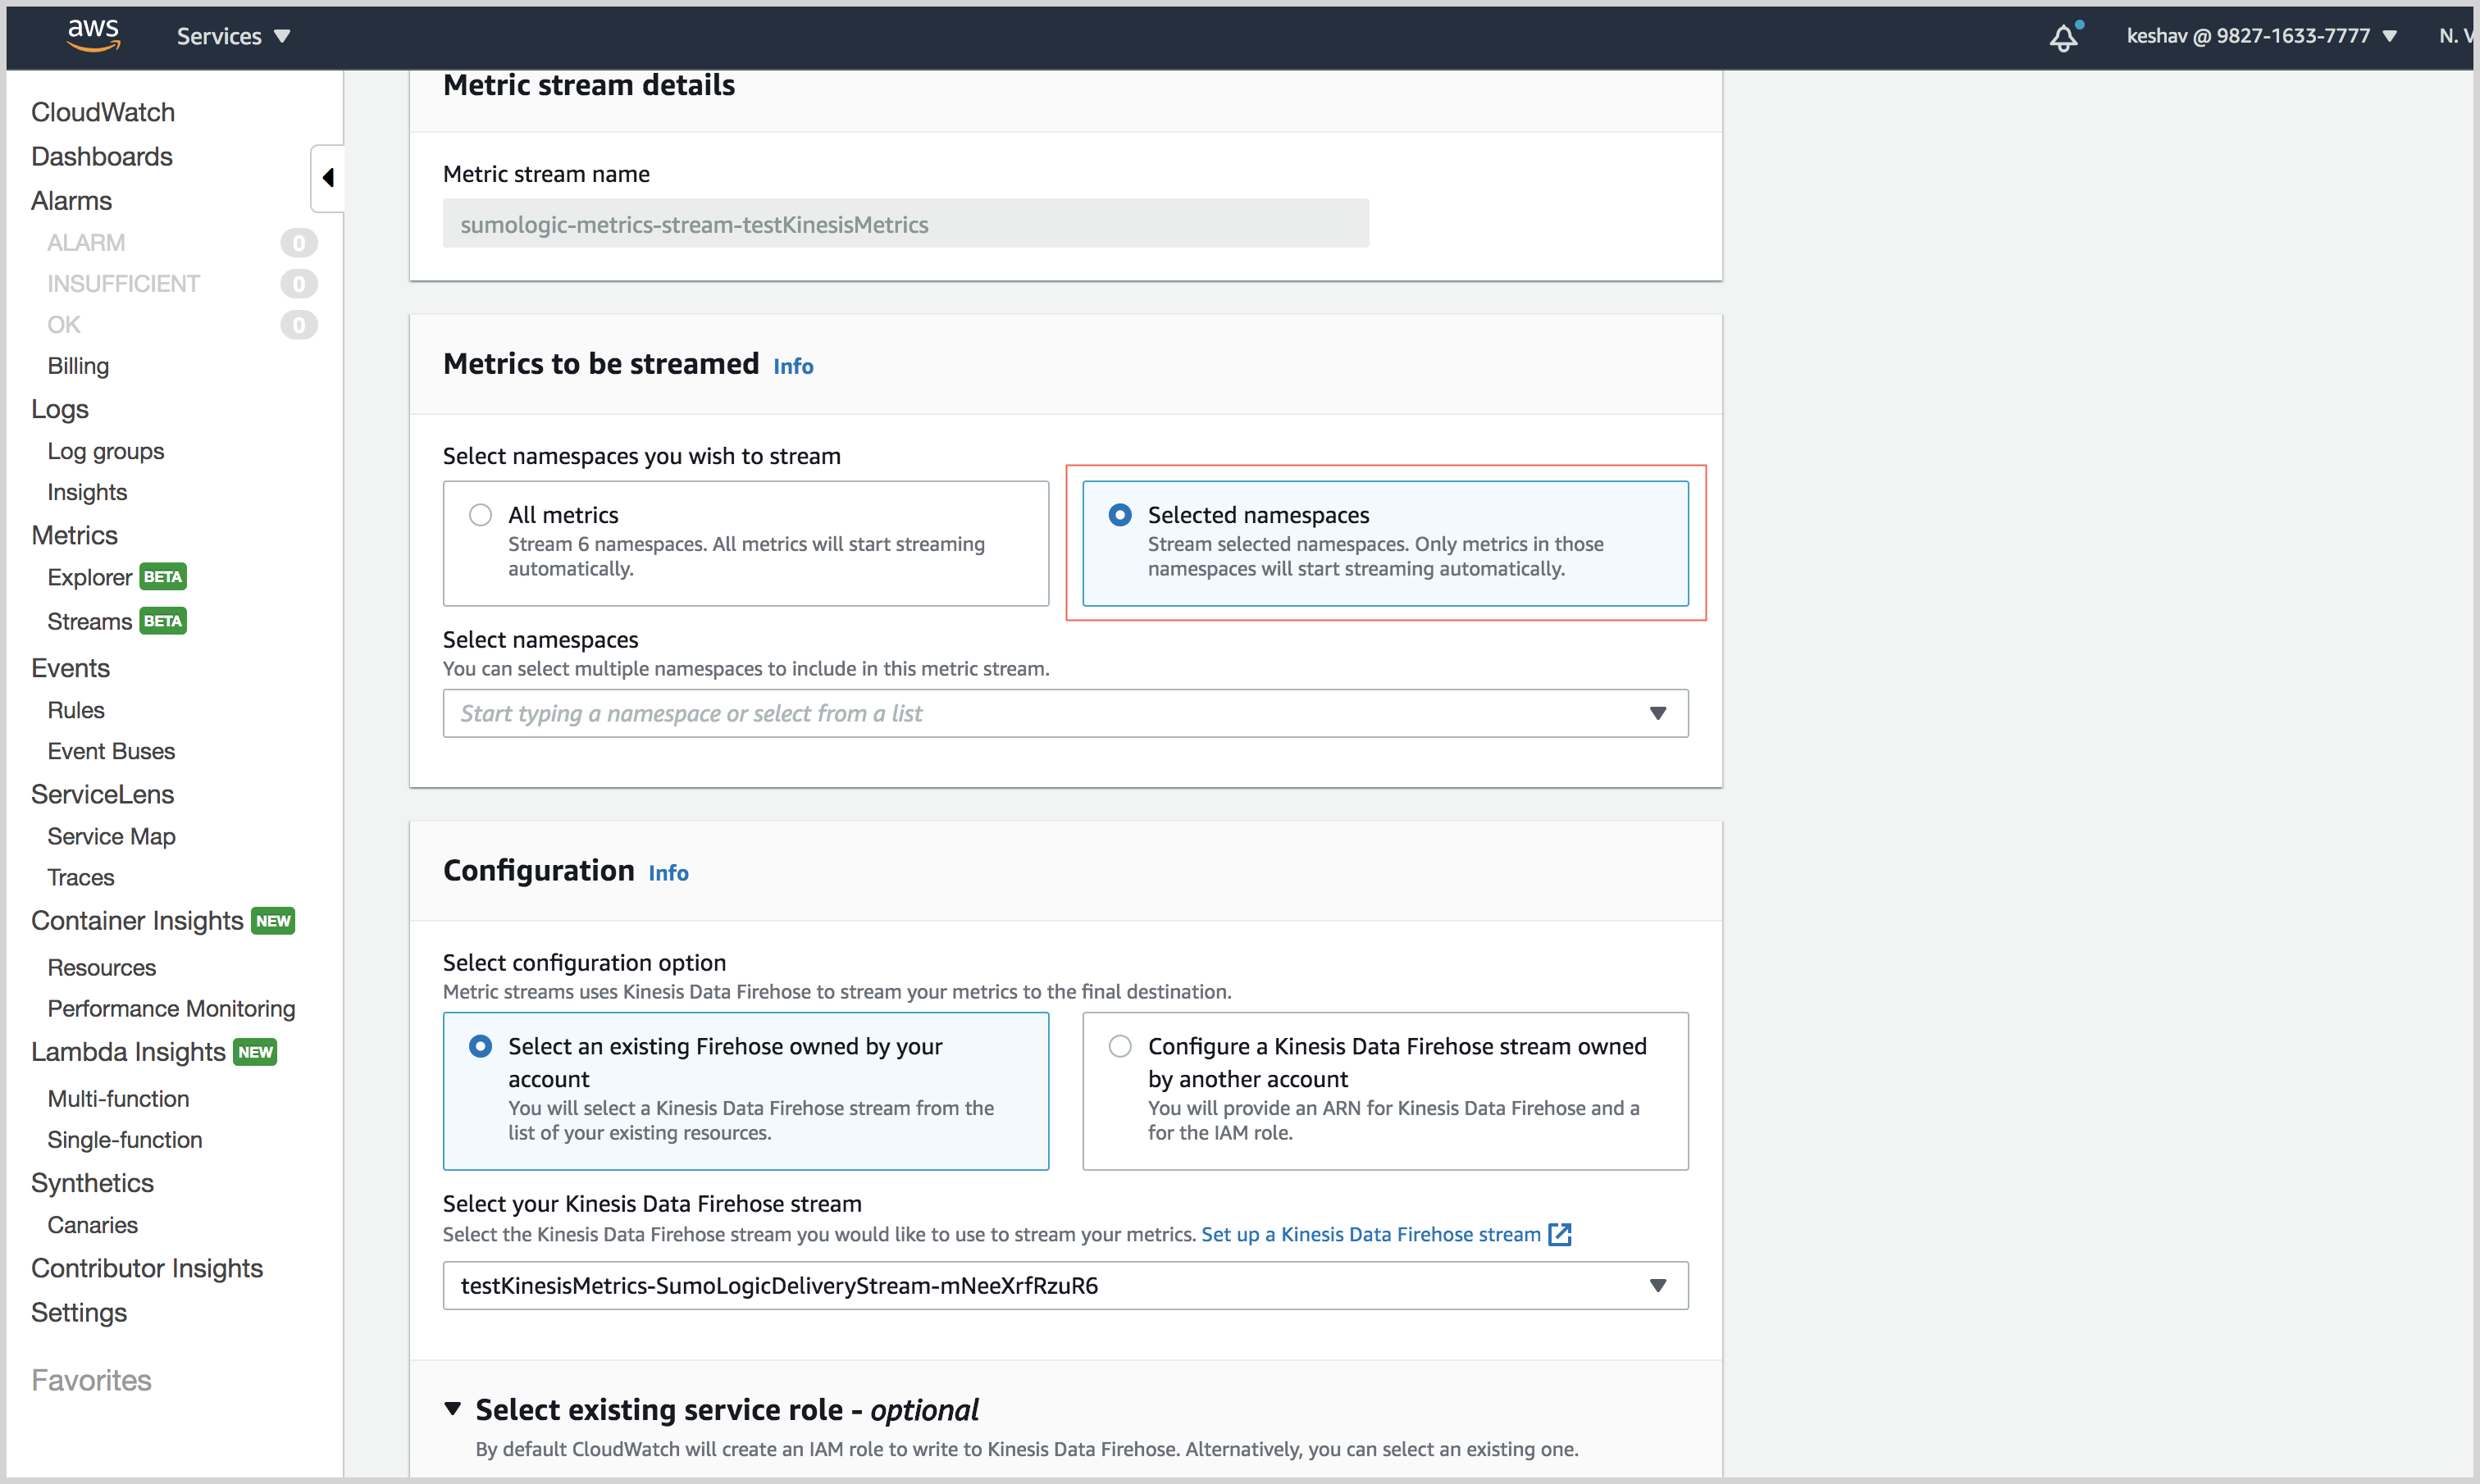
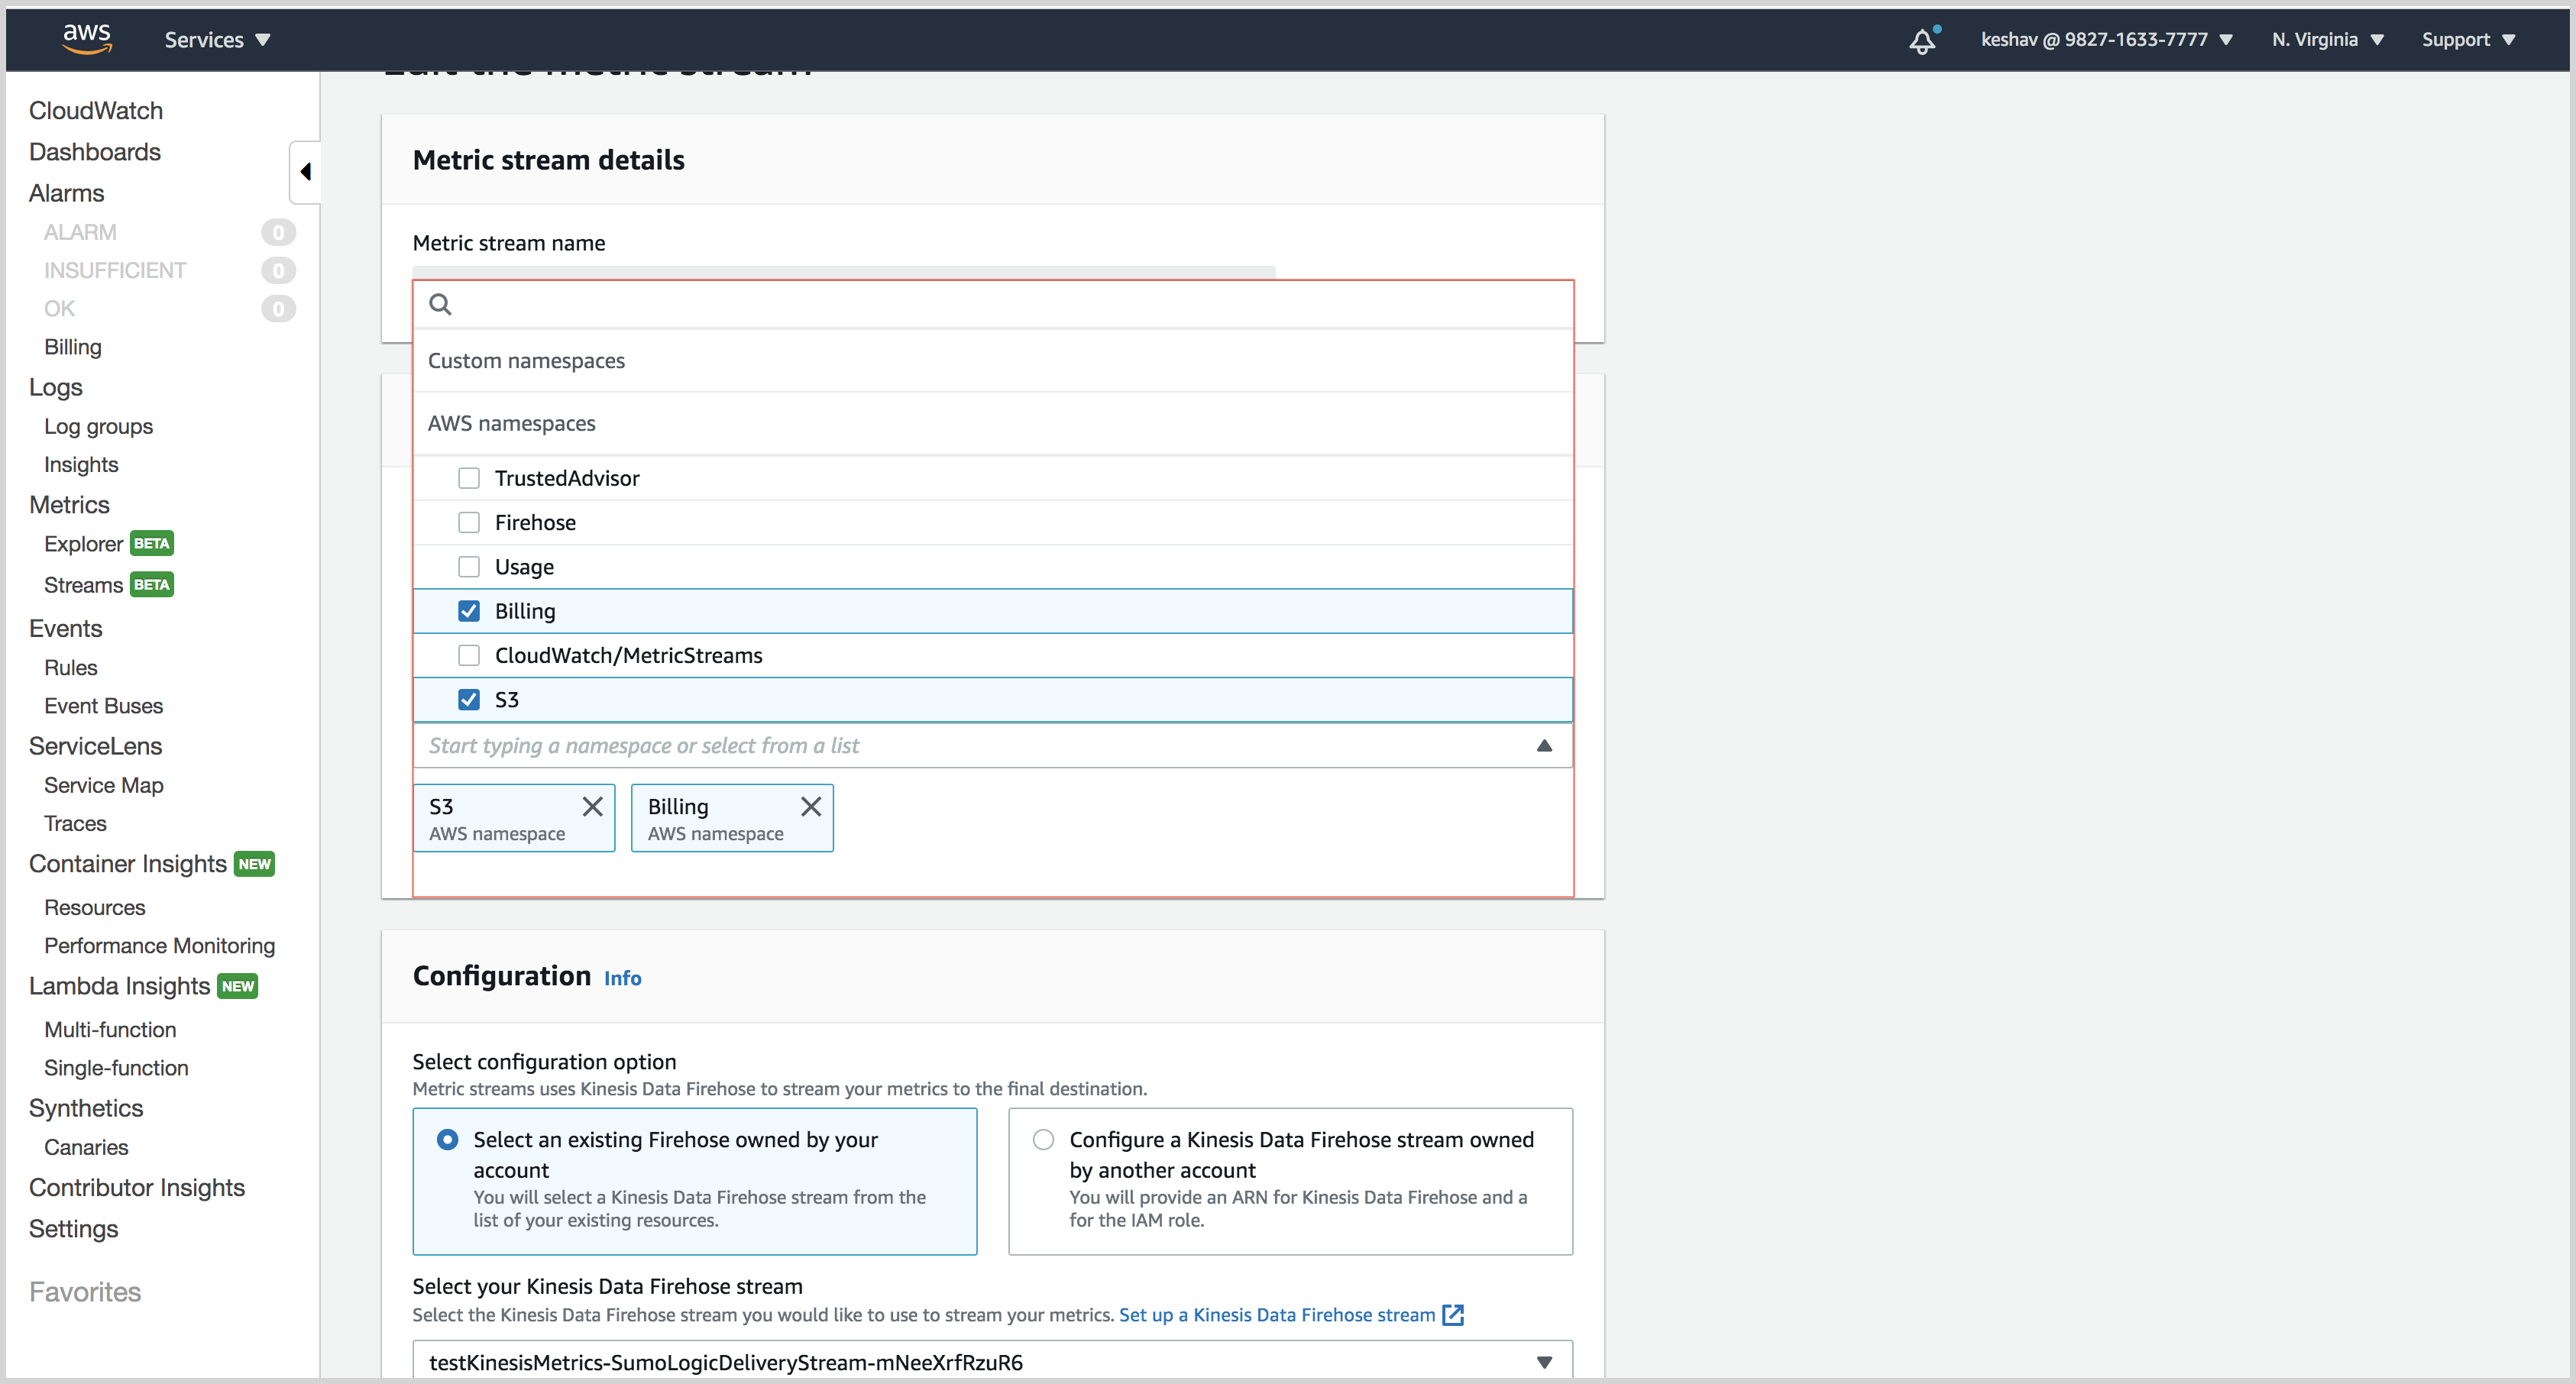
- From the list of AWS namespaces, select the namespaces whose metrics you want to receive. In the screenshot below “S3” and “Billing” are selected.
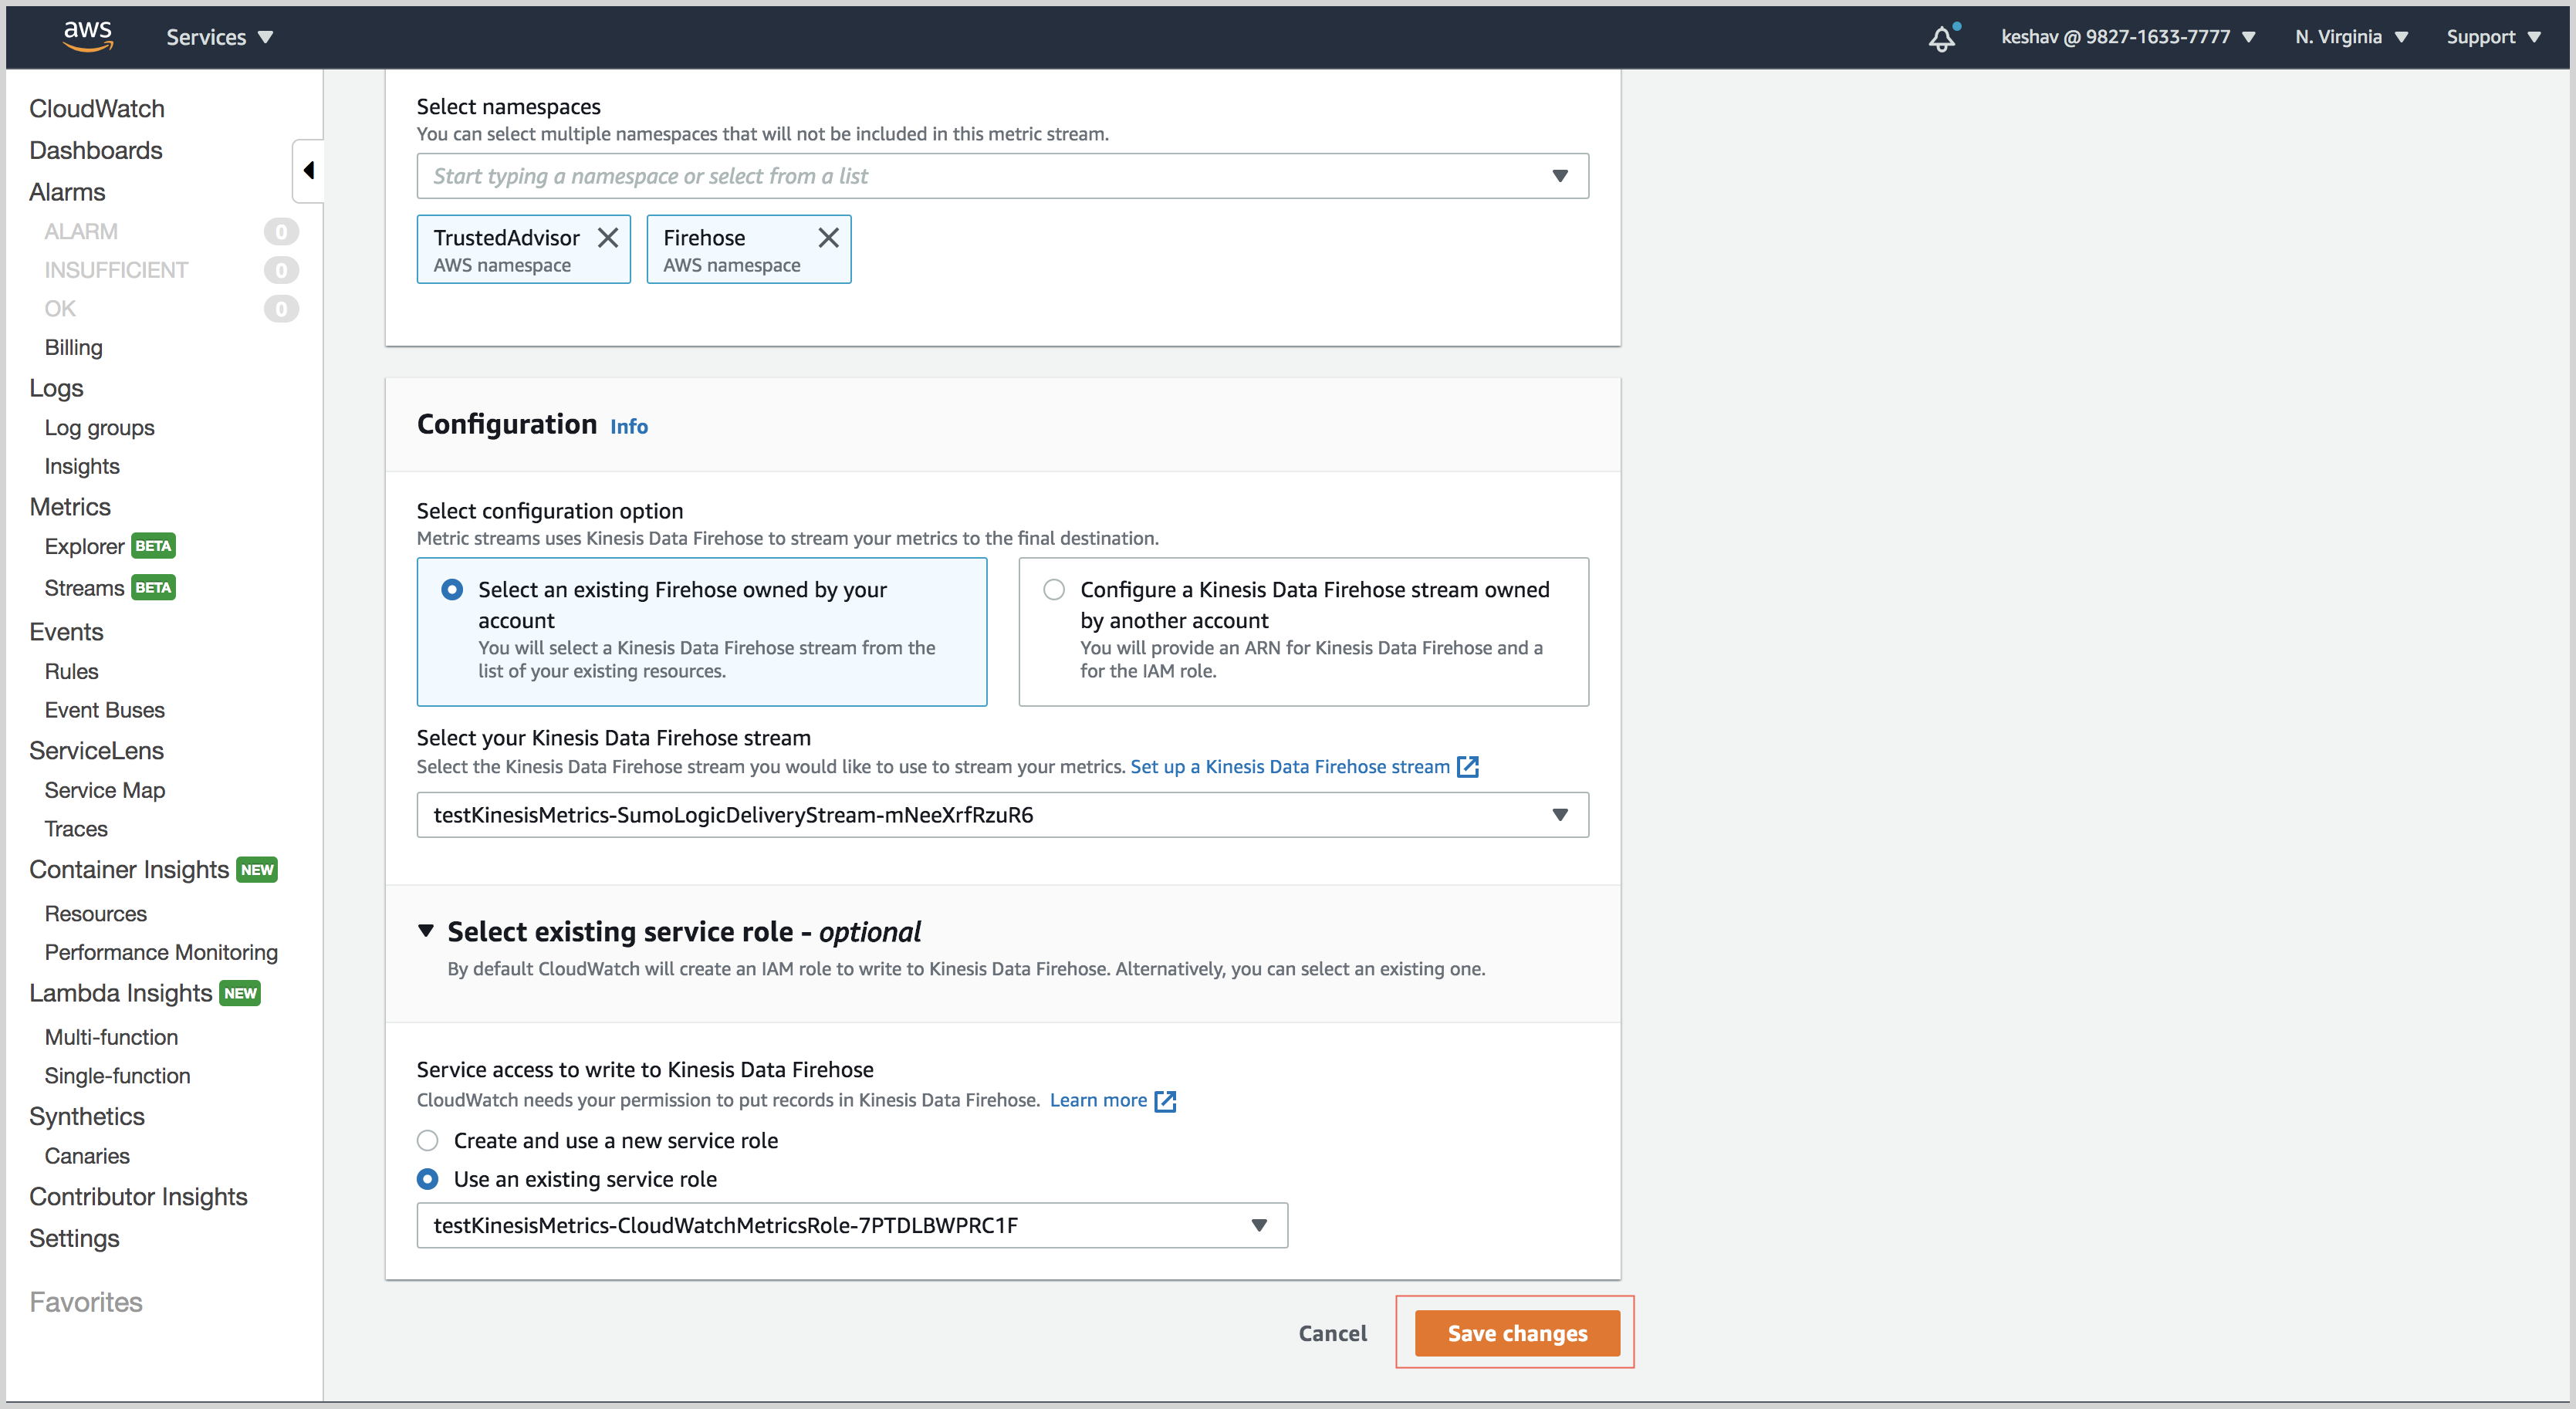
- Click Save changes at the bottom of the page.
Exclude metrics by namespace
- Open the CloudWatch console.
- In the navigation pane, choose Metrics.
- Under Metrics, select Streams.

- Select the metric stream and click Edit.

- Click All metrics and select the Exclude metric namespaces option.
- From the list of AWS namespaces, select the namespaces whose metrics you do not want to receive.
- Click Save changes at the bottom of the page.
Troubleshooting
Metric streams output format
Currently, we support OpenTelemetry 0.7.0 output format for CloudWatch metric streams. If you see an error similar to the below:
HTTP ERROR 400 Could not parse firehose input json
Then it's likely that you have the incorrect output format selected in your CloudWatch metric stream.