Azure Metrics Source
Azure Metrics Source is used to collect all available metrics from Azure Monitor into Sumo Logic. To obtain a complete list of metrics that are collected using this source, refer to the Azure Documentation.
Setup
Vendor configuration
The Azure Metrics Source requires you to provide Tenant Id, Client Id, and Client Secret while configuring. To obtain these values, follow the below steps:
- Sign in to the Azure portal.
- Navigate to Sumo Logic's Custom Deployment wizard.
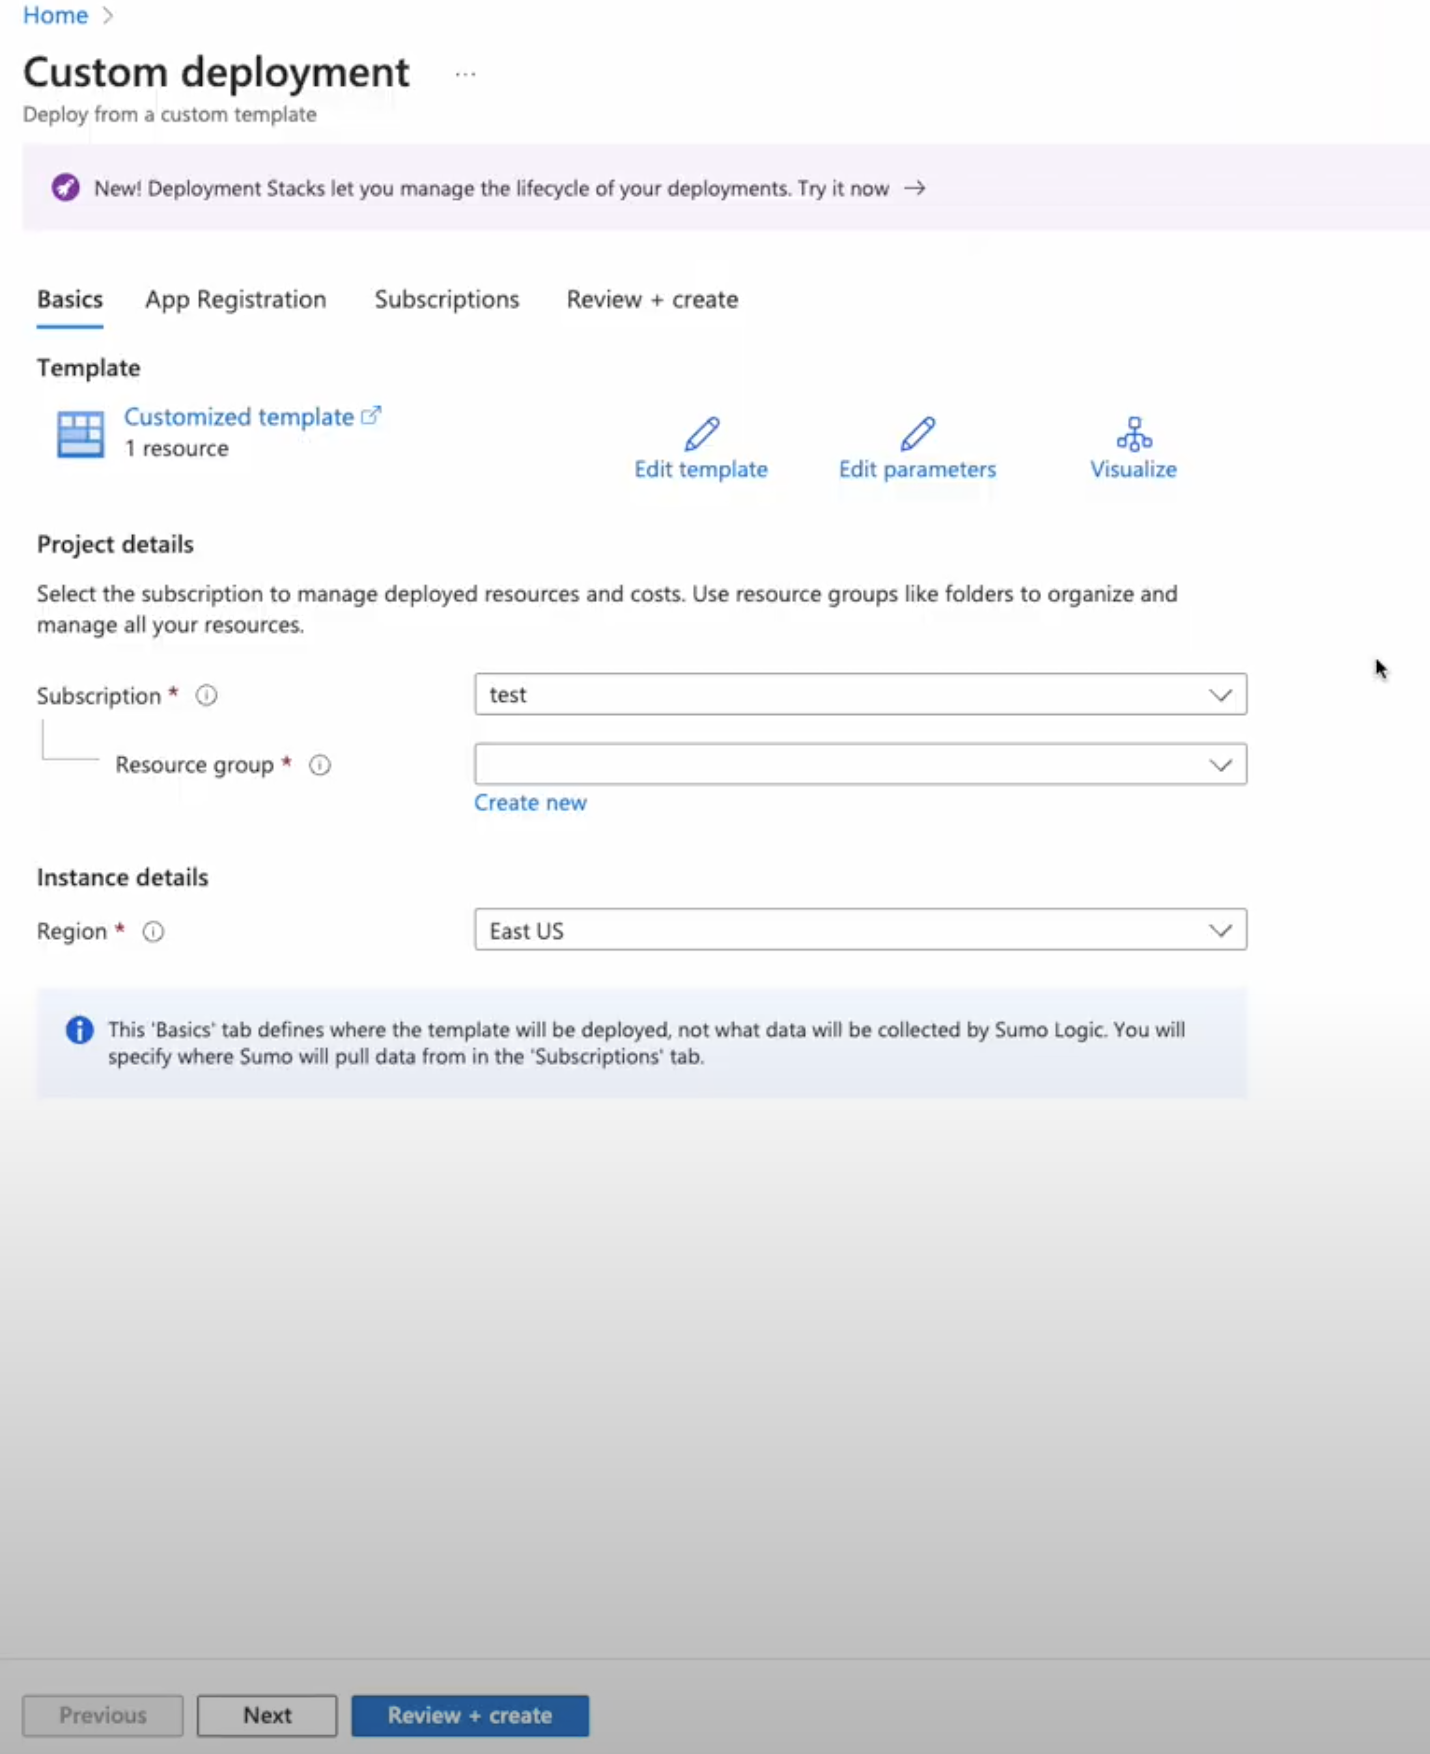
- In the Custom Deployment page, under Basics tab, select the Subscription, Resource Group, and Region in which to deploy the Application, then click Next.
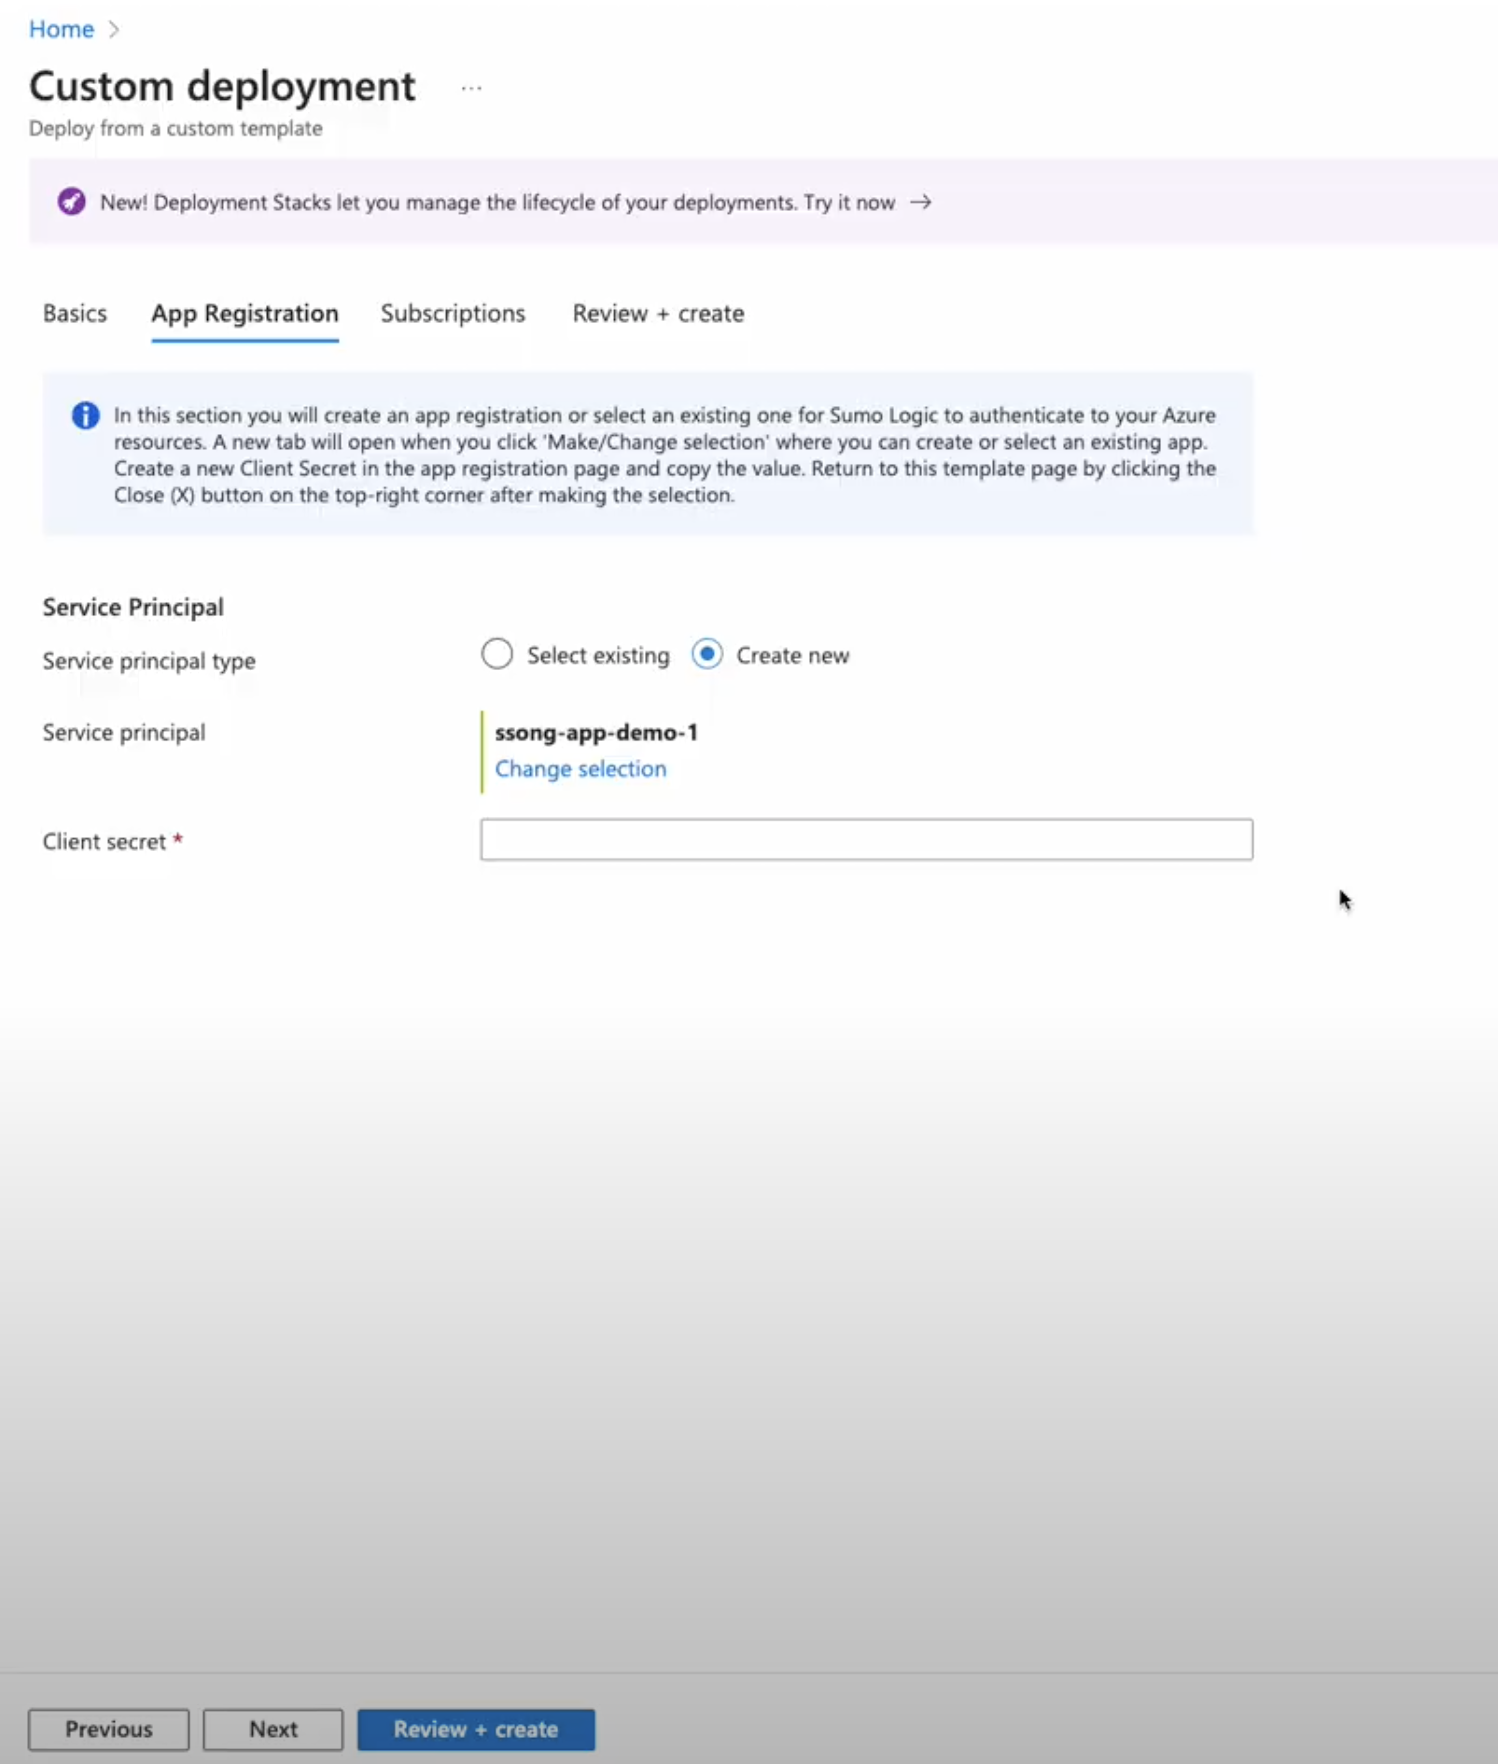
- Under the App Registration tab:
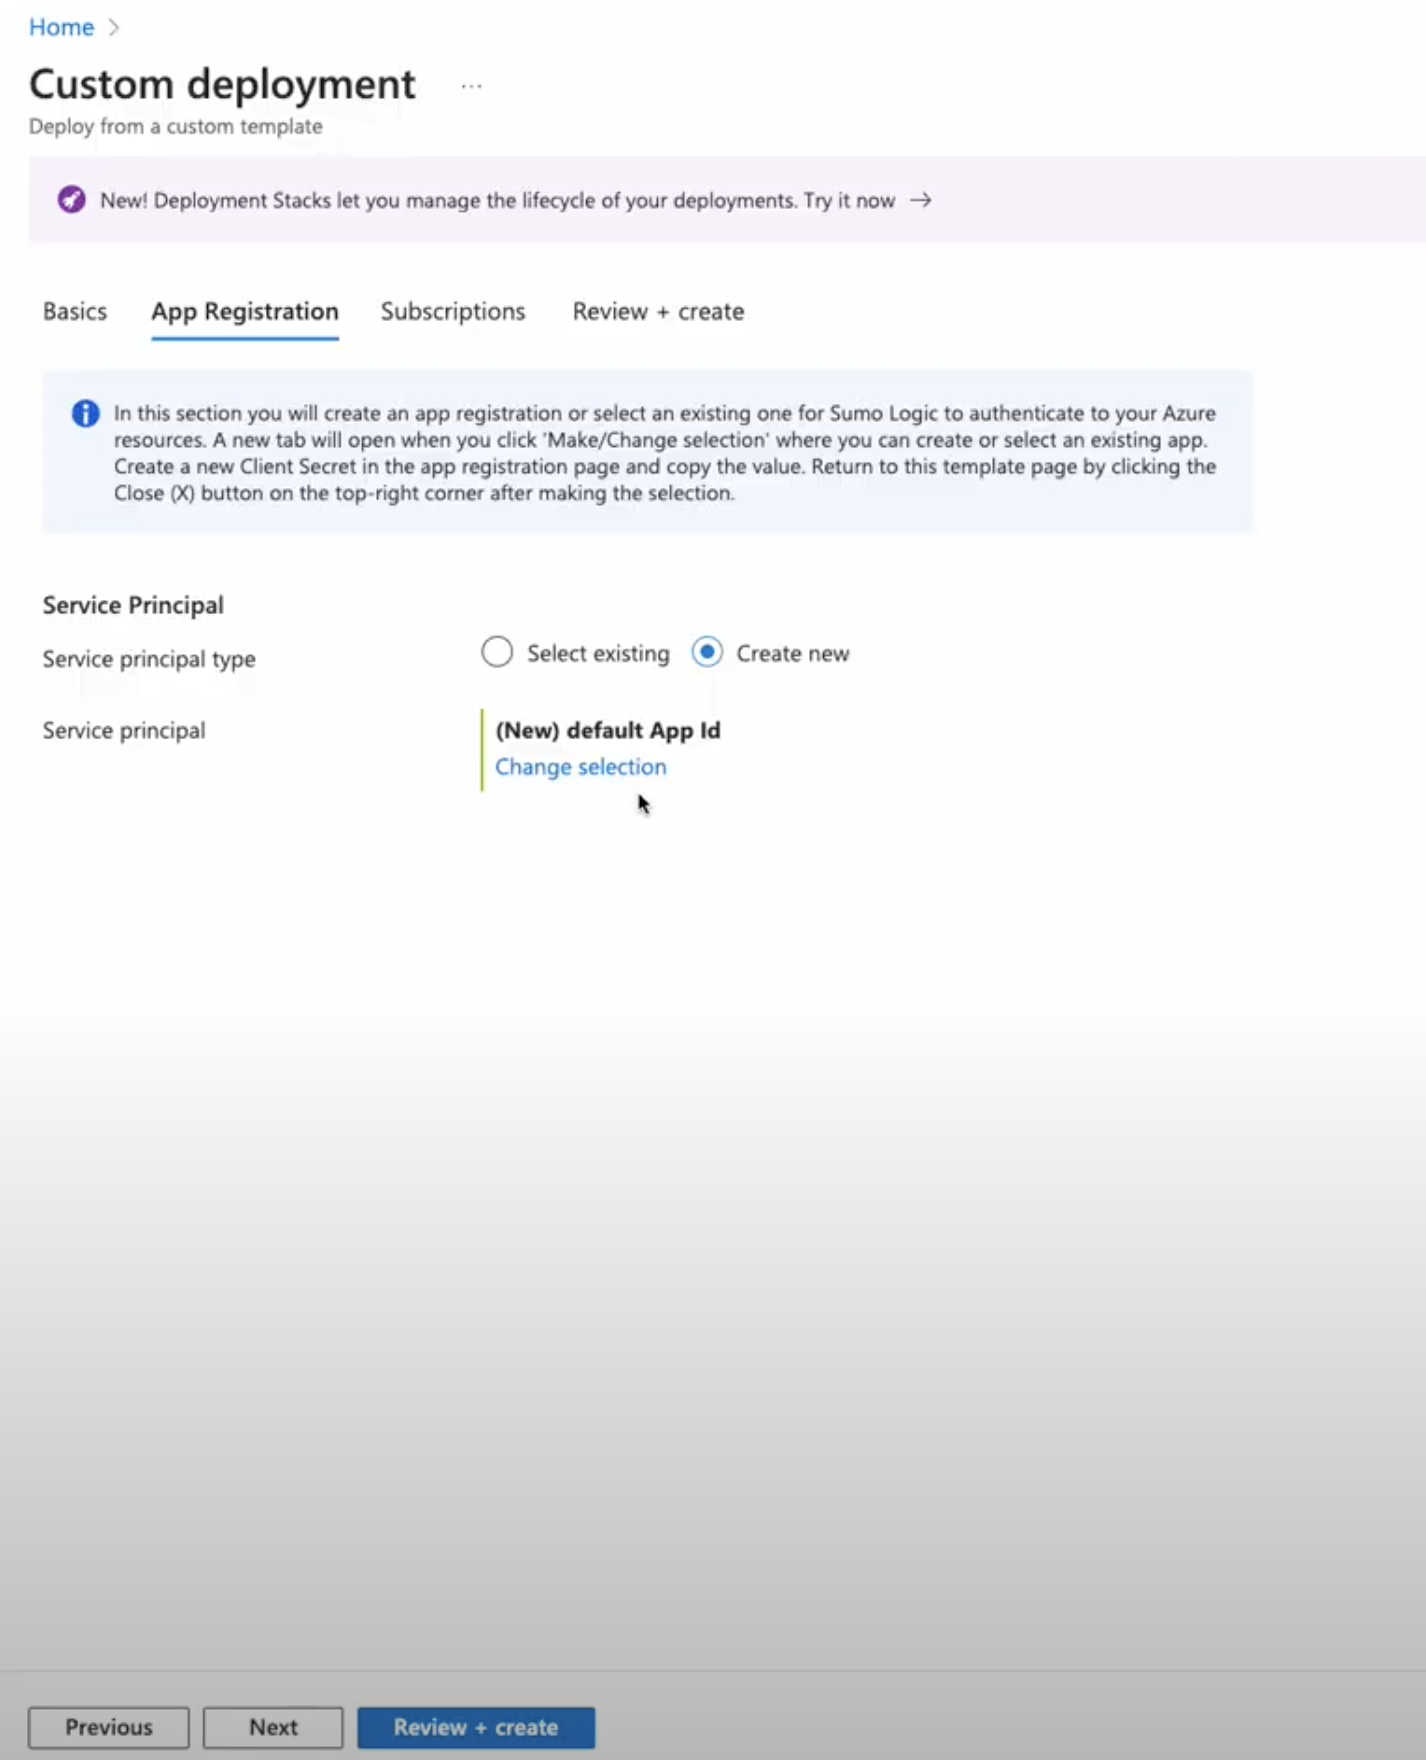
- Select service principal type as Create new to create a new app.
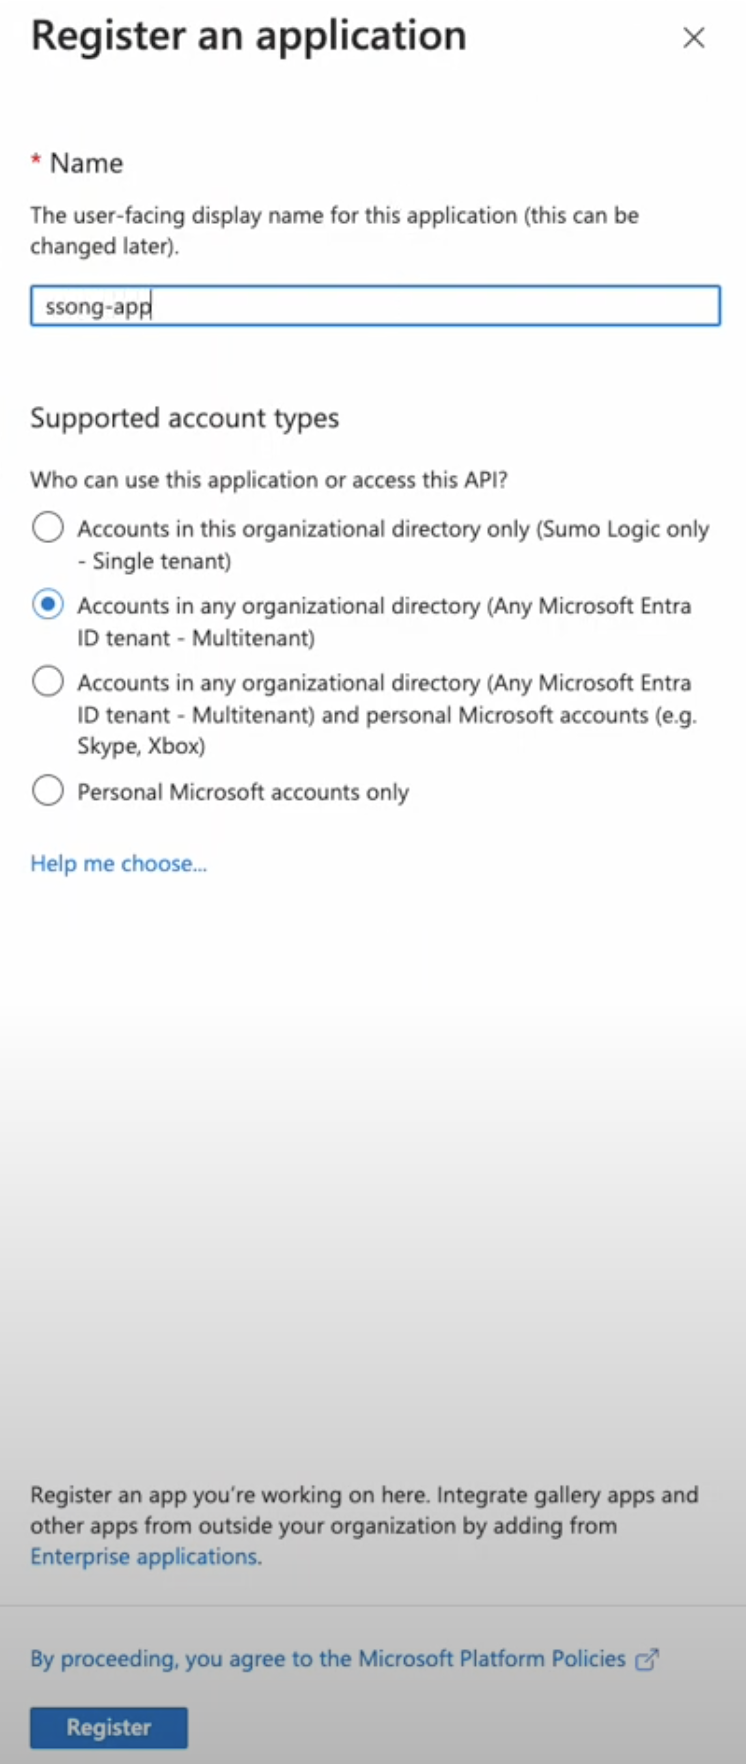
- Click Change selection to enter the name and select Accounts in any organizational directory (Any Microsoft Entra ID tenant - Multitenant) as supported account types. Click Register to register the application.
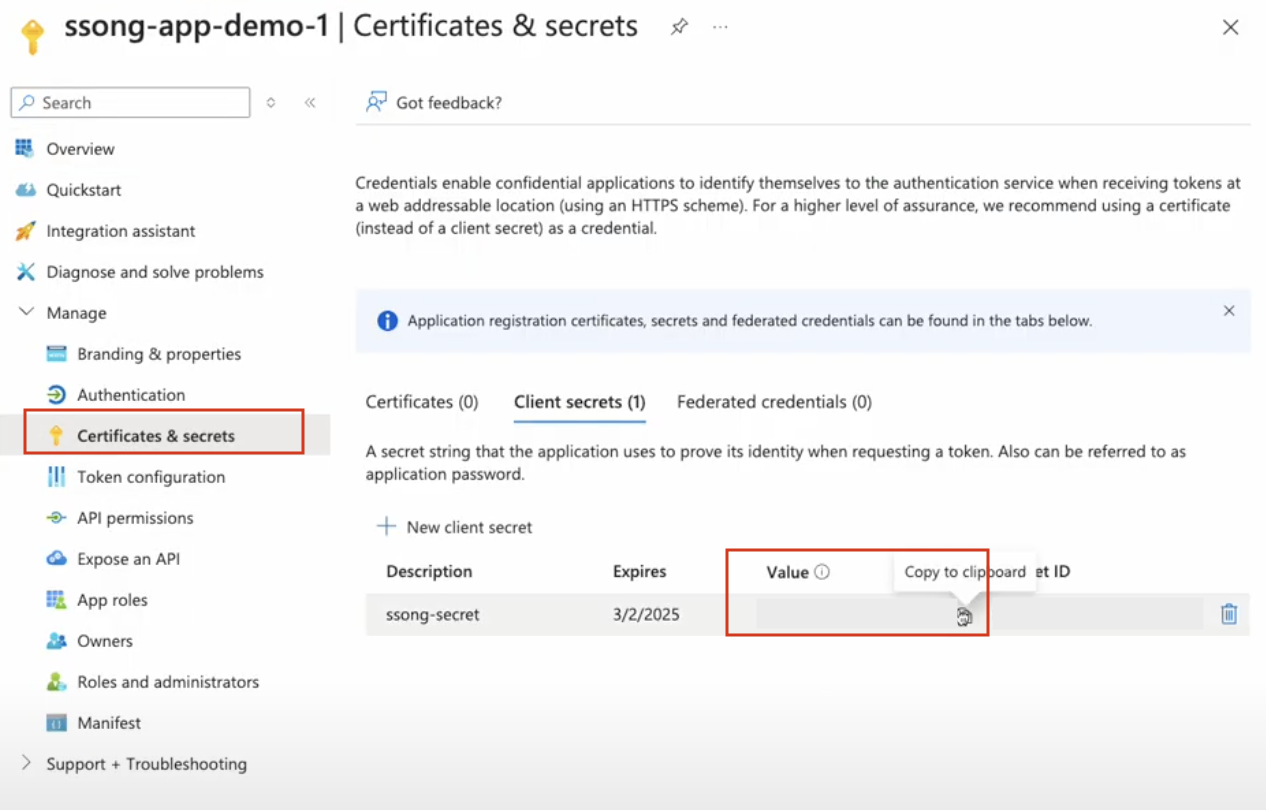
- In the re-directed Certificates & secrets page, under Client secrets tab, click + New client secret.
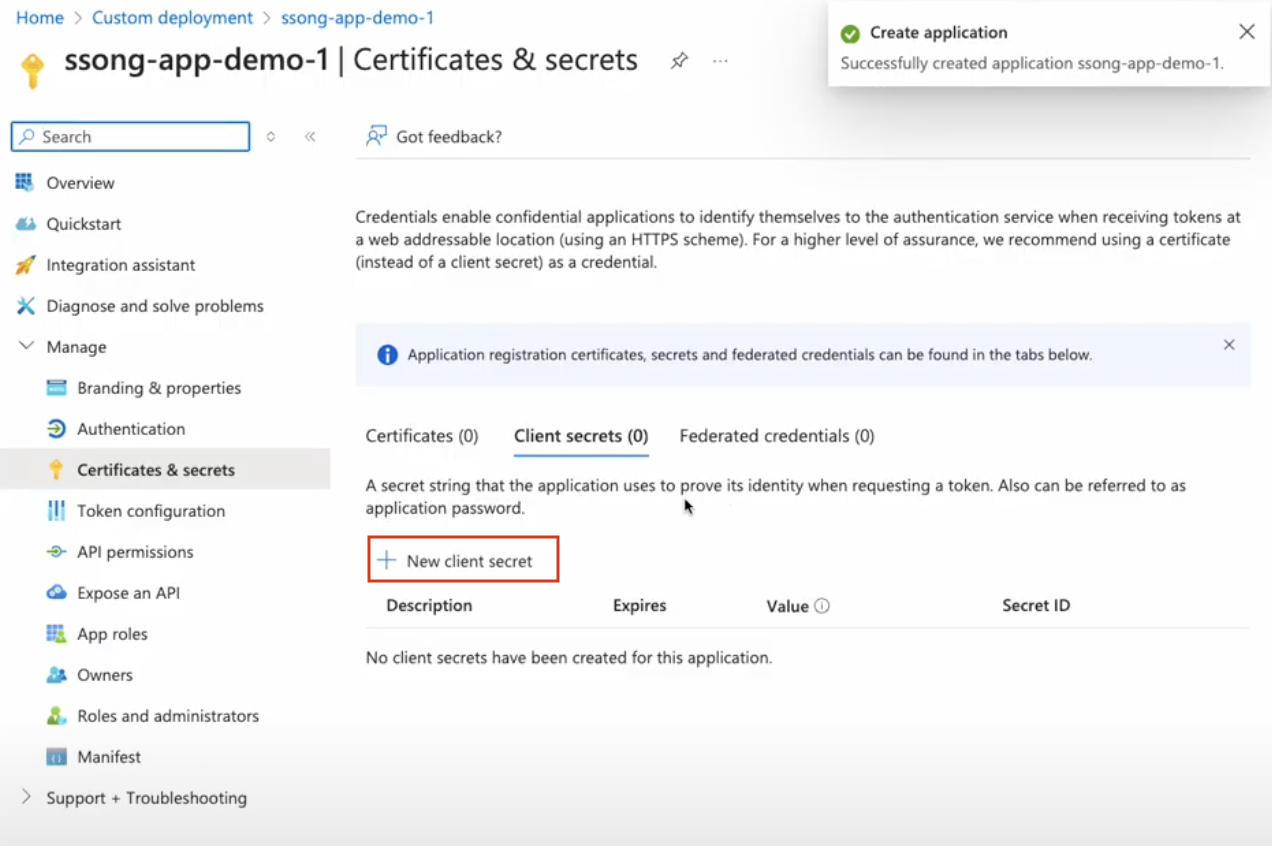
- Description. Enter the description of your choice.
- Expires. From the dropdown, select the expiry time period to the secret value.
- Copy and save the Value.
- Navigate to Overview, copy and save the Application (client) ID and Directory (tenant) ID.
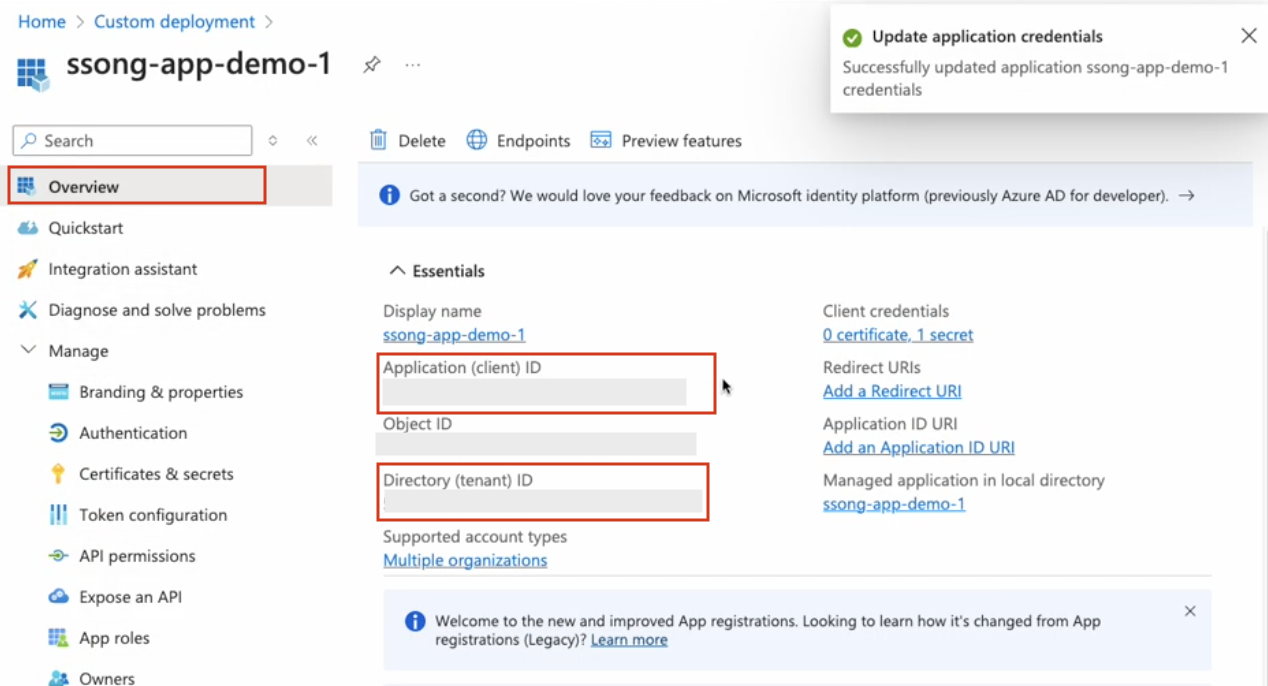
- Close the Overviews page to go back to the Custom Deployment page.
- Enter the copied Value in the Client secret section, then click Next.
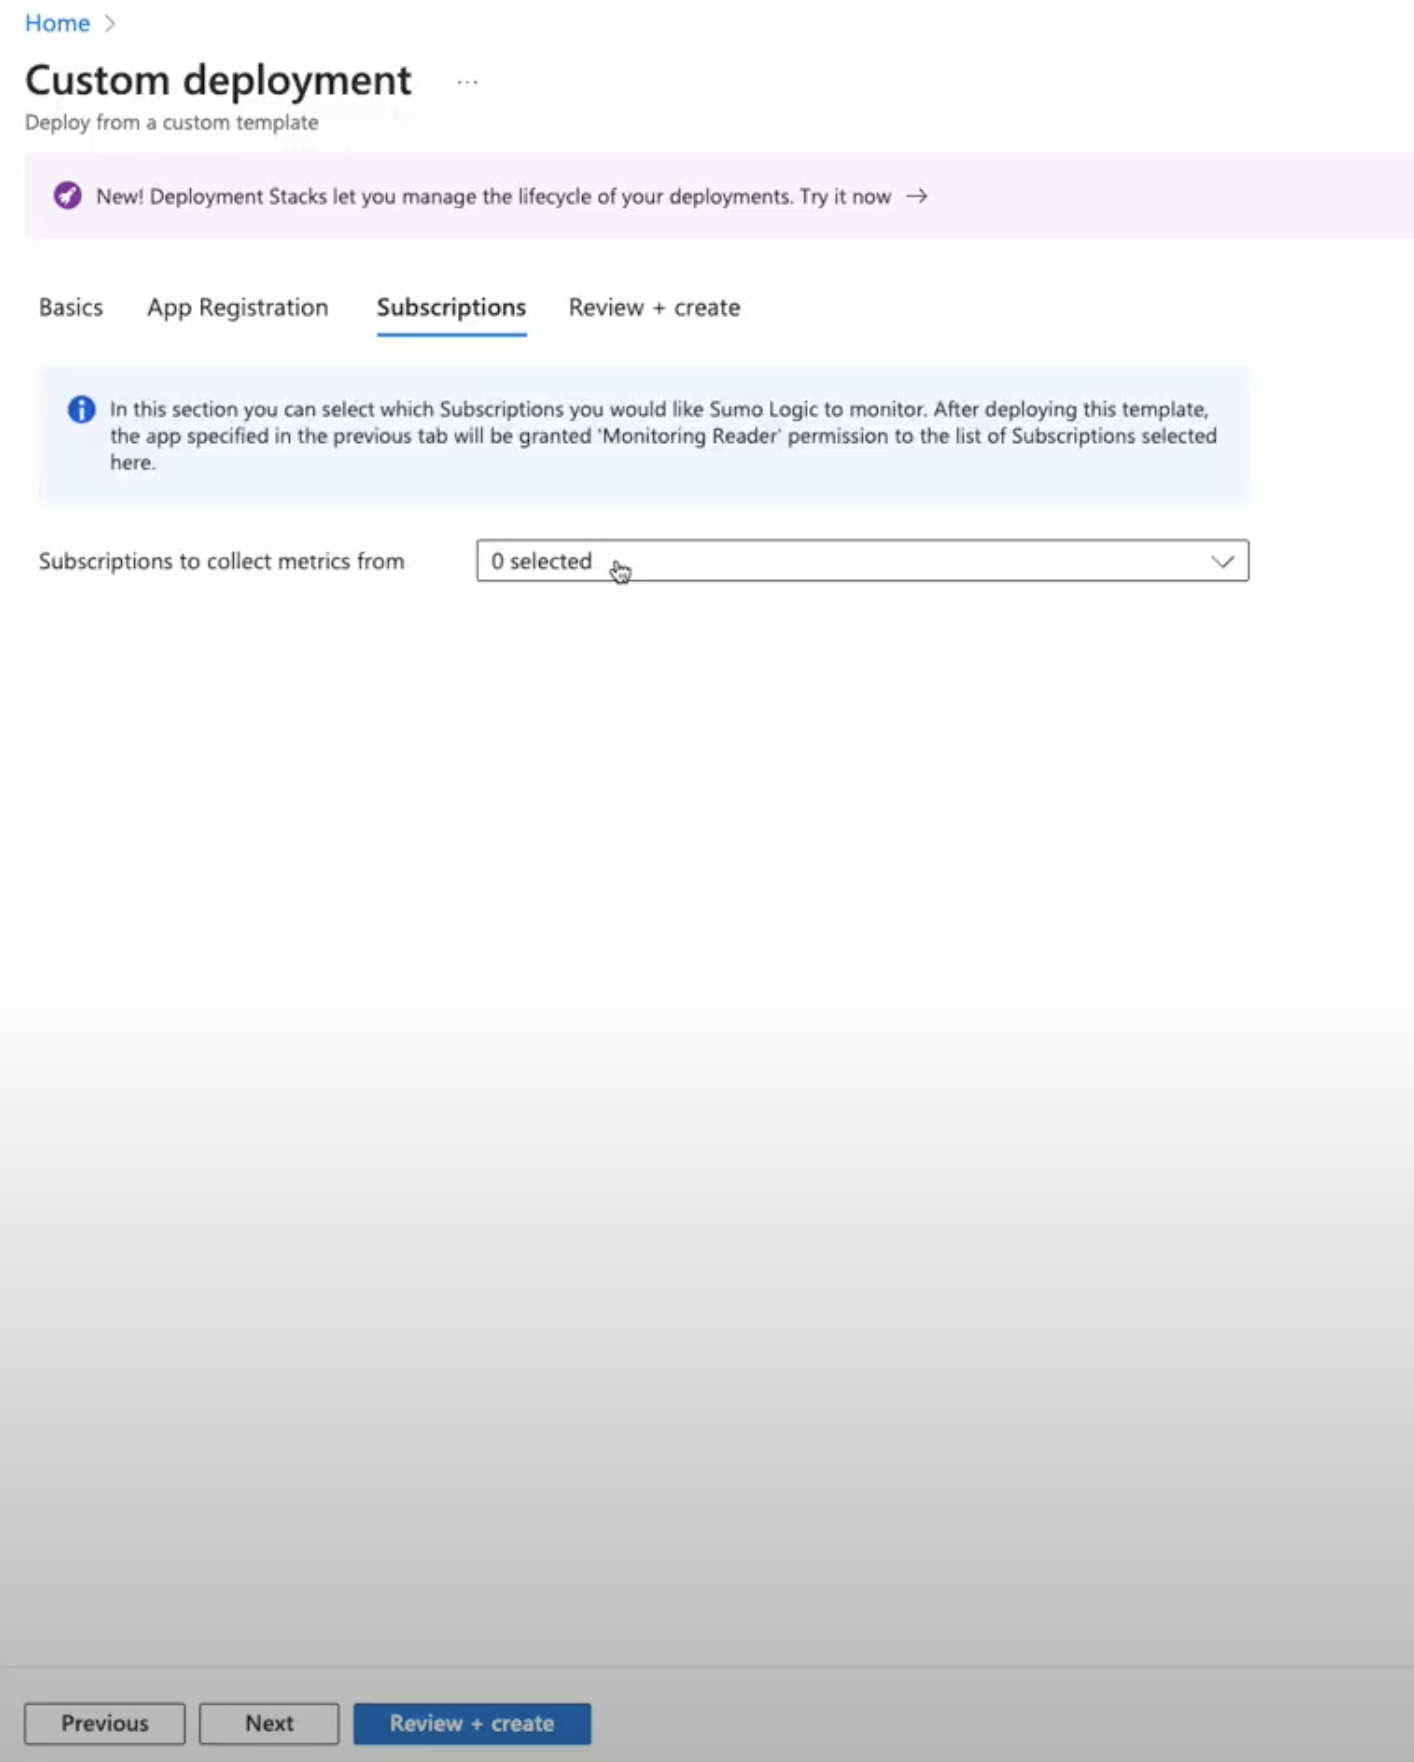
- Under Subscription tab, select the subscriptions from which you would like to collect metrics, then click Next.
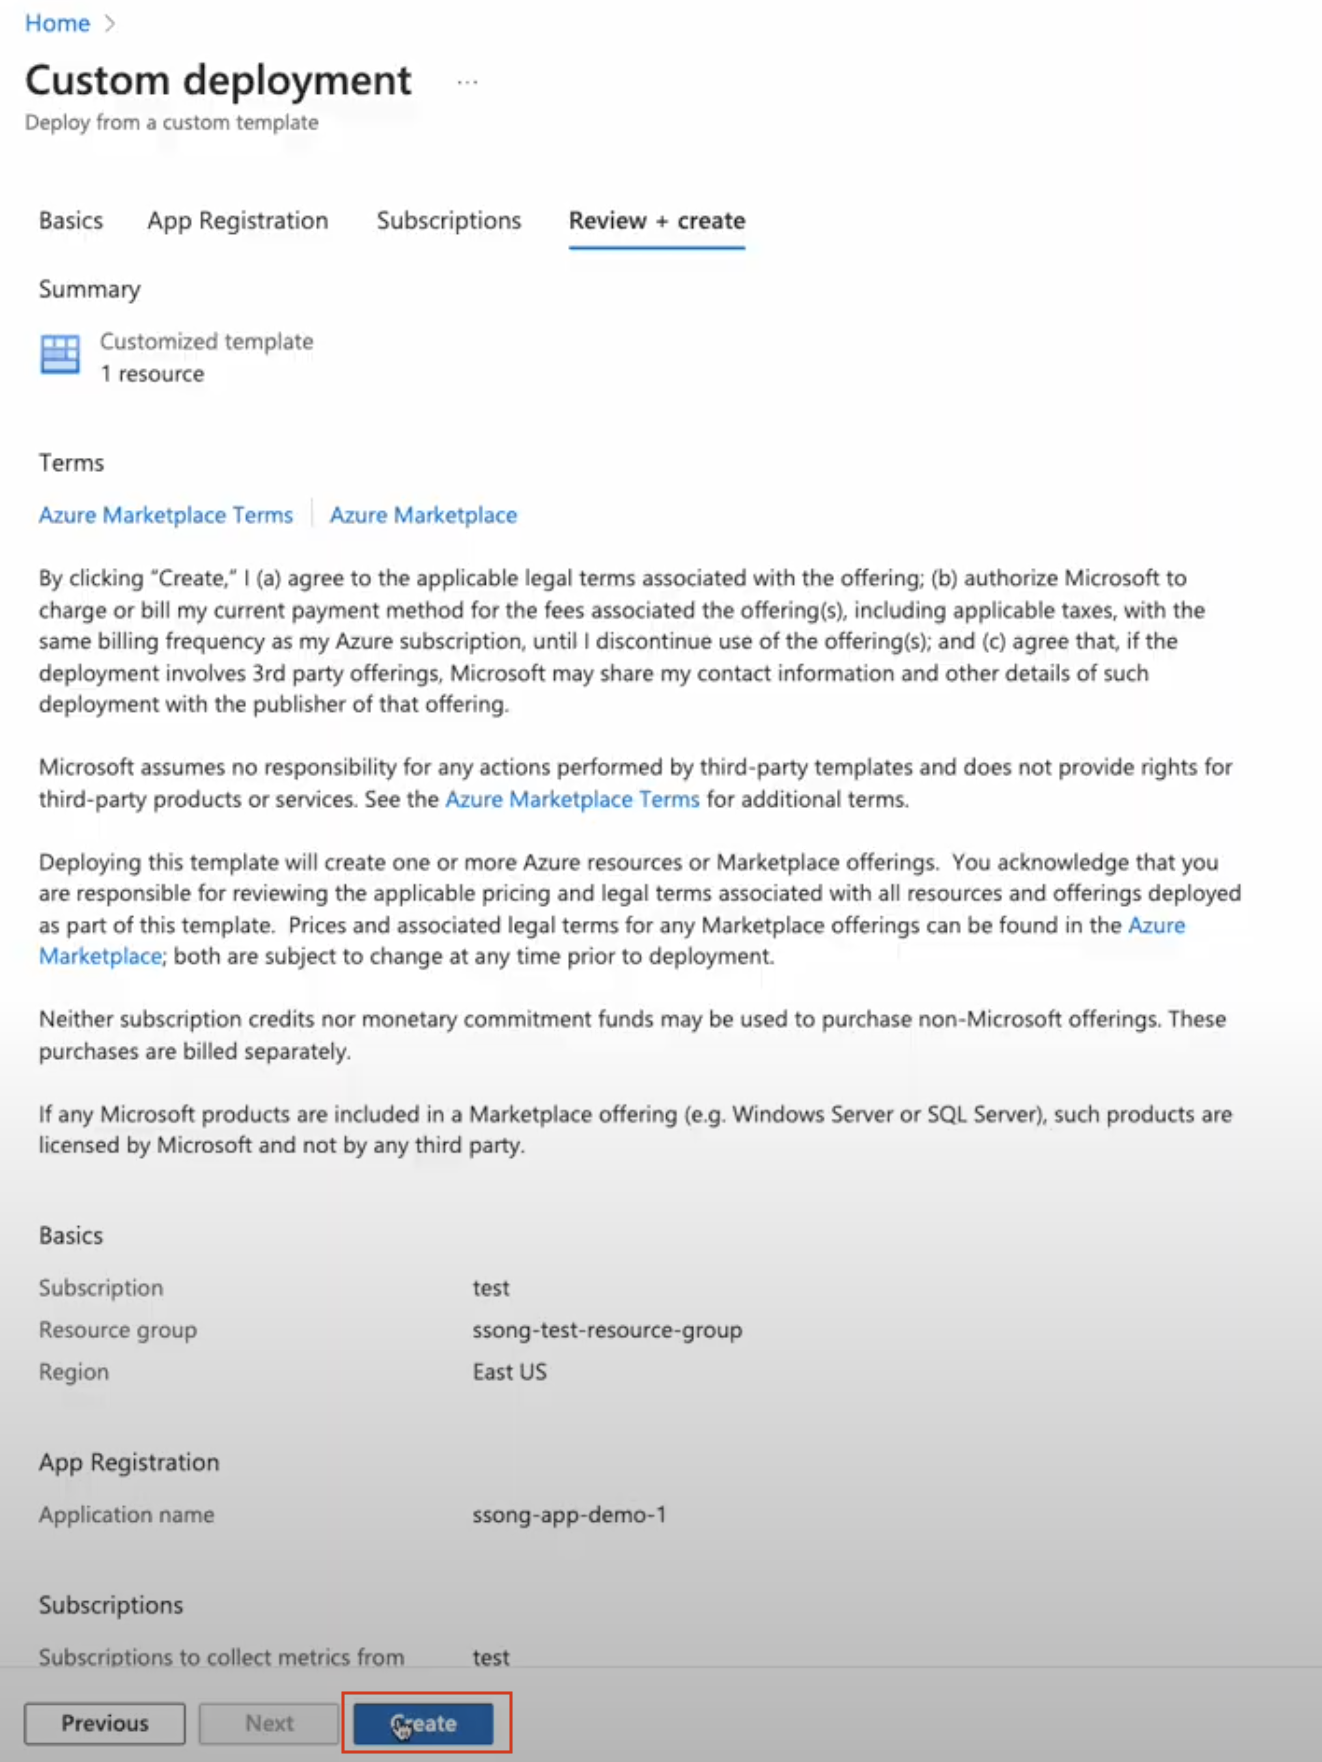
- Click Review + Create. On the Review + Create tab review the details and click Create.
Source configuration
When you create a Azure Metrics source, you add it to a Hosted Collector. Before creating the source, identify the Hosted Collector you want to use or create a new Hosted Collector. For instructions, see Configure a Hosted Collector and Source.
To configure the Azure Metrics Source:
- New UI. In the Sumo Logic main menu select Data Management, and then under Data Collection select Collection. You can also click the Go To... menu at the top of the screen and select Collection.
Classic UI. In the main Sumo Logic menu, select Manage Data > Collection > Collection. - On the collectors page, click Add Source next to a Hosted Collector.
note
Make sure the hosted collector is tagged with tenant_name field for the out of the box Azure apps to work. You can get the tenant name using the instructions here.
- Search for and select Azure Metrics icon.
- Enter a Name to display for the source in the Sumo Logic web application. The description is optional.
- (Optional) For Source Category, enter any string to tag the output collected from the source. Category metadata is stored in a searchable field called
_sourceCategory. - (Optional) Fields. Click the +Add Field link to define the fields you want to associate. Each field needs a name (key) and value.
 A green circle with a check mark is shown when the field exists and is enabled in the Fields table schema.
 An orange triangle with an exclamation point is shown when the field doesn't exist in the Fields table schema. In this case, you'll see an option to automatically add or enable the nonexistent fields to the Fields table schema. If a field is sent to Sumo Logic that does not exist in the Fields schema it is ignored, known as dropped.
- Tenant Id. Enter the Tenant Id collected from Azure platform.
- Client Id. Enter the Client Id collected from Azure platform.
- Client Secret. Enter the Client Secret collected from Azure platform.
- View Subscriptions. Click View Subscriptions to verify the authentication credentials entered to get Azure access.
- Environment. Select the environment from the dropdown from which you would like to collect metrics.
- Azure Regions. Select All Regions, if you want to collect metrics from all regions. Or, click Select Regions to select the region of your choice from the dropdown to collect metrics.
- Azure Namespaces. Select All Namespaces, if you want to collect metrics with all namespaces. Or, click Select Namespaces to select the namespaces of your choice from the dropdown to collect metrics.
- Tags Filter. Select any tag filter from the dropdown to enforce it with the each namespace. This helps you to further fine-tune from which resources you would like to collect metrics. It only supports resource tags which are custom user-configured key-value pairs on the azure resource. This approach allows for dynamic discovery, so for example if the resources are ephemeral or if any new resources are created in the same namespace, region and namespace are tagged with same key-value pairs as configured in the source, so their metrics can be collected automatically.
- Scan Interval. This option sets how often the source is scanned. By default, the scan interval is set to 1 minute. Setting a shorter frequency increases message volume, and can cause your deployment to incur additional charges. The minimum acceptable scan interval is 1 minute.
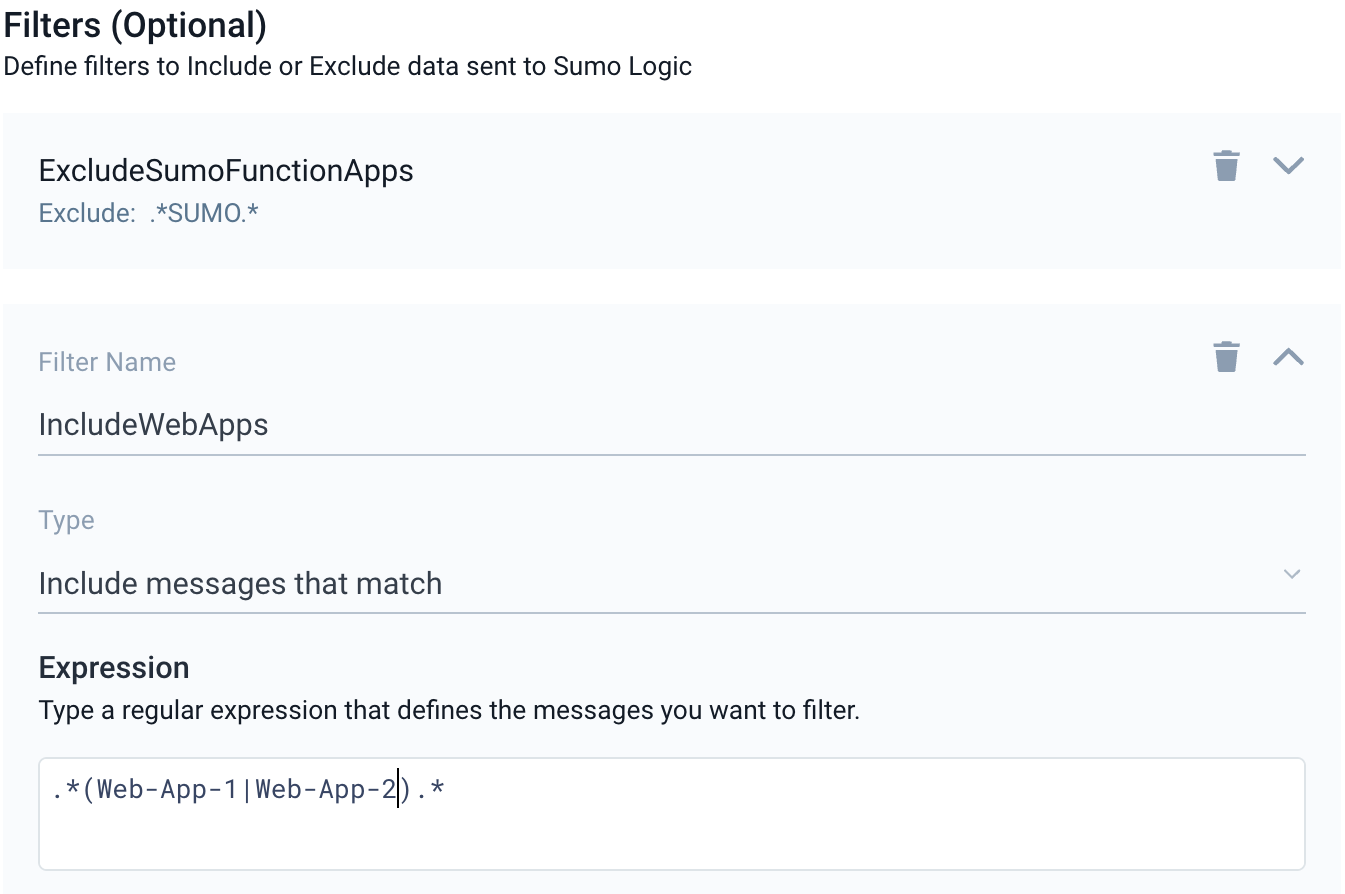
- Processing Rules for Metrics (Optional). Configure any desired filters, such as allowlist and denylist, as described in Metrics Include and Exclude Rules.
JSON schema
Configuration Object
| Parameter | Type | Required | Default | Description | Example |
|---|---|---|---|---|---|
| name | String | Yes | null | Type a desired name of the source. The name must be unique per Collector. This value is assigned to the metadata field _source. | "mySource" |
| description | String | No | null | Type a description of the source. | "Testing source" |
| category | String | No | null | Type a category of the source. This value is assigned to the metadata field _sourceCategory. See best practices for details. | "mySource/test" |
| fields | JSON Object | No | null | JSON map of key-value fields (metadata) to apply to the Collector or Source. Use the boolean field _siemForward to enable forwarding to SIEM. | {"_siemForward": false, "fieldA": "valueA"} |
| environment | String | Yes | null | Type of environment from which you would like to collect metrics. | |
| limitToRegions | Array | No | null | Specify the regions from which you want to collect metrics. To collect from all regions, leave null. | |
| limitToNamespaces | Array | No | null | Specify the namespaces from which you want to collect metrics. To collect from all namespaces, leave null. | |
| tagFilters | JSON Object | No | null | For each namespace, if defined, the source will only collect metrics for resources that match the tag filter. | |
| tenantId | String | Yes | null | Enter the tenant Id collected from the Azure platform. | |
| clientId | String | Yes | null | Enter the client Id collected from the Azure platform. | |
| clientSecret | String | Yes | null | Enter the client secret collected from the Azure platform. | |
| scanInterval | Integer | No | 1 minute | How frequently the integration should collect the metrics data from Azure. Options: 1m or 5m. |
JSON example
loading...
Troubleshooting
Unable to authenticate to Azure
During Source creation, if you encounter errors such as Unable to get subscriptions. Please check credentials. or Unable to authenticate to Azure.
To rectify this ensure you verify your credentials are valid in the Azure portal by following the below steps:
- Sign in to the Azure portal.
- Navigate to app registrations and locate the app that was created during the Deploy to Azure process.
- Go to Certificates & Secrets.
- Ensure that a valid Client Secret exists. If no secret is present or the existing one has expired, create a new Client Secret.
- Retry the Source creation process using the updated credentials.
Subscriptions not present in the View Subscriptions list
If the View Subscriptions list does not include expected Azure subscriptions, you can verify that the credentials have sufficient permission to read from the expected subscription. Another possible cause could be a propagation delay. After creating a new app or client secret, Azure may take up to 10 minutes to reflect the changes across its services. Wait a few minutes and refresh the list.
Follow the steps below to verify and assign proper permissions:
- In the Azure portal, navigate to Subscriptions.
- Select the target subscription.
- Go to Access Control (IAM) > Role assignments.
- Confirm that the App created during the Deploy to Azure step is listed.
- Ensure it is assigned the Monitoring Reader role.
Missing metrics in Sumo Logic
Azure Monitor displays all metrics, even those without data, but Sumo Logic only collects metrics with actual datapoints. If you know that certain metrics in Azure contain actual data (non-empty values) and you expected those metrics to appear in Sumo Logic, but they are missing, it’s recommended to reach out to Sumo Logic Support to resolve the issue.
API throttling by Microsoft
If API requests to Azure are being throttled, resulting in failed or delayed metric ingestion, review and follow the guidance in the Best Practices section for reducing the frequency and volume of API calls. If you continue to experience throttling, reach out to Sumo Logic Support for assistance.
Best practices
The Sumo Logic Azure Metrics Source uses the Azure Monitor API to retrieve metrics from your Azure environment. Following the best practices below will help reduce the number of API requests, avoid hitting Microsoft’s API throttling limits, and ensure efficient and reliable metric collection.
Limit one source per subscription
Microsoft enforces API throttling for each subscription. Since each Sumo Logic Azure Metrics Source sends independent requests to the Azure Monitor API, Sumo Logic strongly recommends you to use only one Azure Metrics Source per Azure subscription.
A single Sumo Logic Source can collect metrics from multiple Azure subscriptions without issue. However, avoid assigning more than one Source to collect from the same subscription, as this may lead to throttling.
Increase the scan interval to reduce API load
The scan interval determines how often the Azure Metrics Source queries the Azure Monitor API. Adjusting this interval can significantly impact API usage:
- Shorter scan intervals (for example, 1 minute) result in more frequent API calls.
- Longer scan intervals reduce the request rate, helping to avoid throttling—especially in environments with a high number of resources.
Recommended scan interval guidelines
| Scan Interval | Maximum Resources per Subscription | Maximum VMs per Subscription for Virtual Machine Guest metrics |
|---|---|---|
| 1 minute | 20,000 (3,000 for users on Azure Sovereign Cloud) | 600 (80 for users on Azure Sovereign Cloud) |
| 5 minutes | 100,000 (15,000 for users on Azure Sovereign Cloud) | 3,000 (400 for users on Azure Sovereign Cloud) |
By default, the scan interval is set to 1 minute. For a larger number of resources, increase the scan interval further using the Sumo Logic Source Management API.
Increasing the scan interval does not reduce metric granularity. The frequency of data collection changes, but the resolution of data points remains unaffected.
Estimate API request rate per subscription
The API request rate for the Azure Metrics Source depends on the scan interval and the number of resources in a subscription. Since Microsoft enforces API throttling per subscription, you can estimate the rate of requests made per subscription using the following formula:
(CEILING((T / 50) / N) * N * (180 / S)) + (V * (144 / S))
Where,
T = Total number of non-VM resources
V = Total number of VMs (only for users collecting Virtual Machine Guest metrics)
N = Number of distinct namespaces with active resources
S = Scan Interval (in minutes)
Understanding this rate helps you proactively configure your Sources to stay within Microsoft’s service limits and avoid interruptions due to throttling.