Streaming Metrics Source
You can use Sumo’s streaming metrics source with an installed collector to collect metrics from any application that emits metrics over TCP or UDP in the Graphite, Carbon 2.0, or Prometheus plaintext protocols. The streaming metrics source is analogous to a Syslog server, but for receiving metrics rather than logs.
Metrics support for Carbon 2.0 format requires collector version 19.216-22 or higher.
In the procedure below, you configure a streaming metrics source on an installed collector. You can deploy an installed collector with the streaming metrics source on each host from which you want to collect metrics. If you prefer, you can use a single centralized installed collector and source and point the remote hosts to the centralized installed collector, rather than localhost.
The procedure below assumes you will use an installed collector on each host from which you want to collect metrics.
Configure a streaming metrics source
Perform these steps on each host from which you want to collect metrics:
-
Set up an installed collector. (Skip this step if you have already set up the collector.)
-
Classic UI. In the main Sumo Logic menu, select Manage Data > Collection > Collection.
New UI. In the Sumo Logic top menu select Configuration, and then under Data Collection select Collection. You can also click the Go To... menu at the top of the screen and select Collection. -
Click Add, and then Add Source.
-
On the Select Source for Collector page, select Streaming Metrics.
-
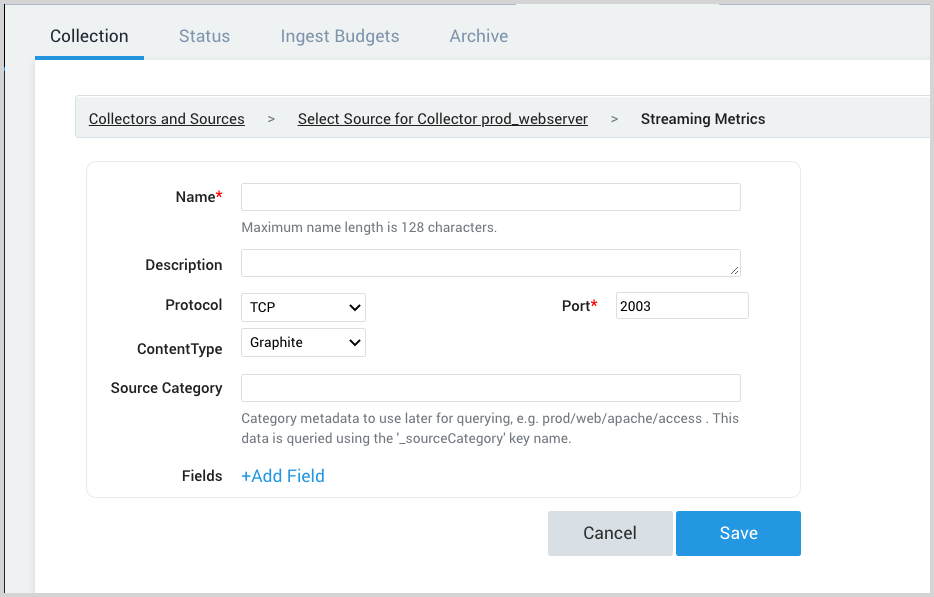
On the source configuration page, supply the following fields:
-
Name. Enter a name for the source.
-
Description. (Optional) Enter a description for the source.
-
Protocol. By default, TCP is selected. If your apps or infrastructure use UDP, use the pull-down to select UDP.
-
ContentType. By default, Graphite is selected. If your apps or infrastructure emit metrics using the Carbon 2.0 format, use the pull-down to select Carbon2 or Prometheus.
-
Source Category. Enter a source category. Once you start ingesting metrics, you can use the _sourceCategory metadata field with this value to search for metrics. Example source categories:
- prod/web/metrics
- dev/web/metrics
-
Fields. Click the +Add Field link to add custom metric metadata. Define the fields you want to associate, providing a name (key) and value for each.
-
-
Click Save.
- Metrics reported with a timestamp older than 24 hours ago or newer than 24 hours in the future from the time they are reported are dropped. Make sure that the Metrics sent to the Streaming Metrics source have appropriate timestamps.
- Sumo Logic enforces limits on the volume of metrics and associated metadata you ingest. For more information, see Data Limits for Metrics.
Specify the network interface for a streaming metrics source
When configuring a streaming metrics source on a computer that has more than one network interface you can specify which network interface the collector should bind to. This option is set in the collector.properties file in the collector’s config folder.
To specify the network interface:
-
Navigate to
collector/config/collector.properties. Open the file in a text editor. -
Add the following line to the
collector.propertiesfile, whereyour_host_nameidentifies the network interface you'd like to use.streaming.metrics.hostname=your_host_name -
Save and close the file.
Metric formats
The sections below describe the Graphite, Carbon 2.0, and Prometheus formats.
Incorrectly formatted metrics will not be ingested.
Graphite metric format
The Graphite plaintext protocol follows this format:
metric_path metric_value metric_timestamp
where:
metric_pathis a dot-separated string.metric_valueis any numeric value.metric_timestampis a UNIX timestamp.
For example:
cluster-1.node-1.cpu-1.cpu-idle 97.29 1460061337
Carbon 2.0 metric format
Carbon 2.0 format requires collector version 19.216-22 or higher. The Carbon 2.0 plaintext protocol follows this format:
intrinsic_tags meta_tags value timestamp
where:
intrinsic_tagsis one or more space-separated intrinsic tagsmeta_tagsis one or more space-separated meta tagsvalueis any numeric value.timestampis a UNIX timestamp.
Currently Sumo Logic interprets meta tags as non-identifying dimensions. This is subject to a change and meta tags and intrinsic tags will both be treated as identifying dimensions in the future. To conform to the target behavior from the beginning, we suggest to place all your metric metadata in the intrinsic_tags section.
For example:
metric=request_rate site=mydomain mtype=rate unit=Req/s host=web12 agent=statsdaemon1 234 1234567890
Unlike Prometheus, Carbon 2.0 format doesn't enforce the presence of a metric name. It also cannot be reliably inferred automatically. Therefore, Sumo Logic require a metric key to be present among intrinsic_tags. All metrics without a metric key specified will not be ingested to Sumo and a MetricsMetricNameMissing Health Event for the associated Metric Source will be triggered (for more information on Halth Events, see About Health Events).
For example, the following metric will be correctly ingested to Sumo Logic:
cluster=cluster-1 node=node-1 cpu=cpu-1 metric=cpu_idle 73.12 1112470620
while the one below will be dropped:
cluster=cluster-2 node=node-2 cpu=cpu-2 73.12 1112470620
Prometheus metric format
In the Prometheus format, a time series is uniquely identified by its metric name and a set of labels, which are key-value pairs. It's formed like this:
# HELP metric_name metric_description
# TYPE metric_name metric_type
metric_name labels value timestamp
metric_name labels value timestamp
Here is an example of a Prometheus metric exposition for two time series. (The process of making metrics available to Prometheus is called exposition.)
# HELP http_requests_total The total number of HTTP requests.
# TYPE http_requests_total counter
http_requests_total{method="post",code="200"} 1027 1395066363000
http_requests_total{method="post",code="400"}    3 1395066363000
See the table below for descriptions of the components of a Prometheus metric exposition.
The streaming metrics source can receive Prometheus data as long as that data is pushed to it. This source cannot scrape Prometheus exporters. For that, we suggesting using Telegraf.
| Component | Description |
|---|---|
metric_name | Specifies the general feature of a system that is measured. For example:http_requests_total |
metric_description | An arbitrary description or category for the metric. For example:requests |
metric_type | the type of the metric, one of counter, gauge, histogram, summary, or untyped. |
labels | ero or more space-separated key-value pairs that identify a particular dimensional instantiation of the metric, for example:http_requests_total{method="post",code="200"} 1027 1395066363000http_requests_total{method="post",code="400"} 3 1395066363000 |
value | Value of the metric. |
timestamp | The time the metric was collected, in int64 format. |
The Prometheus format does not support metadata in the format itself. You can attach metadata to Prometheus metrics by specifying it the HTTP header when you upload the metrics to Sumo. For more information, see Upload Metrics to an HTTP Source.
The streaming metrics source can receive Prometheus data as long as that data is pushed to it. This source cannot scrape Prometheus exporters. For that, we suggesting using Telegraf.