Syslog Source
A Syslog Source operates like a syslog server listening on the designated port to receive syslog messages. You set your hosts or syslog-enabled devices to send syslog data to the same port you specify when you configure the Syslog Source.
For multiple syslog collections, set up a separate Source for each and set a separate port number for each.
If you are already running a syslog server, you can either switch to using a Syslog Source as your syslog server (recommended) or you can output the existing syslog server data to a local file, and then set up a Local or Remote File Source to collect the file.
If you are editing a Source, metadata changes are reflected going forward. Metadata for previously collected log data will not be retroactively changed.
Configure a Syslog Source
- Classic UI. In the main Sumo Logic menu, select Manage Data > Collection > Collection.
New UI. In the Sumo Logic top menu select Configuration, and then under Data Collection select Collection. You can also click the Go To... menu at the top of the screen and select Collection. - Find the Installed Collector to which you'd like to add the Syslog Source. Click Add and then choose Add Source from the pop-up menu.
- Select Syslog for the Source type.
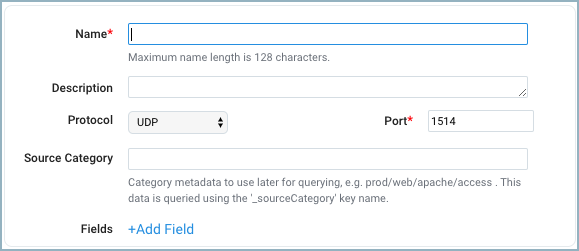
- Name. Enter the name you'd like to display for the new Source. Description is optional. The Source's name is stored as the metadata field
_sourceCategory. - Protocol. Select the protocol that your syslog-enabled devices are currently using to send syslog data, UDP or TCP. For more information, see Choosing TCP or UDP.
- Port. Enter the port number for the Source to listen to. If the collector runs as root (default), use 514. Otherwise, consider 1514 or 5140. Make sure the devices are sending to the same port.
- Source Category. Enter a string to tag the collected messages with the searchable metadata field
_sourceCategory. For example, enter firewall to tag all collected messages in a field called_sourceCategory. Enter_sourceCategory=firewallin the Search field to return results from this Source. For more information, see Metadata Naming Conventions and our Best Practices: Good and Bad Source Categories. - Fields. Click the +Add Field link to define the fields you want to associate; each field needs a name (key) and value.
 A green circle with a check mark is shown when the field exists in the Fields table schema.
 An orange triangle with an exclamation point is shown when the field doesn't exist in the Fields table schema. In this case, an option to automatically add the nonexistent fields to the Fields table schema is provided. If a field is sent to Sumo that does not exist in the Fields schema it is ignored, known as dropped.
noteIf you have Cloud SIEM installed and you want to forward log data to Cloud SIEM, click the +Add Field link and add a field whose name is
_siemForwardand value is true. This will ensure all logs for this source are forwarded to Cloud SIEM. - Set any of the following under Advanced:
- Enable Timestamp Parsing. This option is selected by default. If it's deselected, no timestamp information is parsed at all.
- Time Zone. There are two options for Time Zone. You can use the time zone present in your log files, and then choose an option in case time zone information is missing from a log message. Or, you can have Sumo Logic completely disregard any time zone information present in logs by forcing a time zone. It's very important to have the proper time zone set, no matter which option you choose. If the time zone of logs cannot be determined, Sumo assigns logs UTC; if the rest of your logs are from another time zone your search results will be affected.
- Timestamp Format. By default, Sumo will automatically detect the timestamp format of your logs. However, you can manually specify a timestamp format for a Source. See Timestamps, Time Zones, Time Ranges, and Date Formats for more information.
- Create any processing rules you'd like for the new Source.
- When you are finished configuring the Source, click Save.
You can return to this dialog and edit the settings for the Source at any time.
Configure forwarding to a Syslog Source
In addition to configuring the Syslog Source on an Installed Collector to receive syslog data from hosts in your environment, you must also configure those hosts to send the syslog data to the Source. The process for doing so depends on the syslog agent on your operating system. MacOS and Linux each have a built-in syslog agent. Windows does not include a syslog agent, but a number of third-party syslog agents for Windows are available.
You configure a syslog agent by editing its configuration file. For the built-in syslog agent on LInux and MacOS, the configuration file is typically /etc/syslog.conf. If you use a different syslog implementation, the name of the configuration file may be different.
Each line in the configuration file contains two items: the selector, which specifies the messages to be sent and the action which specifies what to do with matching messages. For example:
facility.level action
In the syslog configuration file, facility.level and action must be separated by a tab, not spaces.
-
facility.levelis the selector.facilityis the syslog message facility, which identifies the type of software that generated the message. Default syslog message facilities are –auth,authpriv,daemon,cron,ftp,lpr,kern,mail,news,syslog,user, andlocal0–local7.levelindicates message severity:emerg,alert,crit,err,warn,notice,info, ordebug. The syslog agent will send messages with the specified severity level and higher. For example, if you specifiedauth.crit, you would get messages from the authorization system whose severity isemerg,alert, andcrit. If you want to get messages of certain severity only, prefix the severity with an equals sign, for exampleauth.=crit
-
actionspecifies what to do with the messages. There are a variety of types of actions you can specify. For the purpose of this procedure, you’ll useactionto specify the address of the collector where you configured the Syslog Source. To send messages via UDP, use this format:@IP_address. To send messages via TCP, use this format:@@IP_address. If you have configured the Sumo Source to list on a port other than 514, specify the port as well, like this:@IP_address:port.
Examples
The following line causes messages from all facilities whose severity is crit or higher to be sent via UDP to port 514 on the host whose IP address is 168.191.5.65. (Because port is not specified messages will be sent to the default syslog port, which is 514.)
*.crit @168.191.5.65
The following line causes messages whose severity is crit or higher from all facilities to be sent via UDP to port 514 on the host whose IP address is 168.191.5.65.
*.crit @168.191.5.65:514
The following line causes messages whose severity is crit or higher from the auth facility to be sent via UDP to port 514 on the host whose IP address is 168.191.5.65.
auth.crit @168.191.5.65:514
The following line causes messages whose severity is crit or higher from the auth facility, and messages of all severity levels from the ftp facility to be sent via TCP to port 514 on the host whose IP address is 168.191.5.65.
auth.crit;ftp.* @@168.191.5.65:514
Choosing TCP or UDP
When you configure a syslog source, you choose a transfer protocol, either TCP or UDP. If your syslog-enabled hosts or devices have already been configured using TCP or UDP, choose the same protocol. If you are just setting up your devices, your first choice should probably be TCP.
TCP includes a guaranteed delivery mechanism, meaning that the network layer provides that all of your logs arrive at the Sumo collector in order and without any dropped log messages. The downside of this protocol is that it creates more network and CPU overhead than the alternative UDP protocol. However, due to its reliability guarantee, TCP is the recommended protocol unless you have network and CPU utilization concerns that you need to work around due to an extremely high volume of log messages.
The collector supports single-line TCP messages up to 65,535 bytes.
UDP is a streaming protocol that makes no guarantees of delivery, and as such, log messages may be dropped or arrive out of order. However, in return for this lack of guarantee, UDP does not create the same kind of network and CPU overhead that is created by the TCP protocol. In reality, in most networks, UDP is reliable enough for mission-critical use, however, there may be situations where network traffic storms might cause messages to be dropped or arrive out of order. If this is an unacceptable risk for you, then choose TCP.
Per RFC 5426, the collector by default supports UDP messages up to 2048 bytes. To increase the UDP message length limit to the maximum datagram size (65k) you can modify the collector.properties file.
First, stop the Collector service, then add the following configuration to collector/config/collector.properties and start the collector:
collector.syslog.udp.readBufferSize = 65535
Specify the network interface
When configuring a Syslog Source on a computer that has more than one network interface you can specify which network interface the Collector should bind to. This option is set in the collector.properties file.
To specify the network interface:
- Configure the Syslog Source.
- Navigate to
collector/config/collector.properties. Open the file in a text editor. - Add
syslog.hostname=your_host_namewhereyour_host_nameidentifies the network interface you'd like to use. - Save and close the file.
- Restart the Collector.
TLS Syslog Data
The Collector does not support receiving TLS syslog data directly with a Syslog Source. You need to set up an intermediary service to receive the TLS data and then forward the plain text to the Syslog Source. An alternative to using syslog-ng or rsyslog for this is to use stunnel. As described on https://www.stunnel.org, "Stunnel is a proxy designed to add TLS encryption functionality to existing clients and servers without any changes in the programs' code."
Download from https://www.stunnel.org/downloads.html. Or, on CentOS/RedHat, you can run the following command to install stunnel:
> yum install stunnel
Once installed, generate a key/cert on the host, and then use a stunnel config similar to the following to proxy the syslog data:
cert = /etc/stunnel/stunnel.pem
sslVersion = TLSv1.2
chroot = /var/run/stunnel/
setuid = nobody
setgid = nobody
pid = /stunnel.pid
socket = l:TCP_NODELAY=1
socket = r:TCP_NODELAY=1
output = stunnel.log
client = no
[syslog]
accept = 1543
connect = 1514
In this example, we're listening for incoming TLS connections on the host port 1543/TCP ("accept = 1543"). Then this forwards the plain text data to port 1514/TCP, ("connect = 1514") or the port defined in the Collector Syslog config, via the loop back.
- Your Collector Syslog source must be configured to listen over TCP for this proxy to work correctly.
- The example uses
sslVersion = TLSv1.2Check that your SSL version works properly.
Find more information on Stunnel and its available configuration options, see https://www.stunnel.org/docs.html.
Use IPv4 by default
To force the JVM to default to IPv4, you can add an optional Java parameter to the Wrapper configuration file:
- Open
/Sumo Logic Collector/config/wrapper.conf ~line 69, under # Java Additional Parameters. - Add the following line:
wrapper.java.additional.3=-Djava.net.preferIPv4Stack=true - Restart the Collector, use:
./collector restart.
Alternatively, you can turn off IPv6 completely using these steps:
- Use the following command to access the file:
sudo gedit /etc/sysctl.conf - Add the following lines to the end of the file:
# IPv6 disabled
net.ipv6.conf.all.disable_ipv6 = 1
net.ipv6.conf.default.disable_ipv6 = 1
net.ipv6.conf.lo.disable_ipv6 = 1 - Run this command to reload sysctl settings. It will apply the changes immediately:
sysctl -p.
Troubleshooting Syslog Sources
If data is not being ingested into your syslog source, you may need to add firewall rules to allow inbound traffic on the port that the collector is listening on.
These steps can help identify the problem:
-
Use netstat to verify that Sumo is listening on the port. Once the Syslog source is configured, verify on the collector host that there is a listen process on the configured port in the output of "netstat -nap". If there is no Sumo process listening on the configured protocol (TCP/UDP) and port, it could be that the Sumo process could not bind to the port because another process was using the port. In this case, a collector log message will indicate that the Sumo process failed to bind to the port.
-
Push test messages using netcat. Use netcat to push data to the port using a chat session. Netcat is a networking utility with a simple interface that you can use to read and write from TCP and UDP sockets. Netcat is not included by default; you can download it here.
Sample commands to set up the client are shown below. If you are running the command on the host where the collector runs, replace
"<ip_address>"with"localhost".This example tests messages over TCP on Windows.
ncat.exe -v <ip_address> 1514This example tests messages over UDP on Windows.
ncat.exe -vu <ip_address> 1514This example tests messages over TCP on Linux.
nc -v <ip_address> 1514This example tests messages over UDP on Linux.
nc -vu <ip_address> 1514Once the client is started with one of the above commands you can enter a message in the command line and press enter/return to send the message. For example,
ubuntu@ubuntu:~$ nc localhost 12345
hey
how are you? -
Verify ingestion of test messages and check for timestamp issues: Check the Sumo Search page to make sure that the data pushed in the chat interface is available.
If the messages are available in the Sumo Search page, that indicates that the Syslog Source is working as expected. In this case, the problem might be that data is not reaching the Syslog-configured port from the original Syslog clients or from a load balancer.
Also, check the Use Receipt Time box next to the Start button on the Search page. The Syslog source is configured to use UTC time by default. Because your test messages do not have a timestamp, Sumo will interpret the logs as UTC, and the search won't include the results in the default Last 15 Minute timeframe.
-
Check for firewall issues if test messages are ingested but not data from the Source. If ncat data pushed from the local host where the collector runs is ingested, but ncat data pushed from a remote host is not ingested, that could mean that a firewall rule is blocking the external data from being received on the host (or sometimes is received on the host but not by the process) where the collector is running. You may need to add firewall rules (or remove firewall exceptions, as the case may be) to allow inbound traffic on the port where the collector is listening.
-
If all is good but data is not ingested, data check for CR LF. Note that if the Syslog data is missing any carriage return or LineFeed characters (CR LF or \r \n), that would result in the following message in the collector logs because we would listen to the connection and would wait out till we timeout (typically 2 minutes till timeout) expecting an end of line character. The fix is to make sure the syslog data includes CR LFs.
2017-05-07 17:20:08,293 -0500 [Thread-2875] ERROR com.sumologic.scala.collector.input.syslog.EventInput - Received event: Exception. server com.sumologic.scala.collector.input.syslog.TCPSyslogServer@45424f69, socketAddress /172.21.36.28:60097 java.net.SocketTimeoutException: Read timed out
Error messages
For the Syslog source, the installed collector sends a heartbeat at regular intervals and marks the collector health as healthy or unhealthy.
Errors, if any, are reported in collector.out.log log file.