Automation Payload Variables
Automated playbooks can be invoked by a monitor, as described in Automated Playbooks in Monitors. A payload is passed from the alert to the playbook. The variables in the payload can be assigned to parameters and used as inputs for different actions in the playbook.
Payload variables
The below variables are passed in the payload from an alert to a playbook. The fields specific to the query that triggered the alert can be referenced by using customPlaceholderMap. For example, if the result of the query includes a field named user_name, this can be referenced by called customPlaceholderMap[].user_name.
| Variable | Description |
|---|---|
Id | The unique identifier for alert that triggered the playbook. |
Name | The name of the monitor. |
Query | The query used in the monitor. |
QueryURL | The URL to the logs or metrics query within Sumo Logic. |
AlertName | The name of the alert. |
SourceURL | The URL to the configuration or status page of the monitor in Sumo Logic. |
AlertGroup | The alert grouping that triggered the alert, including associated values for that field. |
Description | The description of the monitor. |
MonitorType | The type of alert, either Logs or Metrics. |
ResultsJson | JSON object containing the query results that triggered the alert. |
TriggerTime | The date and time the query triggered the alert. |
TriggerType | The status of the alert or recovery. Alert will have either Normal, Critical, Warning, or Missing Data. Recovery will have either ResolvedCritical, ResolvedWarning, or ResolvedMissingData. |
TriggerValue | The value that triggered the alert. |
Notifications | The details for the notifications configured in the monitor. |
NumRawResults | Number of results returned by the search. |
DetectionMethod | The type of detection method used to detect alerts. Values are based on static or outlier triggers and data type, either logs or metrics. The value will be either LogsStaticCondition, MetricsStaticCondition, LogsOutlierCondition, MetricsOutlierCondition, LogsMissingDataCondition, or MetricsMissingDataCondition. |
NumQueryResults | The number of results the query returned. |
SloDashboardURL | The URL to the SLO dashboard. |
TriggerQueryURL | The URL to the log search for the query that triggered the alert. |
AlertResponseURL | The URL to the alert page for the corresponding alert ID. |
TriggerCondition | The condition that triggered the alert. |
TriggerTimeRange | The time range of the query that triggered the alert. |
ResultsJsonParsed | The parsed fields from ResultsJson. |
AggregateResultsJson | JSON object containing the query results that triggered the alert, along with aggregate values such as message count. |
customPlaceholderMap | The parsed fields from ResultsJson and the aggregate values returned from the query. |
AggregateResultsJsonParsed | The parsed fields from AggregateResultsJson. |
Example payload
{
  "Id": "00000000016CCCDD",
  "Name": "Amazon Guard Duty Brute Force",
  "Query": "_sourceCategory=Labs/AWS/GuardDuty_V3 | parse \"{\\\"key\\\":\\\"Owner\\\",\\\"value\\\":\\\"*\\\"}\" as owner_key | json field=_raw \"service.action.networkConnectionAction.remotePortDetails.portName\"as port_name | json field=_raw \"service.action.networkConnectionAction.remotePortDetails.port\" as port | json field=_raw \"service.action.networkConnectionAction.remoteIpDetails.ipAddressV4\" as ip_address | json field=_raw \"accountId\", \"region\", \"partition\", \"id\", \"arn\", \"type\",\"service.serviceName\",\"service.detectorId\",\"service.action\",\"severity\",\"title\",\"description\", \"vpcId\", \"subnetId\", \"groupId\" , \"tags\", \"groupName\", \"resource.instanceDetails.instanceId\" as account_id, region, partition, id, arn, type, service_name, detector_id, action, severity, title, description, vpcId, subnetId , securityGroupId, tags, securityGroupName, instanceid nodrop  | where type matches \"*BruteForce*\" | count by instanceid, ip_address, port, port_name, owner_key",
  "QueryURL": "https://live.us2.sumologic.com/ui/index.html#/search/1IzrB2mrW6L7egF1GY3zwnqJW663xPamyh9oe1AcFBanRckiRpXQiuPU2hOngFWnHO9bOLhpZ1GnssHTKtQpcLPBAOBp8wwW9VerT83Fj77k6hXQqMl5lI3tqsPv5bMG",
  "AlertName": "Amazon GuardDuty Brute Force Finding",
  "SourceURL": "https://live.us2.sumologic.com/ui/#/alerts/unified-monitors/00000000000007A0?selectedRows=0000000000593B6D",
  "AlertGroup": "instanceid=i-F56tg45tty5gfgd45",
  "Description": "",
  "MonitorType": "Logs",
  "ResultsJson": "[{\"Count\":1,\"instanceid\":\"i-F56tg45tty5gfgd45\",\"ip_address\":\"78.24.180.93\",\"owner_key\":\"security@lxechip.com\",\"port\":\"22\",\"port_name\":\"SSH\"}]",
  "TriggerTime": "05/01/2024 02:08:46 PM CDT",
  "TriggerType": "Critical",
  "TriggerValue": 1,
  "Notifications": [
    {
      "notification": {
        "images": [],
        "subject": "Monitor Alert: {{TriggerType}} on {{AlertName}}",
        "actionId": -4194941809035894000,
        "jsonClass": "EmailAction",
        "ccRecipients": [],
        "templateName": "Default Unified Monitor Email With Alert Response Variables",
        "toRecipients": [
          "example@sumologic.com"
        ],
        "bccRecipients": [],
        "relatedContent": [],
        "emailBodyMessage": ""
      },
      "runForTriggerTypes": [
        "Critical"
      ]
    }
  ],
  "NumRawResults": "45",
  "DetectionMethod": "LogsStaticCondition",
  "NumQueryResults": "1",
  "SloDashboardURL": "",
  "TriggerQueryURL": "https://live.us2.sumologic.com/ui/index.html#/search/1IzrB2mrW6L7egF1GY3zwnqJW663xPamyh9oe1AcFBanRckiRpXQiuPU2hOngFWnHO9bOLhpZ1GnssHTKtQpcLPBAOBp8wwW9VerT83Fj77k6hXQqMl5lI3tqsPv5bMG",
  "AlertResponseURL": "https://live.us2.sumologic.com/ui/#/alert/00000000016CCCDD",
  "TriggerCondition": "ResultCount is Greater than 0.0 in the last 1440 minutes",
  "TriggerTimeRange": "04/30/2024 02:06:46 PM CDT to 05/01/2024 02:06:46 PM CDT",
  "ResultsJsonParsed": [
    {
      "port": "22",
      "Count": 1,
      "owner_key": "security@example.com",
      "port_name": "SSH",
      "instanceid": "i-F56tg45tty5gfgd45",
      "ip_address": "78.24.180.93"
    }
  ],
  "AggregateResultsJson": "[{\"Count\":1,\"instanceid\":\"i-F56tg45tty5gfgd45\",\"ip_address\":\"78.24.180.93\",\"owner_key\":\"security@lxechip.com\",\"port\":\"22\",\"port_name\":\"SSH\"}]",
  "customPlaceholderMap": [
    {
      "port": "22",
      "Count": "1",
      "_count": "1",
      "owner_key": "security@example.com",
      "port_name": "SSH",
      "instanceid": "i-F56tg45tty5gfgd45",
      "ip_address": "78.24.180.93"
    }
  ],
  "AggregateResultsJsonParsed": [
    {
      "port": "22",
      "Count": 1,
      "owner_key": "security@example.com",
      "port_name": "SSH",
      "instanceid": "i-F56tg45tty5gfgd45",
      "ip_address": "78.24.180.93"
    }
  ]
}
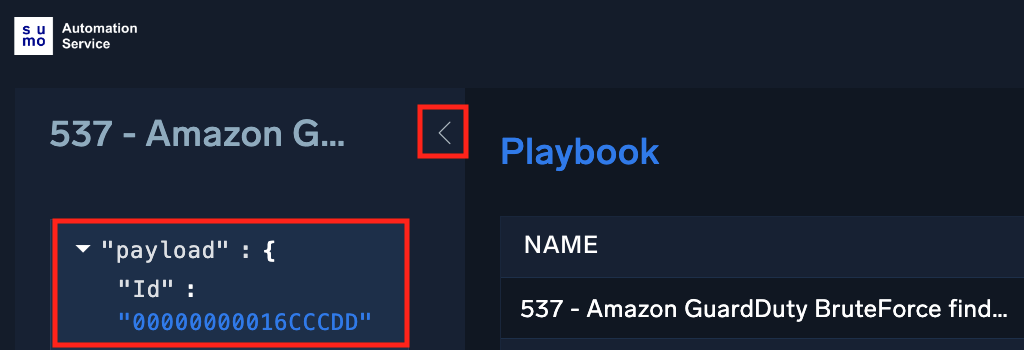
View playbook payload
To view the variables available from an alert that triggered a playbook:
- View the automated playbooks for an alert.
- Expand the playbook name to view the payload.