Set up Traces Collection for Other Environments
Sumo Logic leverages OpenTelemetry standards for trace collection. To gather the spans generated by tracing clients, follow the instructions at Instrument your application with OpenTelemetry.
Additionally, you'll need to run the OpenTelemetry Collector instance. It receives and buffers data, optionally attaches metadata tags, and pushes them to a Sumo Logic Hosted Collector endpoint that resides in the cloud.
Preparation
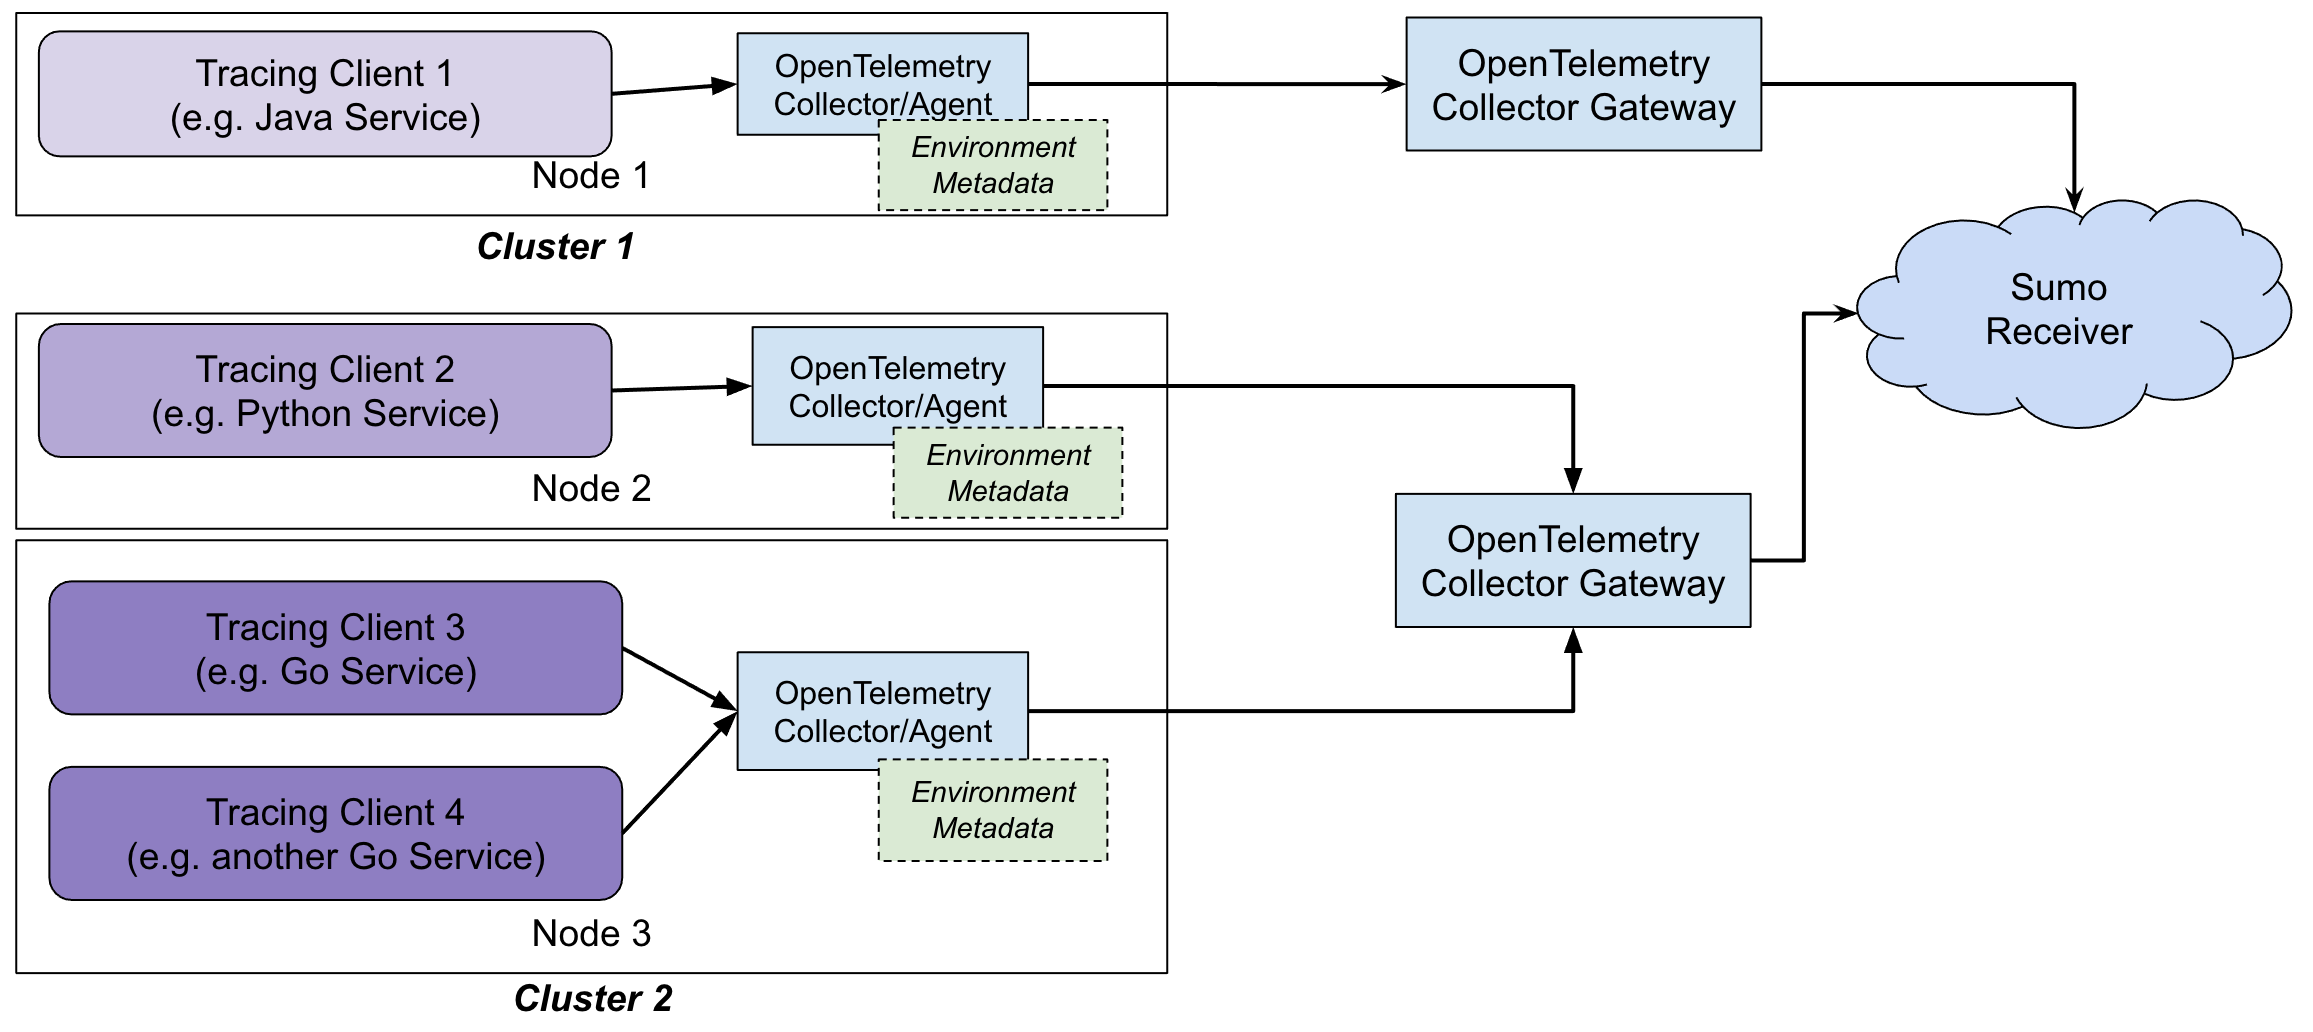
Depending on the architecture of the environment, OpenTelemetry Collector can be run in two types of deployment scenarios:
- a gateway that retrieves all data, processes it and sends it to the backend (Sumo Logic Receiver)
- an optional (though recommended) Agent, which can be run on each node or as a sidecar next to the service; it buffers and tags spans, sending them to the gateway
Due to the fact that vital metadata (information about the host and its OS) is available only for collectors inside individual node/host, we recommend that instances of OpenTelemetry Collector should be run at least on each of the nodes/hosts as agents. Doing so allows you to collect metadata tags locally and also in case of high volume environments, to buffer the messages, reducing the number of requests for each individual collector instance.
Prerequisites
| Account Type | Account Level |
|---|---|
| Credits | Enterprise Operations and Enterprise Suite Essentials get up to 5 GB a day |
Installation steps for OpenTelemetry Collector Gateway
Step 1 - Generating OTLP/HTTP Endpoint
Create new OTLP/HTTP source.
Step 2 - Prepare config file
config.yaml for OpenTelemetry Collector Gateway:
Use the sample gateway configuration template available at GitHub and apply the following changes:
- ENDPOINT_URL needs to be replaced with the value retrieved in Step 1.
Save the file as config.yaml. This file name will be used in next step. If you use a different filename, make note of that name.
Step 3 - Prepare the OpenTelemetry Collector binaries and run them
As spans are sent over TCP or UDP connections, the OpenTelemetry Collector service needs to have relevant ports exposed. You will use the
config file (config.yaml) you set up in Step 2.
The templates provided above support the following protocols:
- OTLP/HTTP on port 4318
- OTLP/gRPC on port 4317
- Zipkin/HTTP on port 9411
- Jaeger/gRPC on port 14250
- Jaeger/HTTP on port 14268
- Jaeger/Compact on port 6831 (UDP)
- OpenCensus on port 55678
Option 1: Containerized environments�
A published Docker image could be used:
public.ecr.aws/sumologic/sumologic-otel-collector:0.97.0-sumo-1
For example:
docker run --rm -p 4317:4317 -p 4318:4318 -p 9411:9411 -p 6831:6831/udp -p 14250:14250 \
-p 14268:14268 -p 55678:55678 -v "${PWD}/config.yaml":/conf/config.yaml \
public.ecr.aws/sumologic/sumologic-otel-collector:0.97.0-sumo-1 \
--config=/conf/config.yaml
Option 2: Non-containerized environments
For non-containerized environments, a binary can be downloaded from the project repository available under https://github.com/SumoLogic/sumologic-otel-collector/releases and run on a given node with the appropriate config, such as:
otelcol-sumo-0.97.0-sumo-1-darwin_amd64 --config=config.yaml
Step 4 - Connecting clients to OpenTelemetry Collector Gateway (if Agent is not used)
During instrumentation of your application, typically you need to configure collector endpoint and protocol.
OpenTelemetry tracing client libraries need to point spans accordingly to the protocol used. When a direct connection to OpenTelemetry Collector Gateway is used, the following settings can be used:
- OTLP (HTTP):
http://HOSTNAME:4318 - OTLP (gRPC):
http://HOSTNAME:4317 - Jaeger GRPC:
http://HOSTNAME:14250 - Jaeger Thrift HTTP:
http://HOSTNAME:14268 - Jaeger Thrift Compact (UDP):
HOSTNAME:6831 - Zipkin:
http://HOSTNAME:9411/api/v2/traces - OpenCensus:
http://HOSTNAME:55678
Replace HOSTNAME with the host where the OpenTelemetry Collector/Agent is accessible. For example, this might be localhost or another address on the local node, depending on how the Agent was deployed.
Installation steps for OpenTelemetry Collector Agent
With OpenTelemetry Collector Gateway running, you can run the agents, to which clients connect locally and agents buffer, tag, and pass the data to the gateway. There are several ways to run the agent. It can be a sidecar, running together with the process in the same container. Or it could be another service deployed on each of the nodes.
Step 1 - Prepare config file
Please use the template config file available at GitHub and make the following change (and others, as required):
- HOSTNAME needs to be replaced with the address of the OpenTelemetry Collector Gateway installed in the previous section.
Please save the file as agent-config.yaml
Step 2 - Prepare the OpenTelemetry Collector binaries and run them
OpenTelemetry Collector is using the same binary regardless if it's running in Gateway or Agent mode.
Option 1: Containerized environments
A published Docker image could be used: public.ecr.aws/sumologic/sumologic-otel-collector:0.97.0-sumo-1
For example:
docker run --rm -p 4317:4317 -p 4318:4318 -p 9411:9411 -p 6831:6831/udp -p 14250:14250 \
-p 14268:14268 -p 55678:55678 -v "${PWD}/agent-config.yaml":/conf/config.yaml \
public.ecr.aws/sumologic/sumologic-otel-collector:0.97.0-sumo-1 \
--config=/conf/config.yaml
Option 2: Non-containerized environments
For non-containerized environments, a binary can be downloaded from the project repository available under https://github.com/SumoLogic/sumologic-otel-collector/releases/ and run on a given node with the appropriate config, such as:
otelcol-sumo-0.97.0-sumo-1-darwin_amd64 --config agent-config.yaml
Step 3 - Connecting clients to OpenTelemetry Collector Agent
During instrumentation of your application, typically you need to configure collector endpoint and protocol.
Tracing client libraries need to point spans accordingly to the protocol used:
- OTLP (HTTP): http://AGENT_HOSTNAME:4318
- OTLP (gRPC): http://AGENT_HOSTNAME:4317
- Jaeger GRPC: http://AGENT_HOSTNAME:14250
- Jaeger Thrift HTTP: http://AGENT_HOSTNAME:14268
- Jaeger Thrift Compact (UDP):
AGENT_HOSTNAME:6831 - Zipkin: http://AGENT_HOSTNAME:9411/api/v2/traces
- OpenCensus: http://AGENT_HOSTNAME:55678
Please fill AGENT_HOSTNAME with the actual address of the sidecar/instance of Sumo Logic OpenTelemetry Collector Agent on a given node (run in the previous step). Frequently this will be localhost.