AWS Elastic Load Balancer - Classic

The Amazon Web Services (AWS) Elastic Load Balancer - Classic distributes incoming application traffic across multiple Amazon EC2 instances in the AWS Cloud. The Sumo Logic App for Elastic Load Balancer - Classic ingests logs generated by this activity, providing greater visibility into events that, in turn, help you understand the overall health of your EC2 deployment.
For example, you can use the Sumo Logic App to analyze raw Elastic Load Balancing data to investigate the availability of applications running behind Elastic Load Balancers. Or, by correlating Elastic Load Balancer data with other data sets, you can get a broader understanding of the fault tolerance of your applications across multiple AWS Availability Zones.
If you are just beginning with AWS ELB, for background see the Sumo Logic DevOps blog, "AWS Elastic Load Balancing: Load Balancer Best Practices".
Log types
ELB logs are stored as .log files in the buckets you specify when you enable logging.
The process to enable collection for these logs is described in AWS ELB Enable Access Logs.
The logs themselves contain these fields in this order:
datetime, ELB_Server, clientIP, port, backend, \
backend_port, requestProc, ba_Response, cli_Response, \
ELB_StatusCode, be_StatusCode, rcvd, send, method, \
protocol, domain, server_port, path
The log format is described in AWS ELB Access Log Collection. For information on unified logs and metrics for AWS Elastic Load Balancing - Classic, see AWS Elastic Load Balancing ULM - Classic.
Prerequisites
Follow the below section, and then use the in-product instructions in Sumo Logic to set up the app. For information on collecting unified logs and metrics for AWS Elastic Load Balancing - Classic, see AWS Elastic Load Balancing ULM - Classic.
- Enable Elastic Load Balancing logging in your AWS account and configure a Sumo Logic ELB Source using these instructions.
- If you have more than one environment that generates Elastic Load Balancing data (such as ops, dev, and so on), you’ll need to configure a separate S3 Source for each environment. This means that you’ll have the three App Dashboards for each environment. To avoid confusion, and in order to identify which environment is generating data, you should name each S3 Source with the environment's name. For example, you might name Sources as ELB-prod, ELB-dev, ELB-test, and so on.
- Finally, make copies of each Panel in the Elastic Load Balancing Dashboards, and modify the search logic in each Panel so that you select the appropriate source for each environment. For example, for a production environment, you will add the string
_source=ELB-productionto the beginning of each search. If you have three environments then you will have three copies of the application for each of them (nine dashboards in total).
Collecting Logs for the AWS Elastic Load Balancing - Classic App��
This procedure shows how to enable access to your Amazon Web Services (AWS) Elastic Load Balancing (ELB) logs and ingest them into Sumo Logic.
Once you begin uploading data, your daily data usage will increase. It's a good idea to check the Account page in Sumo Logic to make sure that you have enough quota to accommodate additional data in your account. If you need additional quota you can upgrade your account at any time.
Configure a Collector
Configure a Hosted Collector.
Configure an ELB Source
When you create an AWS Source, you'll need to identify the Hosted Collector you want to use or create a new Hosted Collector. Once you create an AWS Source, associate it with a Hosted Collector. For instructions, see Configure a Hosted Collector.
Rules
- If you're editing the
Collection should begindate on a Source, the new date must be after the currentCollection should begindate. (Note that if you set this property to a collection time that overlaps with data that was previously ingested on a source, it may result in duplicated data to be ingested into Sumo Logic.) - Sumo Logic supports log files (S3 objects) that do NOT change after they are uploaded to S3. Support is not provided if your logging approach relies on updating files stored in an S3 bucket. S3 does not have a concept of updating existing files, you can only overwrite an existing file. When this overwrite happens, S3 considers it as a new file object, or a new version of the file, and that file object gets its own unique version ID.
- Sumo Logic scans an S3 bucket based on the path expression supplied, or receives an SNS notification when a new file object is created. As part of this, we receive a file name (key) and the object's ID. It's compared against a list of file objects already ingested. If a matching file ID is not found the contents of the file are ingested in full.
- When you overwrite a file in S3, the file object gets a new version ID and as a result, Sumo Logic sees it as a new file and ingests all of it. If with each version you post to S3 you are simply adding to the end of the file, then this will lead to duplicate messages ingested, one message for each version of the file you created in S3.
- Glacier objects will not be collected and are ignored.
- If you're using SNS you need to create a separate topic and subscription for each Source.
S3 Event Notifications Integration
The Sumo Logic S3 integration combines scan-based discovery and event-based discovery into a unified integration that gives you the ability to maintain a low-latency integration for new content and provide assurances that no data was missed or dropped.
When you enable event-based notifications, S3 will automatically publish new files to Amazon Simple Notification Service (SNS) topics, which Sumo Logic can be subscribed. This notifies Sumo Logic immediately when new files are added to your S3 bucket so we can collect it. For more information about SNS, see the Amazon SNS product docs.
![]()
Enabling event-based notifications is an S3 bucket-level operation that subscribes to an SNS topic. An SNS topic is an access point that Sumo Logic can dynamically subscribe to in order to receive event notifications. When creating a Source that collects from an S3 bucket, Sumo Logic assigns an endpoint URL to the Source. The URL is for you to use in the AWS subscription to the SNS topic so AWS notifies Sumo when there are new files. See Configuring Amazon S3 Event Notifications for more information.
You can adjust the configuration of when and how AWS handles communication attempts with Sumo Logic. See Setting Amazon SNS Delivery Retry Policies for details.
Watch this micro lesson video to learn more about our S3 event notifications integration, which combines scan based discovery and event-based discovery into a unified integration that gives you the ability to maintain a low latency integration for new content and provide assurances that no data was missed or dropped.
Create an AWS Source
These configuration instructions apply to log collection from all AWS Source types.
- In the main Sumo Logic menu, select Manage Data > Collection > Collection.
- On the Collectors page, click Add Source next to a Hosted Collector, either an existing Hosted Collector, or one you have created for this purpose.
- Select your AWS Source type.
- Enter a name for the new Source. A description is optional.
- Select an S3 region or keep the default value of Others. The S3 region must match the appropriate S3 bucket created in your Amazon account.
Selecting an AWS GovCloud region means your data will be leaving a FedRAMP-high environment. Use responsibly to avoid information spillage. See Collection from AWS GovCloud for details.
-
For Bucket Name, enter the exact name of your organization's S3 bucket. Be sure to double-check the name as it appears in AWS, for example:
-
For Path Expression, enter the wildcard pattern that matches the S3 objects you'd like to collect. You can use one wildcard (
*) in this string. Recursive path expressions use a single wildcard and do NOT use a leading forward slash. See About Amazon Path Expressions for details. -
Collection should begin. Choose or enter how far back you'd like to begin collecting historical logs. You can either:
- Choose a predefined value from dropdown list, ranging from "Now" to “72 hours ago” to “All Time”, or
- Enter a relative value. To enter a relative value, click the Collection should begin field and press the delete key on your keyboard to clear the field. Then, enter a relative time expression, for example
-1w. You can define when you want collection to begin in terms of months (M), weeks (w), days (d), hours (h), and minutes (m). If you paused the Source and want to skip some data when you resume, update the Collection should begin setting to a time after it was paused.
noteIf you set Collection should begin to a collection time that overlaps with data that was previously ingested on a source, it may result in duplicated data to be ingested into Sumo Logic.
-
For Source Category, enter any string to tag the output collected from this Source. Category metadata is stored in a searchable field called
_sourceCategory. Some examples:_sourceCategory: aws/observability/alb/logsor_sourceCategory: aws/observability/clb/logs. -
Fields. Click the +Add Field link to add custom log metadata Fields. Define the fields you want to associate, each field needs a name (key) and value. The following Fields are to be added in the source:
- Add an account field and assign it a value which is a friendly name / alias to your AWS account from which you are collecting logs. This name will appear in the Sumo Logic Explorer View. Logs can be queried via the “account field”.
- Add a region field and assign it the value of respective AWS region where the Classic Load Balancer exists.
- Add an accountId field and assign it the value of the respective AWS account id which is being used.
 A green circle with a check mark is shown when the field exists and is enabled in the Fields table schema.
 An orange triangle with an exclamation point is shown when the field doesn't exist, or is disabled, in the Fields table schema. In this case, an option to automatically add or enable the nonexistent fields to the Fields table schema is provided. If a field is sent to Sumo that does not exist in the Fields schema or is disabled it is ignored, known as dropped.
-
For AWS Access, choose between the two Access Method options below, based on the AWS authentication you are providing.
- For Role-based access, enter the Role ARN that was provided by AWS after creating the role. Role-based access is recommended (this was completed in the prerequisite step Grant Sumo Logic access to an AWS Product).
- For Key access, enter the Access Key ID and Secret Access Key. See AWS Access Key ID and AWS Secret Access Key for details.
-
Log File Discovery. You have the option to set up Amazon Simple Notification Service (SNS) to notify Sumo Logic of new items in your S3 bucket. A scan interval is required and automatically applied to detect log files.
- Scan Interval. Sumo Logic will periodically scan your S3 bucket for new items in addition to SNS notifications. Automatic is recommended to not incur additional AWS charges. This sets the scan interval based on if subscribed to an SNS topic endpoint and how often new files are detected over time. If the Source is not subscribed to an SNS topic and set to Automatic the scan interval is 5 minutes. You may enter a set frequency to scan your S3 bucket for new data. To learn more about Scan Interval considerations, see About setting the S3 Scan Interval.
- SNS Subscription Endpoint (recommended option). New files will be collected by Sumo Logic as soon as the notification is received. This will provide faster collection versus having to wait for the next scan to detect the new file. We highly recommend using an SNS Subscription Endpoint for its ability to maintain low-latency collection. This is essential to support up-to-date Alerts. Click the box below to open instructions:
Set up SNS in AWS
The following steps use the Amazon SNS Console. Alternatively, you can instead use AWS CloudFormation (see Using CloudFormation to Set Up an SNS Subscription Endpoint).
- To set up the subscription you need to get an endpoint URL from Sumo to provide to AWS. This process will save your Source and begin scanning your S3 bucket when the endpoint URL is generated. Click Create URL and use the provided endpoint URL when creating your subscription in step 3.
- Go to Services > Simple Notification Service and click Create Topic. Enter a Topic name and click Create topic. Copy the provided Topic ARN, you’ll need this for the next step. Make sure that the topic and the bucket are in the same region.
- Again go to Services > Simple Notification Service and click Create Subscription. Paste the Topic ARN from step 2 above. Select HTTPS as the protocol and enter the Endpoint URL provided while creating the S3 source in Sumo Logic. Click Create subscription and a confirmation request will be sent to Sumo Logic. The request will be automatically confirmed by Sumo Logic.
- Select the Topic created in step 2 and navigate to Actions > Edit Topic Policy. Use the following policy template, replace the
SNS-topic-ARNandbucket-nameplaceholders in theResourcesection of the JSON policy with your actual SNS topic ARN and S3 bucket name:
{
    "Version": "2008-10-17",
    "Statement": [{
        "Effect": "Allow",
        "Principal": {
            "AWS": "*"
        },
        "Action": [
            "SNS:Publish"
        ],
        "Resource": "SNS-topic-ARN",
        "Condition": {
            "ArnLike": {
                "aws:SourceArn": "arn:aws:s3:*:*:bucket-name"
            }
        }
    }]
}- Go to Services > S3 and select the bucket to which you want to attach the notifications. Navigate to Properties > Events > Add Notification. Enter a Name for the event notification. In the Events section select All object create events. In the Send to section (notification destination) select SNS Topic. An SNS section becomes available, select the name of the topic you created in step 2 from the dropdown. Click Save.
-
Set any of the following under Advanced:
- Enable Timestamp Parsing. This option is selected by default. If it's deselected, no timestamp information is parsed at all.
- Time Zone. There are two options for Time Zone. You can use the time zone present in your log files, and then choose an option in case time zone information is missing from a log message. Or, you can have Sumo Logic completely disregard any time zone information present in logs by forcing a time zone. It's very important to have the proper time zone set, no matter which option you choose. If the time zone of logs cannot be determined, Sumo Logic assigns logs UTC; if the rest of your logs are from another time zone your search results will be affected.
- Timestamp Format. By default, Sumo Logic will automatically detect the timestamp format of your logs. However, you can manually specify a timestamp format for a Source. See Timestamps, Time Zones, Time Ranges, and Date Formats for more information.
- Enable Multiline Processing. See Collecting Multiline Logs for details on multiline processing and its options. This is enabled by default. Use this option if you're working with multiline messages (for example, log4J or exception stack traces). Deselect this option if you want to avoid unnecessary processing when collecting single-message-per-line files (for example, Linux system.log). Choose one of the following:
- Infer Boundaries. Enable when you want Sumo Logic to automatically attempt to determine which lines belong to the same message. If you deselect the Infer Boundaries option, you will need to enter a regular expression in the Boundary Regex field to use for detecting the entire first line of multiline messages.
- Boundary Regex. You can specify the boundary between messages using a regular expression. Enter a regular expression that matches the entire first line of every multiline message in your log files.
- Create any Processing Rules you'd like for the AWS Source.
- When you're finished configuring the Source, click Save.
SNS with one bucket and multiple Sources
When collecting from one Amazon S3 bucket with multiple Sumo Sources, you need to create a separate topic and subscription for each Source. Subscriptions and Sumo Sources should both map to only one endpoint. If you were to have multiple subscriptions Sumo would collect your objects multiple times.
Each topic needs a separate filter (prefix/suffix) so that collection does not overlap. For example, the following image shows a bucket configured with two notifications that have filters (prefix/suffix) set to notify Sumo separately about new objects in different folders.
Update Source to use S3 Event Notifications
You can use this community-supported script to configure event-based object discovery on existing AWS Sources.
- In the main Sumo Logic menu, select Manage Data > Collection > Collection.
- On the Collection page navigate to your Source and click Edit. Scroll down to Log File Discovery and note the Endpoint URL provided, you will use this in step 10.C when creating your subscription.
- Complete steps 10.B through 10.E for configuring SNS Notifications.
Troubleshoot S3 Event Notifications
In the Sumo Logic UI, under 'Log File Discovery', there is a red exclamation mark with the message 'Sumo Logic has not received a validation request from AWS'.
Steps to troubleshoot:
- Refresh the Source’s page to view the latest status of the subscription in the SNS Subscription section by clicking Cancel then Edit on the Source in the Collection tab.
- Verify you have enabled sending Notifications from your S3 bucket to the appropriate SNS topic. This is done in step 10.E.
- If you didn’t use CloudFormation, check that the SNS topic has a confirmed subscription to the URL in AWS console. A "Pending Confirmation" state likely means that you entered the wrong URL while creating the subscription.
In the Sumo Logic UI, under 'Log File Discovery', there is a green check with the message 'Sumo Logic has received an AWS validation request at this endpoint', but still high latencies.
The green check confirms that the endpoint was used correctly, but it does not mean Sumo Logic is receiving notifications successfully.
Steps to troubleshoot:
- AWS writes CloudTrail and S3 Audit Logs to S3 with a latency of a few minutes. If you’re seeing latencies of around 10 minutes for these Sources it is likely because AWS is writing them to S3 later than expected.
- Verify you have enabled sending Notifications from your S3 bucket to the appropriate SNS topic. This is done in the Fields step of Create an AWS Source.
Field Extraction Rules
For Field Extraction Rules, use the source category established earlier.
parse "* * *:* *:* * * * * * * * \"* *://*:*/* HTTP" as datetime, ELB_Server, clientIP, port, backend, backend_port, requestProc, ba_Response, cli_Response, ELB_StatusCode, be_StatusCode, rcvd, send, method, protocol, domain, server_port, path
Sample log messages
2017-01-20T23:00:26.059475Z elb-shop-com 10.15.120.181:80 10.34.7.122:80 0.000026
0.315185 0.000027 200 200 51 1230 "POST https://examplesite.com:443/Common/path HTTP/1.1"
"Mozilla/5.0 (Safari; Touch) AppleWebKit/537.35+ (HTML, like Gecko) Version/10.3.2.2239
Mobile Safari/517.35+"
Sample queries
_sourceCategory=elb*
| parse "* * *:* *:* * * * * * * * \"* *://*:*/* HTTP" as f1, elb_server, clientIP, port, backend, backend_port, requestProc, ba_Response, cli_Response, ELB_StatusCode, be_StatusCode, rcvd, send, method, protocol, domain, server_port, path nodrop
| parse "* * *:* *:* * * * * * * * \"-" as f1,elb_server,clientIP,port,backend,backend_port,requestProc,ba_Response,cli_Response,ELB_StatusCode,be_StatusCode,rcvd,send
| lookup latitude, longitude, country_code, country_name, region, city, postal_code, area_code, metro_code from geo://default on ip = clientIP
| count by latitude, longitude, country_code, country_name, region, city, postal_code, area_code, metro_code
| sort _count
Installing the AWS Elastic Load Balancer Classic App
Now that you have set up collection for AWS ELB, install the Sumo Logic App for AWS Elastic Load Balancer - Classic to use the preconfigured searches and dashboards to analyze your data.
To install the app:
- Select App Catalog.
- In the Search Apps field, search for and then select your app.
- Optionally, you can scroll down to preview the dashboards included with the app. Then, click Install App (sometimes this button says Add Integration).
note
If your app has multiple versions, you'll need to select the version of the service you're using before installation.
- On the next configuration page, under Select Data Source for your App, complete the following fields:
- Data Source. Select one of the following options:
- Choose Source Category and select a source category from the list; or
- Choose Enter a Custom Data Filter, and enter a custom source category beginning with an underscore. For example,
_sourceCategory=MyCategory.
- Folder Name. You can retain the existing name or enter a custom name of your choice for the app.
- All Folders (optional). Default location is the Personal folder in your Library. If desired, you can choose a different location and/or click New Folder to add it to a new folder.
- Data Source. Select one of the following options:
- Click Next.
- Look for the dialog confirming that your app was installed successfully.
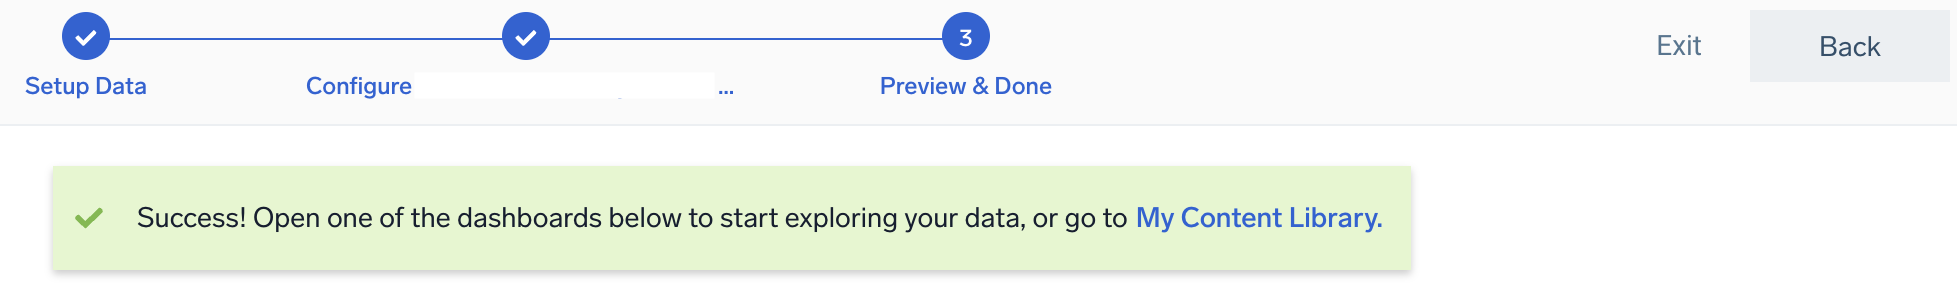
Once an app is installed, it will appear in your Personal folder or the folder that you specified. From here, you can share it with other users in your organization. Dashboard panels will automatically start to fill with data matching the time range query received since you created the panel. Results won't be available immediately, but within about 20 minutes, you'll see completed graphs and maps.
What if data isn't displaying in all Panels?
Amazon S3 buckets are scanned for new files according to the Scan Interval you set when configuring the S3 Source used for AWS Elastic Load Balancing logs. Even if you set a shorter Scan Interval, say five minutes, if no new files are found, the Scan Interval is automatically doubled, up to 24 hours (you can read more in Set the S3 Source Scan Interval). If the Scan Interval increases, it means that a Panel set to a 60-minute time range may not find any data to display, because no files have uploaded to Sumo Logic. This isn't to say that no data is being collected from your S3 bucket; you can confirm that data is being collected on the Status page.
Additionally, you can change the time range of a Panel. Even though these Panels have been preconfigured, they can be edited just like any other Panel. You'll find instructions in Changing the time range of a Panel.
Viewing the AWS Elastic Load Balancer Classic Dashboards
The Sumo Logic App for AWS Elastic Load Balancing helps you monitor the overall health of your ELB deployment. Dashboards keep an eye on errors being generated by back-end applications as well as errors generated from ELB instances.
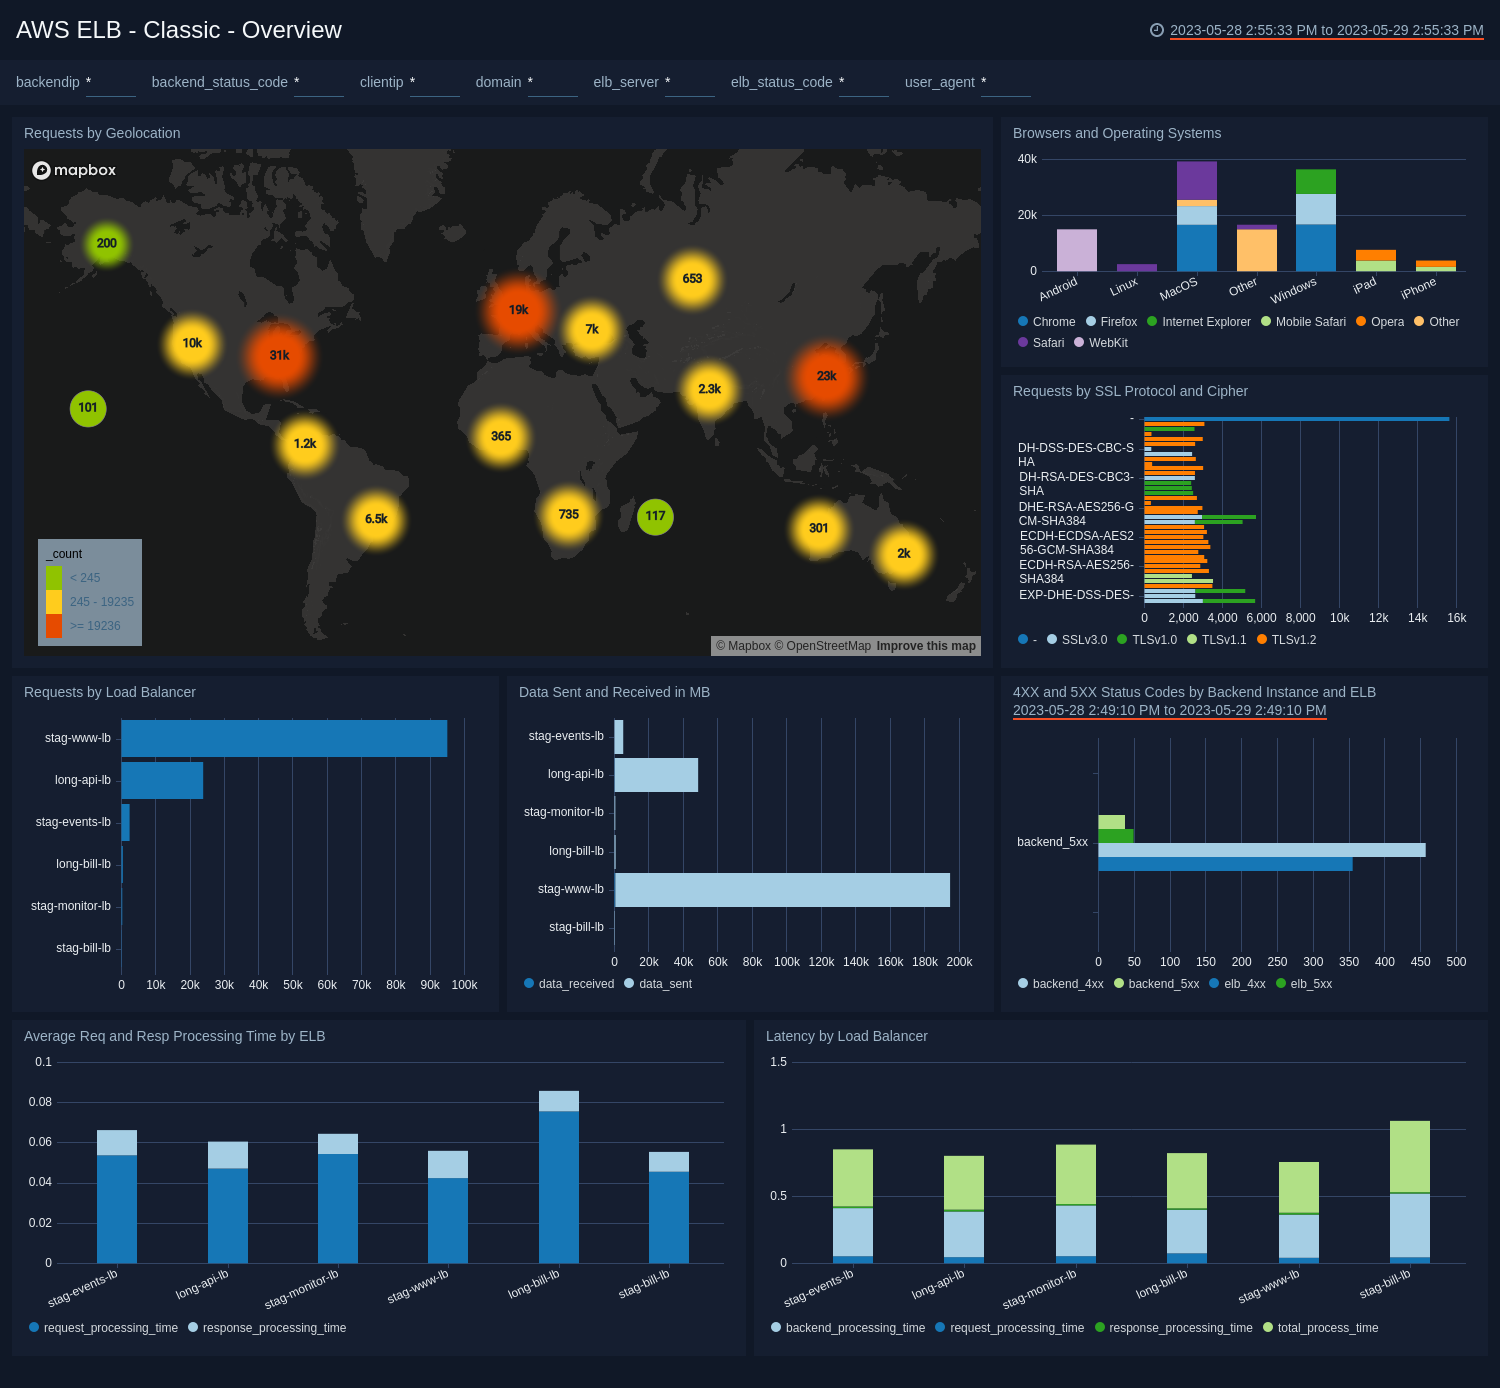
Overview
Track your Elastic Load Balancer activity at a glance to identify areas for further investigation such as requests by geolocation, browsers most frequently used, requests by protocol and cipher, which load balancers make the most requests, data sent and received, status codes, response times, and latencies.
- Requests by Geolocation. Uses a geolocation query to display a map of the IP addresses used by clients accessing your apps for the last three hours.
- Browsers and Operating Systems. See requests by browser used, broken down by operating system for the last three hours.
- Requests by SSL Protocol and Cipher. See which version of TSL or SSL is being used by requests, broken down by which cryptographic cipher was used for the last three hours.
- Requests by Load Balancer. See how many requests are hitting a load balancer for the last three hours.
- Data Sent and Received in MB. Compare the data being sent and received by client IP in a bar chart for the last three hours.
- 4XX and 5XX Status Codes by Backend Instance and ELB. Charts the number of 4XX and 5XX status codes for each backend instance and ELB in a bar chart over the last 24 hours.
- Average Req and Resp Processing Time by ELB. Compare the request and response time for each ELB for the last three hours.
- Latency by Load Balancer. See the latency of each load balancer in AWS in a stacked column chart for the last three hours.
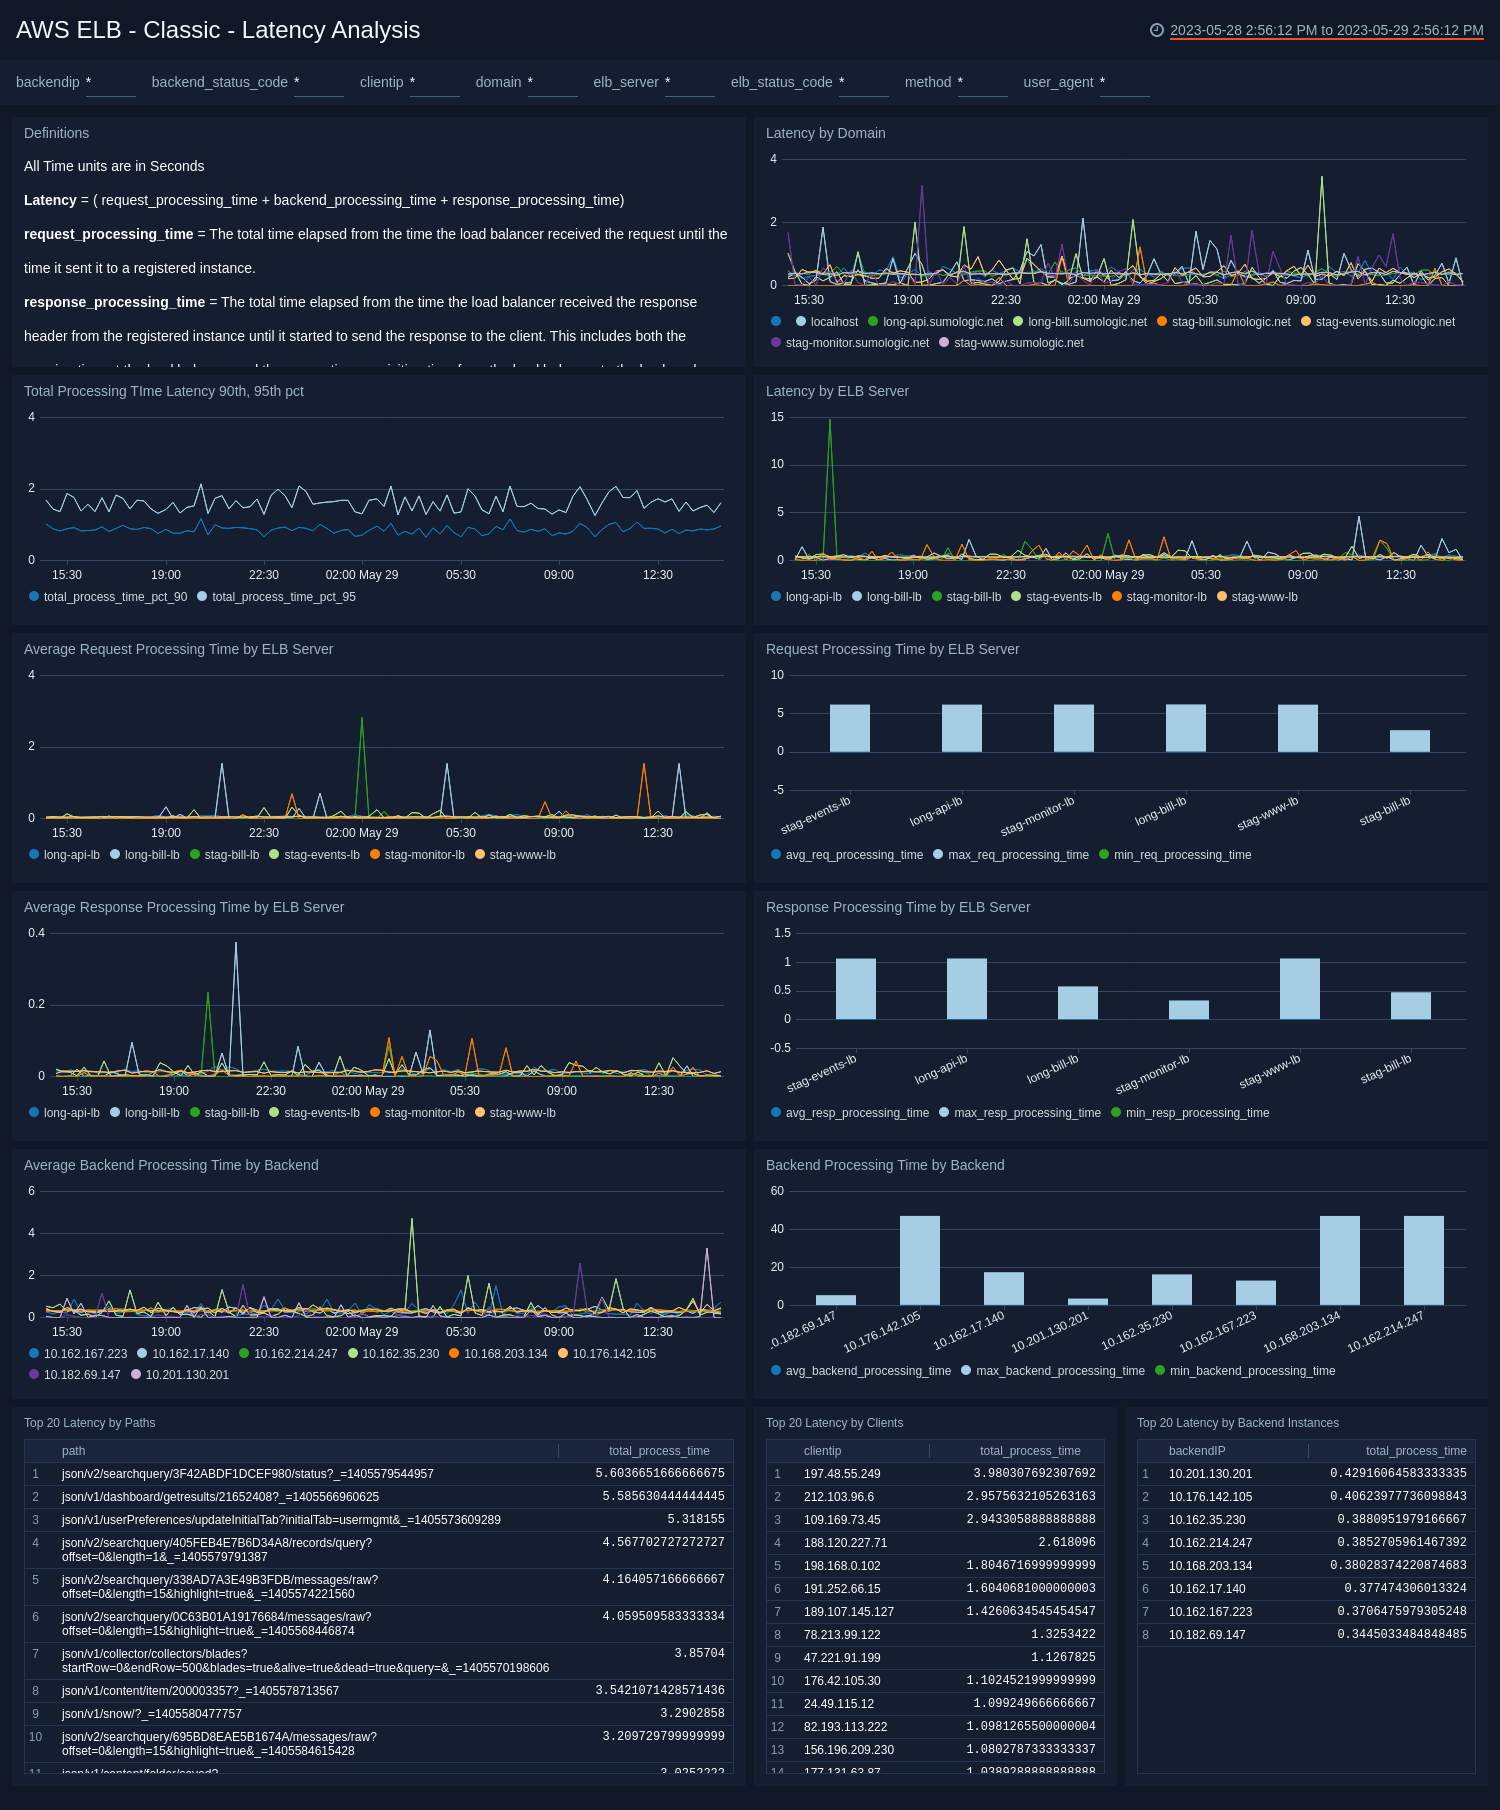
Latency Analysis
- Definitions Panel. Understand the definitions of request, response, and backend processing times. You can close this panel once you have a good grasp of the terms defined.
- Latency by Domain. See the latency of each domain in your EC2 deployment for the last 24 hours.
- Total Processing Time Latency 90th, 95th pct. Compare the highest latencies by percentile over the last 24 hours.
- Latency by ELB Server. Compare the latencies of ELB servers over the last 24 hours.
- Average Request Processing Time by ELB Server. Compare the average request processing times of ELB servers as a line chart for the last 24 hours.
- Request Processing Time by ELB Server. See the min, max, and average request processing times for each server for the last 24 hours as a bar chart.
- Average Response Processing Time by ELB Server. See the average response processing time for each ELB server for the last 24 hours as a line chart.
- Response Processing Time by ELB Server. See the min, max, and average request processing times for each server for the last 24 hours as a bar chart.
- Average Backend Processing Time by Backend. Compare average processing times by backend servers over the last 24 hours to find any unusual spikes of activity on a particular backend.
- Backend Processing Time by Backend. View the average, min, and max processing times for your backend systems for the last 24 hours, broken down by backends.
- Top 20 Latencies Paths. View the paths of the top 20 latencies in your system for the last 3 hours.
- Top 20 Latencies by Clients. View the IP addresses of the clients in your deployment with the top 20 latencies in the last 24 hours.
- Top 20 Latencies by Backend Instances. Focus solely on the back end of your Amazon EC2 deployment, review the instances with the top 20 latencies for the last 24 hours
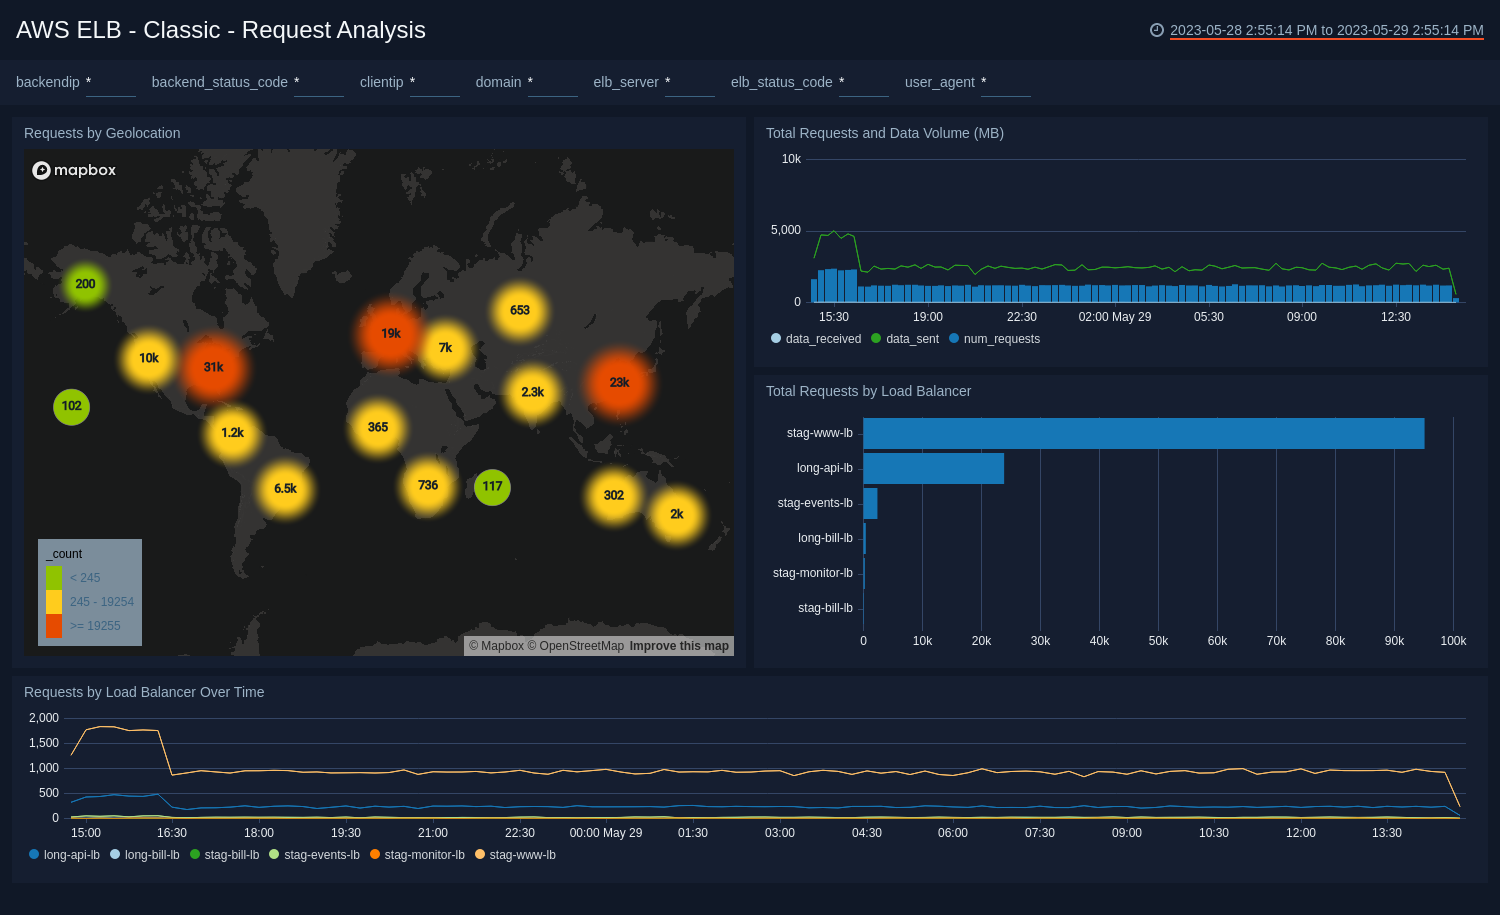
Requests Analysis
See the geolocation of requests by geolocation, data volume, load balancer, and compare to requests over time to identify issues.
- Requests by Geolocation. Uses a geolocation query to display a map of the IP addresses used by clients accessing your apps for the last three hours.
- Total Requests and Data Volume. Displays the data being sent and received by client IP in a line chart on a timeline for the last three hours.
- Total Requests by Load Balancer. Show the requests per load balancer over time in a bar chart for the last three hours.
- Requests by Load Balancer Over Time. Displays a line chart of how many requests are hitting a load balancer on a timeline over the last 24 hours.
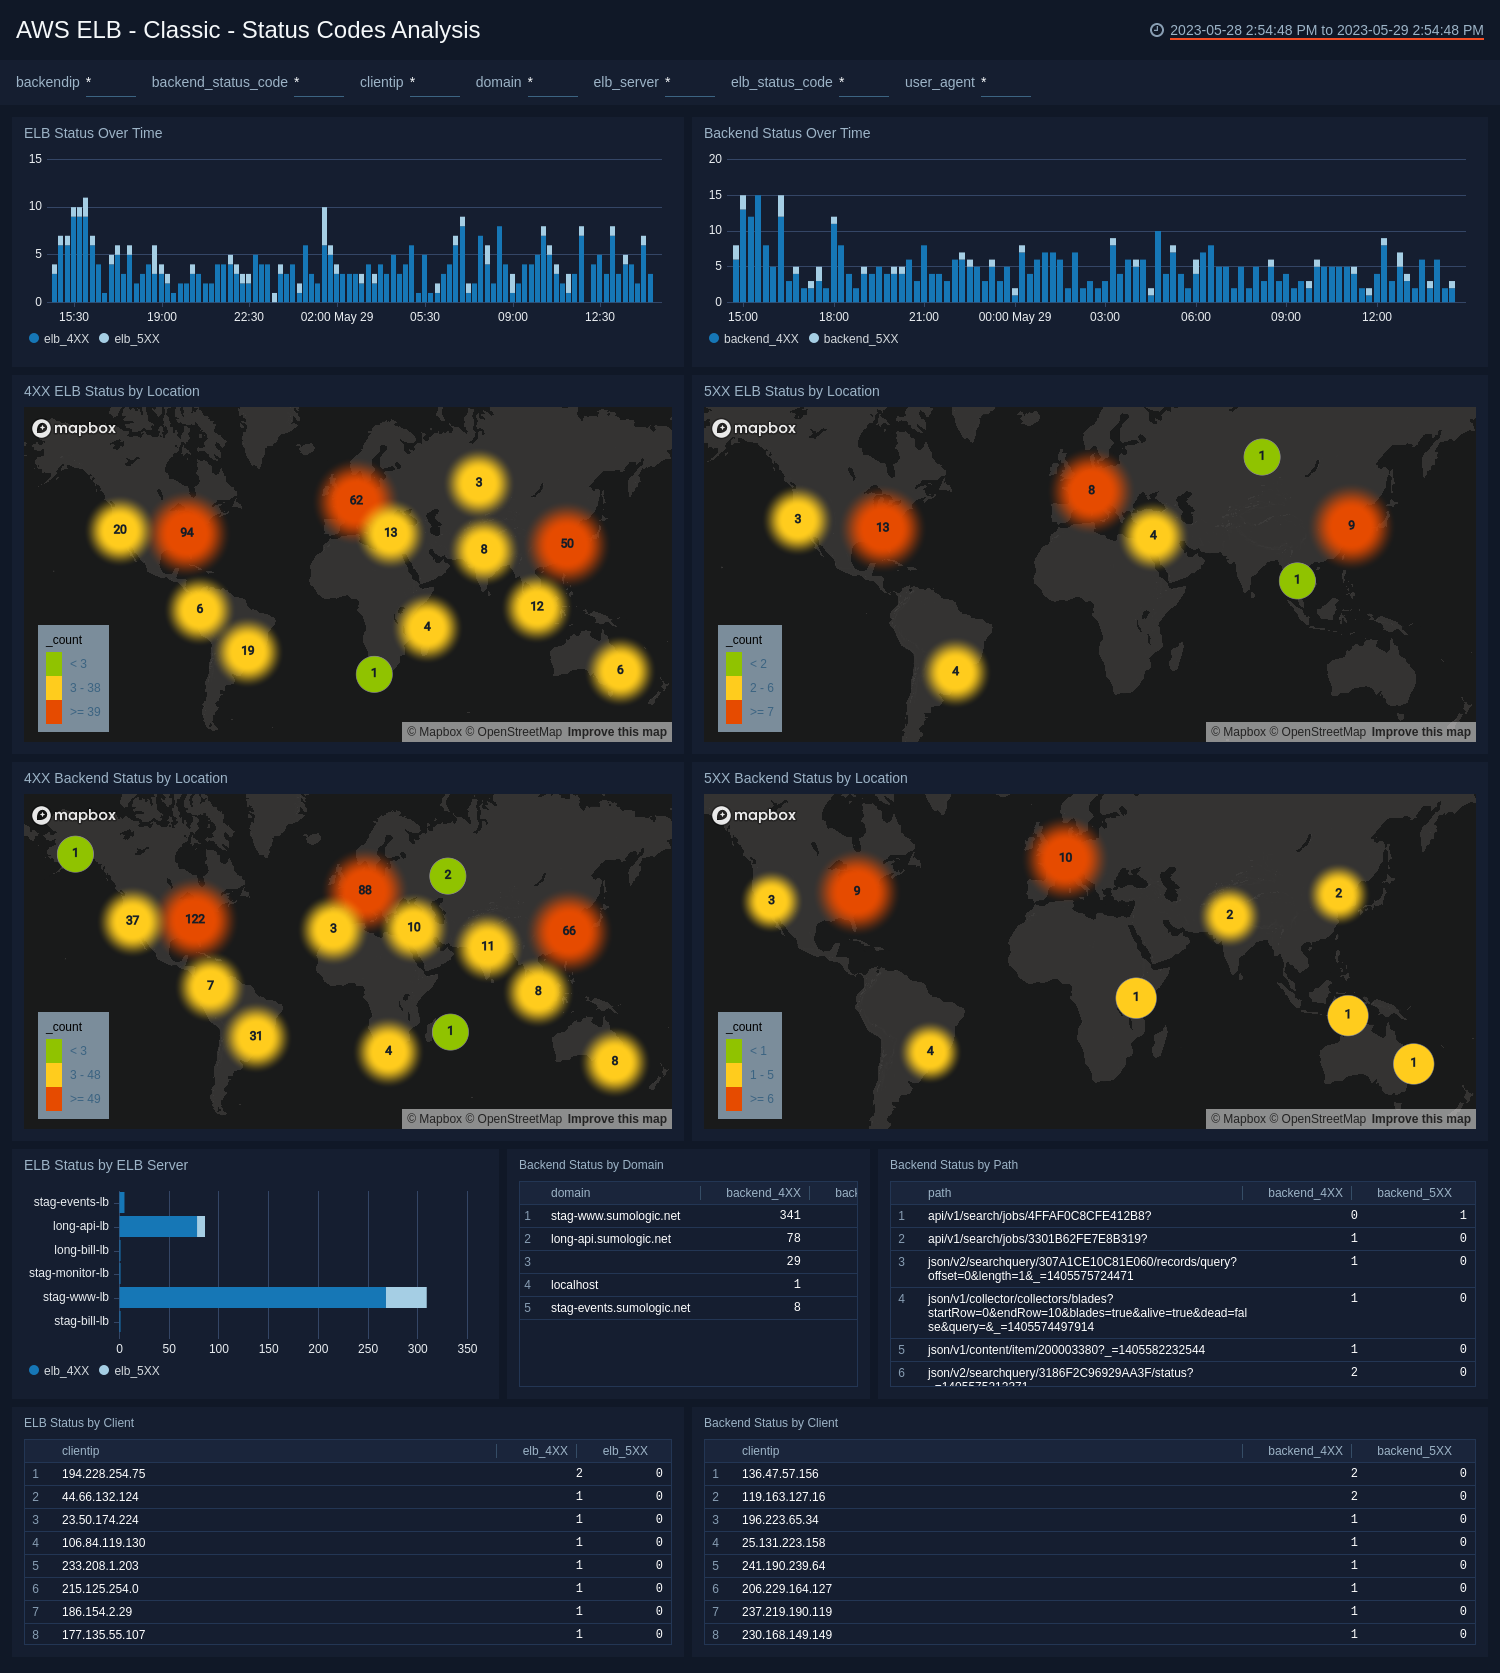
Status Codes Analysis
- ELB Status Over Time. Compare 4xx and 5xx ELB status codes over the last 24 hours.
- ELB Backend Status Over Time. Compare 4xx and 5xx backend status codes over the last 24 hours.
- 4XX ELB Status by Location. See the geolocation of your ELB 4xx statuses over the last 24 hours.
- 5XX ELB Status by Location. See the geolocation of your ELB 5xx statuses over the last 24 hours.
- 4XX Backend Status by Location. See the geolocation of your backend 4xx statuses over the last 24 hours.
- 5XX ELB Status by Location. See the geolocation of your backend 5xx status codes over the last 24 hours.
- ELB Status by ELB Server. Compare the 4xx and 5xx codes of your ELB servers for the last 24 hours with a bar chart.
- Backend Status by Domain. Compare the number of backend 4xx and 5xx statuses over the last 24 hours by domain name.
- Backend Status by Path. Compare the number of backend 4xx and 5xx statuses over the last 24 hours by path name.
- ELB Status by Client. Compare the number of ELB 4xx and 5xx statuses by client IP address over the last 24 hours.
- Backend Status by Client. Compare the number of backend 4xx and 5xx statuses by client.
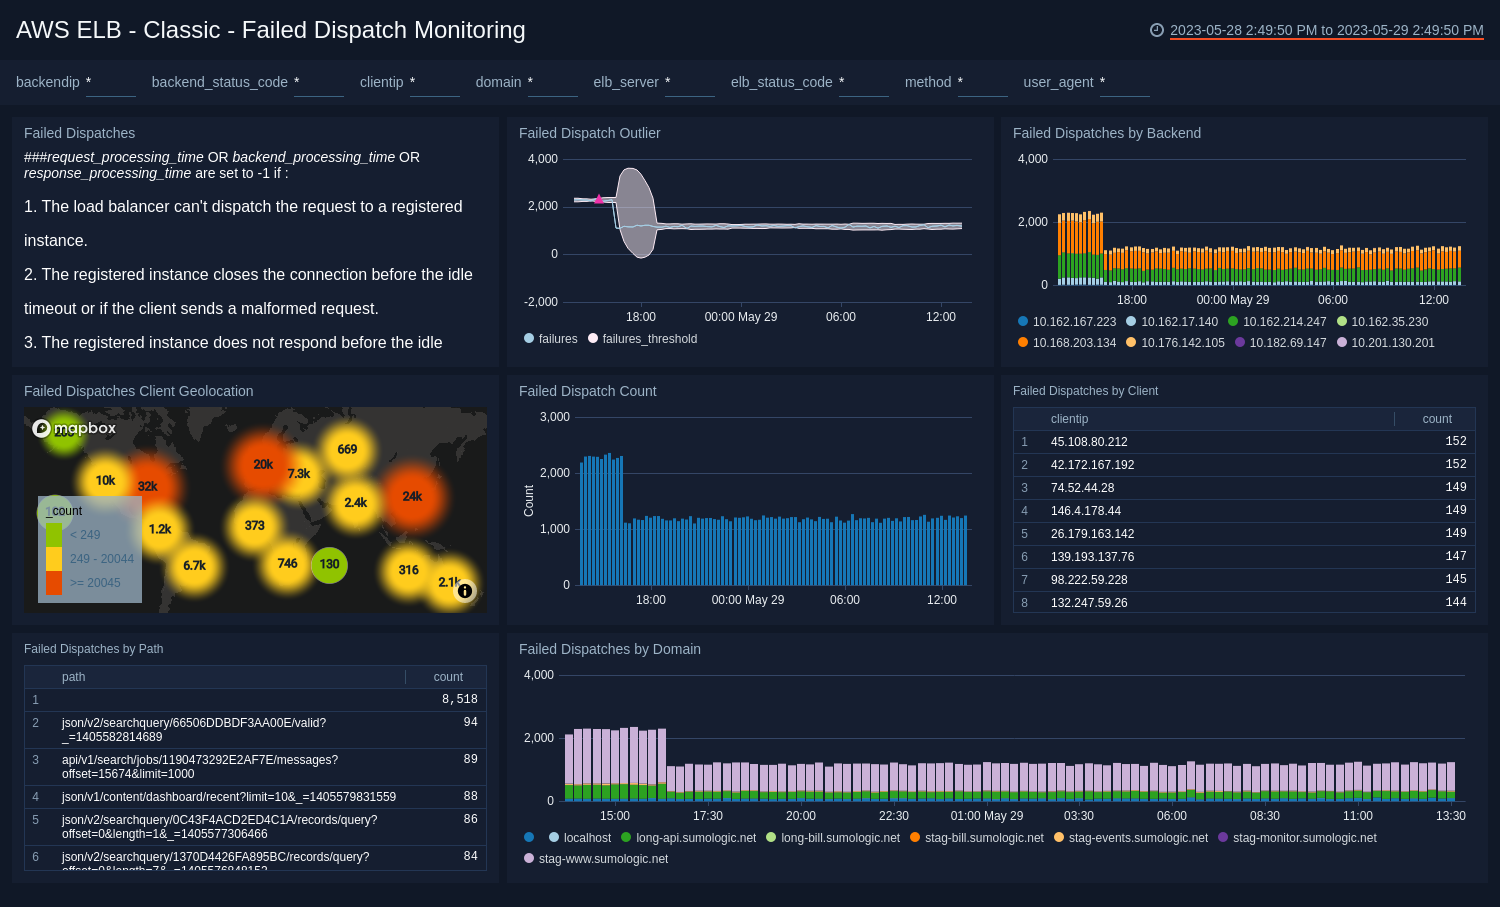
Failed Dispatch Monitoring
See failed dispatches broken down by geolocation, outliers, backend, count, client, path, and domain to identify issues.
- Failed Dispatches. Read this informational panel on what failure means. You can close it when you understand the reasons for -1.
- Failed Dispatch Outlier. See if any dispatch failures fall outside the designated threshold for the last 24 hours.
- Failed Dispatches by Backend. See the dispatch failures that occur by backend IP address for the last 24 hours, time sliced by 15 minutes. This panel can help you isolate a failure at a particular time or see patterns over time.
- Failed Dispatch Count. See a count of the total failed dispatches over the last 24 hours time sliced by 15 minutes.
- Failed Dispatches by Client. See the count of total dispatch failures for the last 24 hours broken down by client IP address.
- Failed Dispatches by Domain. See the failed dispatches for the last 24 hours broken down by domain and time sliced by 15 minutes. This panel can help you isolate a failure at a particular time or see patterns over time.