Active Directory JSON - OpenTelemetry Collector
The Active Directory JSON app helps you monitor your Windows Active Directory deployment by analyzing Active Directory logs in the JSON based event log format. The app includes predefined searches and dashboards that provide user activity into your environment for real-time analysis of overall usage.
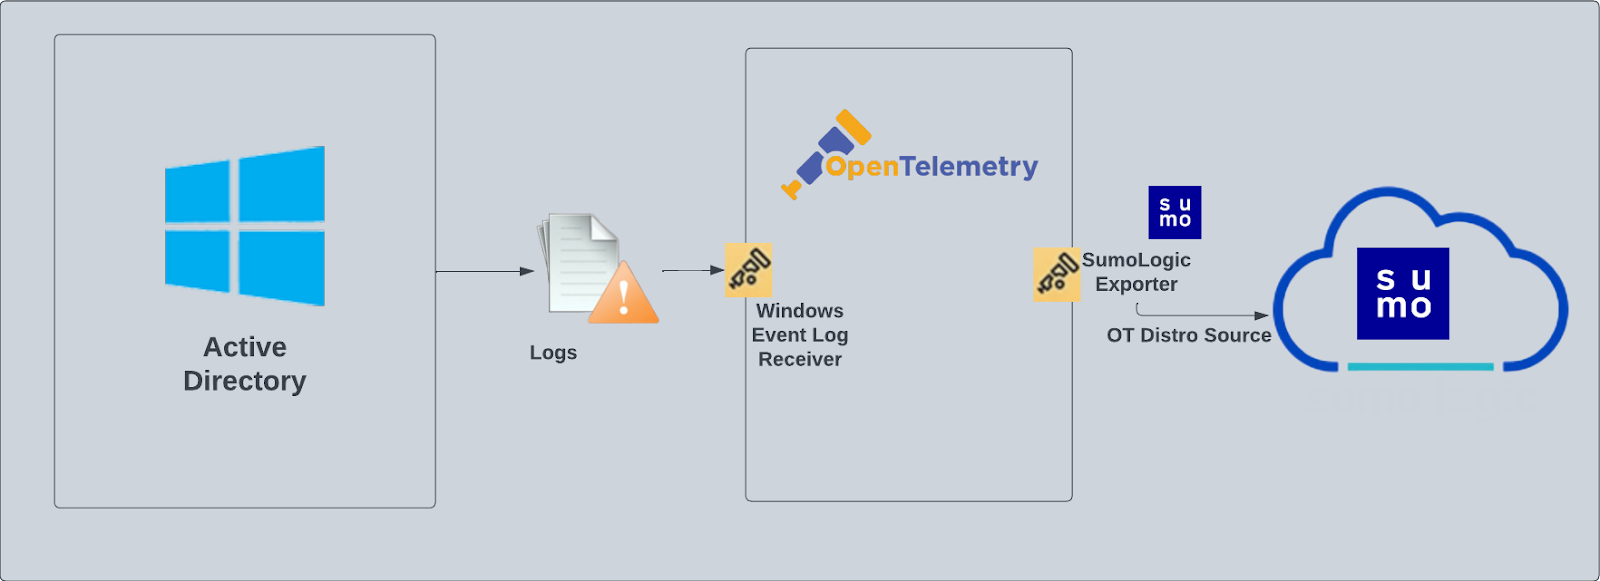
We recommend using the Active Directory JSON app in combination with the Windows JSON App.Active Directory logs are sent to Sumo Logic through OpenTelemetry windowseventlogreceiver.
Fields creation in Sumo Logic for Active Directory
Following are the fields which will be created as part of Active Directory App install if not already present.
sumo.datasource - Has fixed value of activeDirectory
Event logs used by Active Directory app
This section provides instructions for configuring log collection for Active Directory running on a non-Kubernetes environment for the Sumo Logic app for Active Directory. Tails and parses logs from Windows event log API are collected using the opentelemetry-log-collection library.
Log types
Standard Windows event channels include:
- Security
- System
- Application
Collection configuration and app installation
You can skip this section if you have already set up the logs collection through Windows PCI, Windows - Cloud Security Monitoring and Analytics, or Windows app installation. Additional collection is not required as the logs used by this app are already ingested into Sumo Logic.
As part of data collection setup and app installation, you can select the App from App Catalog and click on Install App. Follow the steps below.
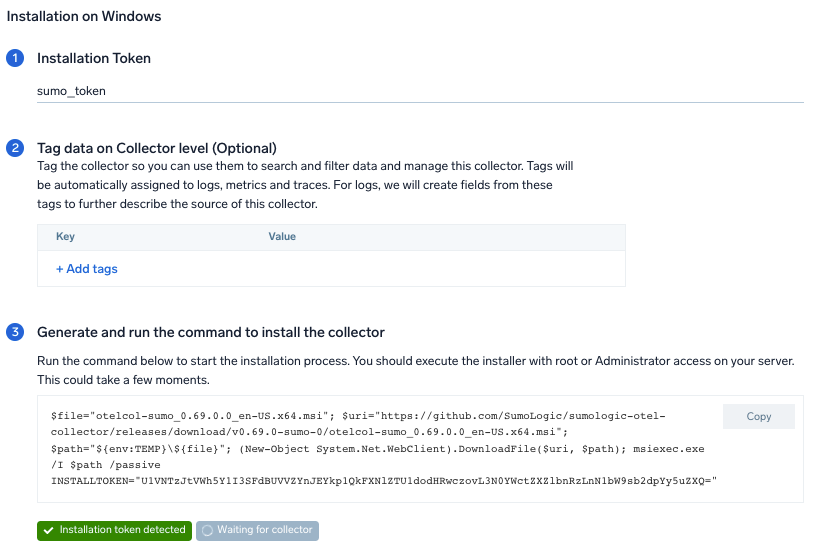
Step 1: Set up Collector
If you want to use an existing OpenTelemetry Collector, you can skip this step by selecting the Use an existing Collector option.
To create a new Collector:
- Select the Add a new Collector option.
- Select the platform where you want to install the Sumo Logic OpenTelemetry Collector.
This will generate a command that you can execute in the machine environment you need to monitor. Once executed, it will install the Sumo Logic OpenTelemetry Collector.
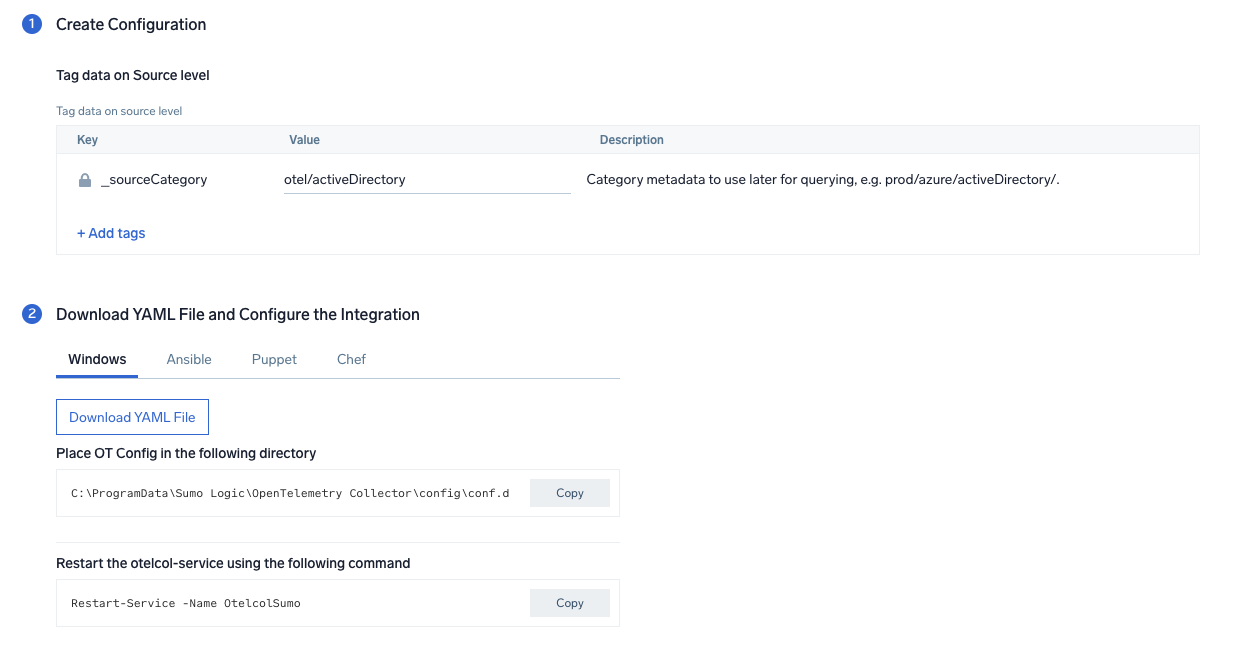
Step 2: Configure Integration
In this step, we will configure the yaml required for Active Directory Collection.
You can add any custom fields which you want to tag along with the data ingested in Sumo.
Click on the Download YAML File button to get the yaml file.
Step 3: Send logs to Sumo Logic
Once you have downloaded the yaml file as described in the previous step, follow the below steps based on your platform.
- Windows
- Chef
- Ansible
- Puppet
- Copy the yaml at
C:\ProgramData\Sumo Logic\OpenTelemetry Collector\config\conf.dfolder in the machine which needs to be monitored. - Restart the collector using the command
Restart-Service -Name.
- Copy the yaml file into your Chef cookbook files directory
files/<downloaded_yaml_file>. - Use a Chef file resource in a recipe to manage it.
cookbook_file '/etc/otelcol-sumo/conf.d/<downloaded_yaml_file>' do mode 0644 notifies :restart, 'service[otelcol-sumo]', :delayed end - Add the recipe to your collector setup to start collecting the data. Every team typically has their established way of applying the Chef recipe. The resulting Chef recipe should look something like:
cookbook_file '/etc/otelcol-sumo/conf.d/<downloaded_yaml_file>' do
mode 0644
notifies :restart, 'service[otelcol-sumo]', :delayed
end
- Place the file into your Ansible playbook files directory.
- Run the Ansible playbook.
ansible-playbook -i inventory install_sumologic_otel_collector.yaml
-e '{"installation_token": "<YOUR_TOKEN>", "collector_tags": {<YOUR_TAGS>}, "src_config_path": "files/conf.d"}'
- Place the file into your Puppet module files directory
modules/install_otel_collector/files/<downloaded_yaml>. - Use a Puppet file resource to manage it.
file { '/etc/otelcol-sumo/conf.d/<downloaded_yaml_file>':
    ensure => present,
    source => 'puppet:///modules/install_otel_collector/<downloaded_yaml_file>',
    mode => '0644',
    notify => Service[otelcol-sumo],
} - Apply the Puppet manifest. Every team typically has their established way of applying the Puppet manifest. The resulting Puppet manifest should look something like:
node 'default' {
    class { 'install_otel_collector'
      installation_token => '<YOUR_TOKEN>',
      collector_tags => { <YOUR_TAGS> },
    }

    service { 'otelcol-sumo':
      provider => 'systemd',
      ensure => running,
      enable => true,
      require => Class['install_otel_collector'],
    }

    file { '/etc/otelcol-sumo/conf.d/<downloaded_yaml_file>':
      ensure => present,
      source => 'puppet:///modules/install_otel_collector/<downloaded_yaml_file>',
      mode => '0644',
      notify => Service[otelcol-sumo],
    }
  }
After successfully executing the above command, Sumo Logic will start receiving data from your host machine.
Click Next. This will install the app (dashboards and monitors) to your Sumo Logic Org.
Dashboard panels will start to fill automatically. It's important to note that each panel fills with data matching the time range query and received since the panel was created. Results won't immediately be available, but within 20 minutes, you'll see full graphs and maps.
Sample log messages
{
record_id:"121139",
channel:"Security",
event_data:"S-1-0-0
-
-
0x0
S-1-0-0
TS

0xc000006d
%%2313
0xc0000064
3
NtLmSsp
NTLM
-
-
-
0
0x0
-
9.204.254.156\
0",
task:"Logon",
provider:"{\"event_source\":\"\",\"name\":\"Microsoft-Windows-Security-Auditing\",\"guid\":\"{54849625-5478-4994-a5ba-3e3b0328c30d}\"}",
system_time:"2023-01-16T08:53:57+0000664Z",
computer:"EC2AMAZ-T30T53R",
opcode:"Info",
keywords:"Audit Failure",
details:"{\"Account For Which Logon Failed\":\"\",\"Network Information\":\"\",\"Failure Information\":\"\",\"Detailed Authentication Information\":\"\",\"Subject\":\"\",\"Process Information\":\"\",\"Logon Type\":\"3\",\"Additional Context\":\"\"}",
message:"An account failed to log on.",
event_id:"{\"qualifiers\":\"0\",\"id\":\"4625\"}",
level:"Information"
}
Sample queries
This sample Query is from the Active Directory - Active Directory Service Activity > Top 10 Messages panel.
%"sumo.datasource"=activeDirectory
| json "event_id", "computer", "message" as event_id, host, msg_summary nodrop
| parse regex field=msg_summary "(?<msg_summary>.*\.*)" nodrop
| where host matches "*"
| count by msg_summary
| top 10 msg_summary by _count
Viewing Active Directory dashboards
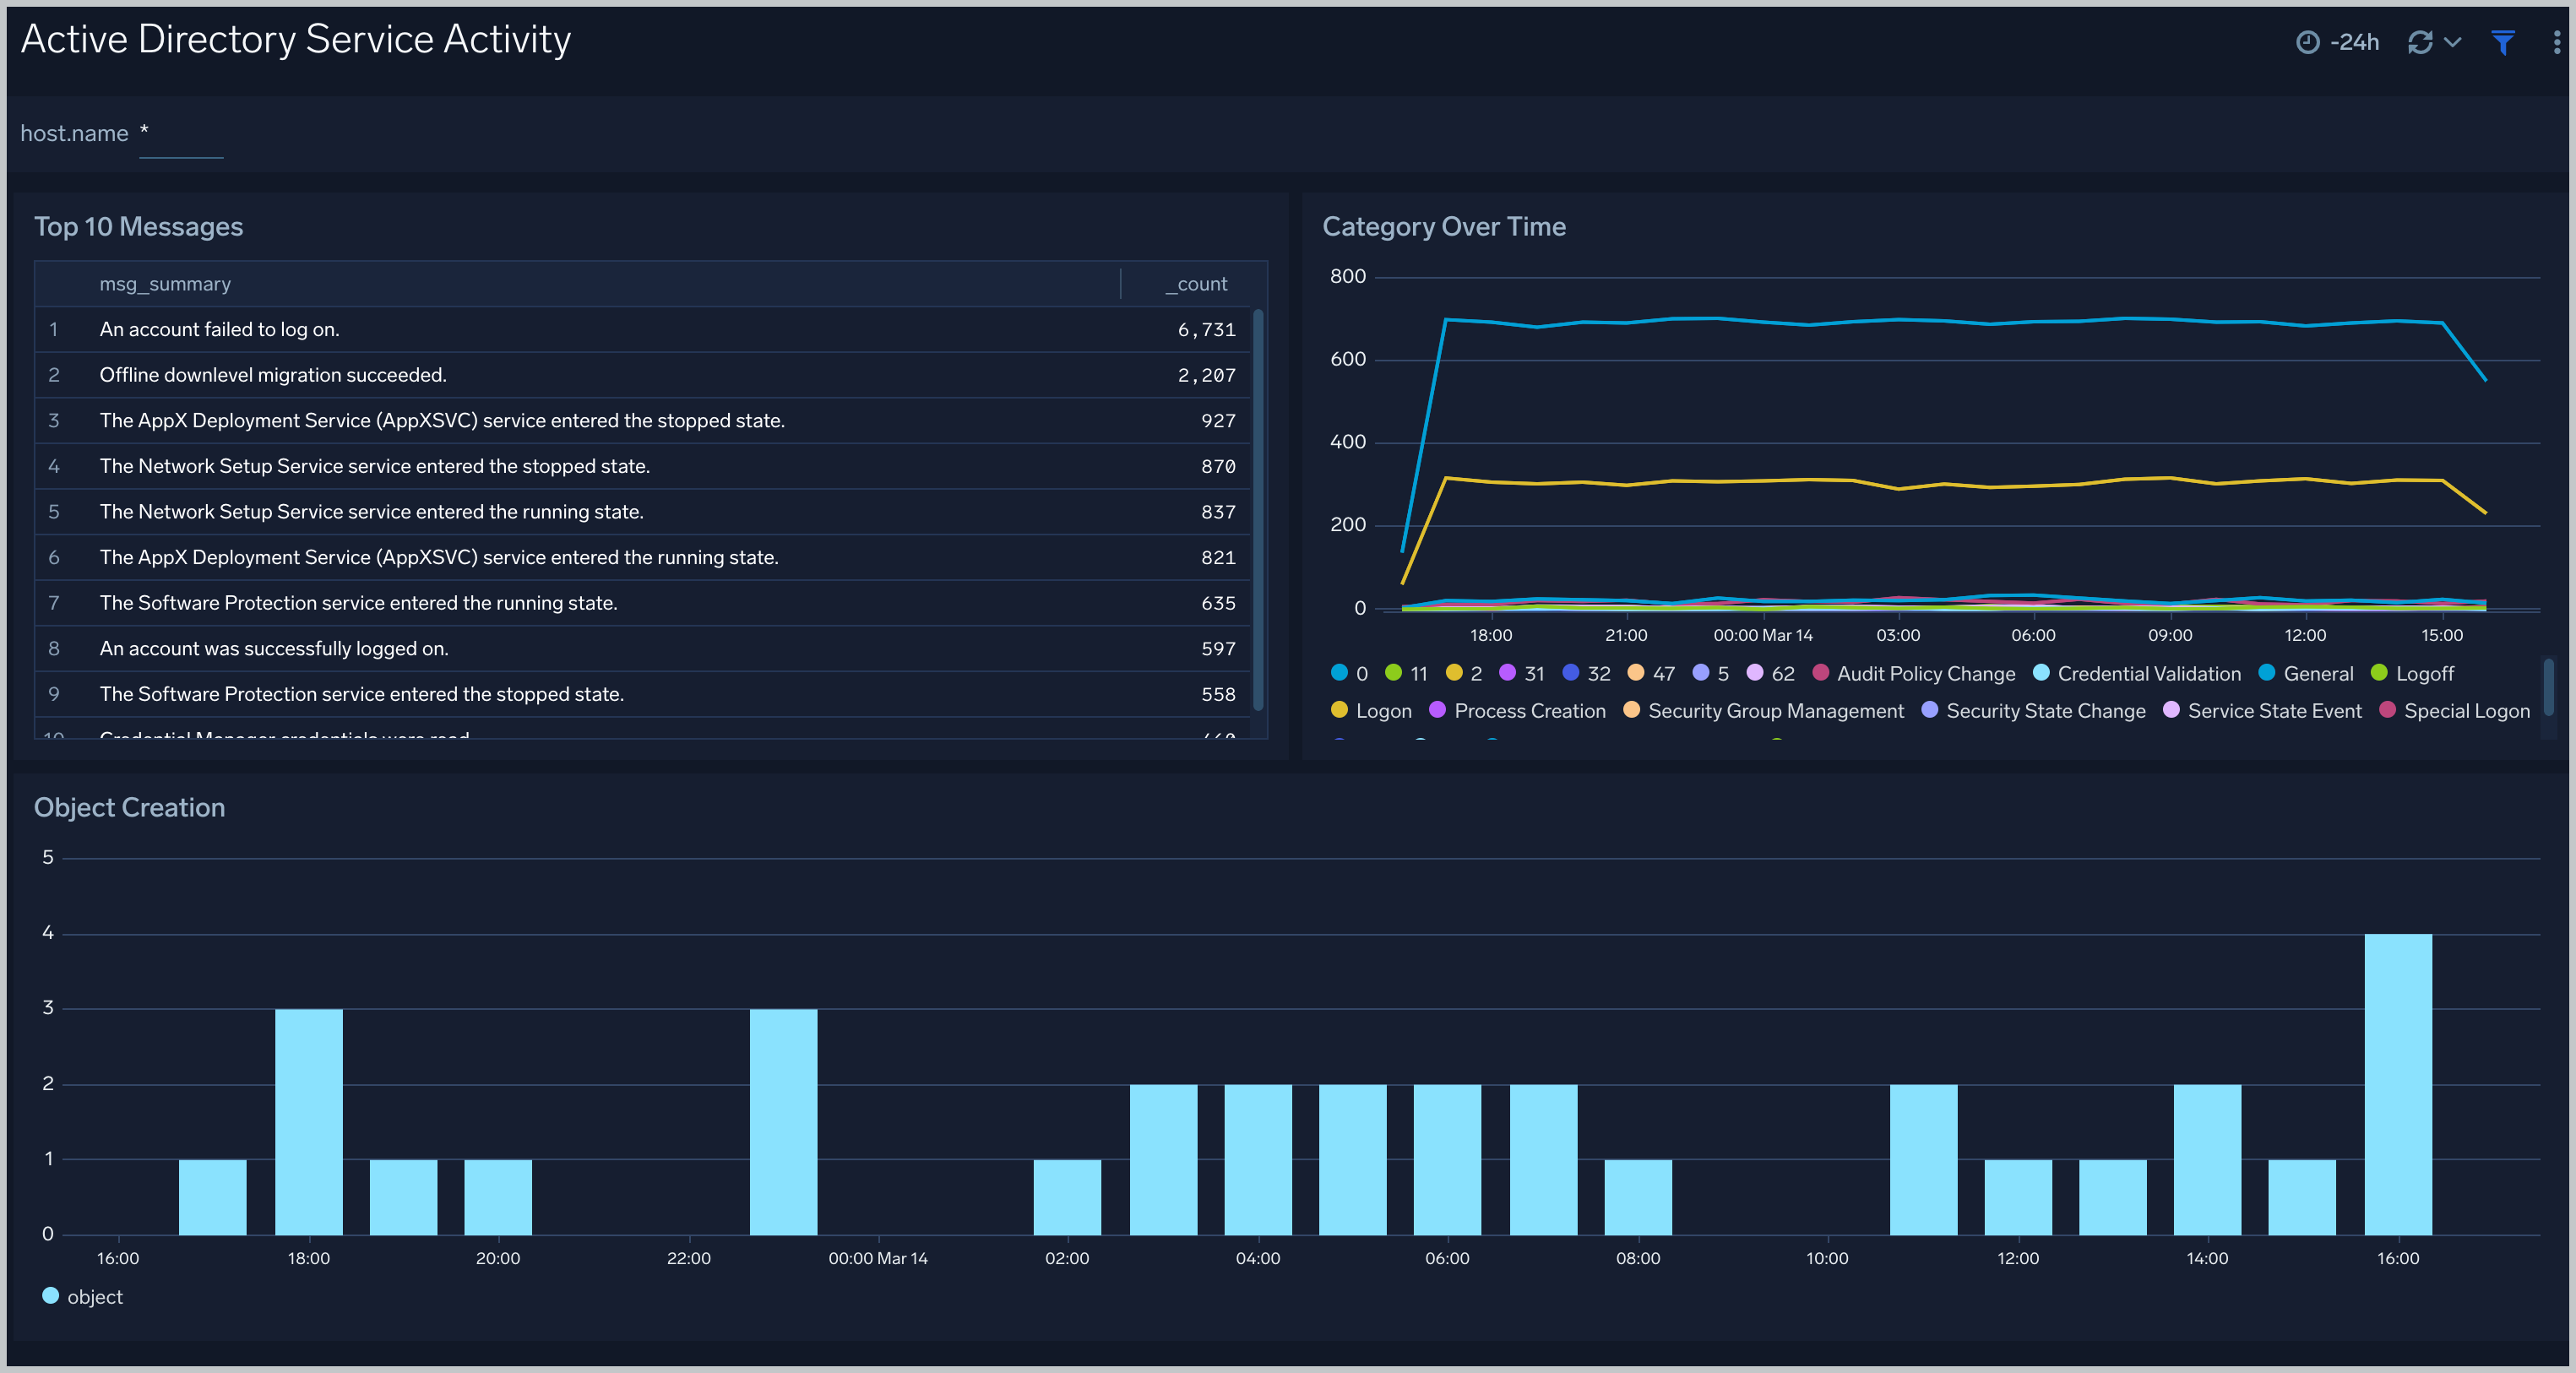
Active Directory Service Activity
The Active Directory Service Activity dashboard provides insights into overall active directory services like Category overtime, object creation, top 10 messages.
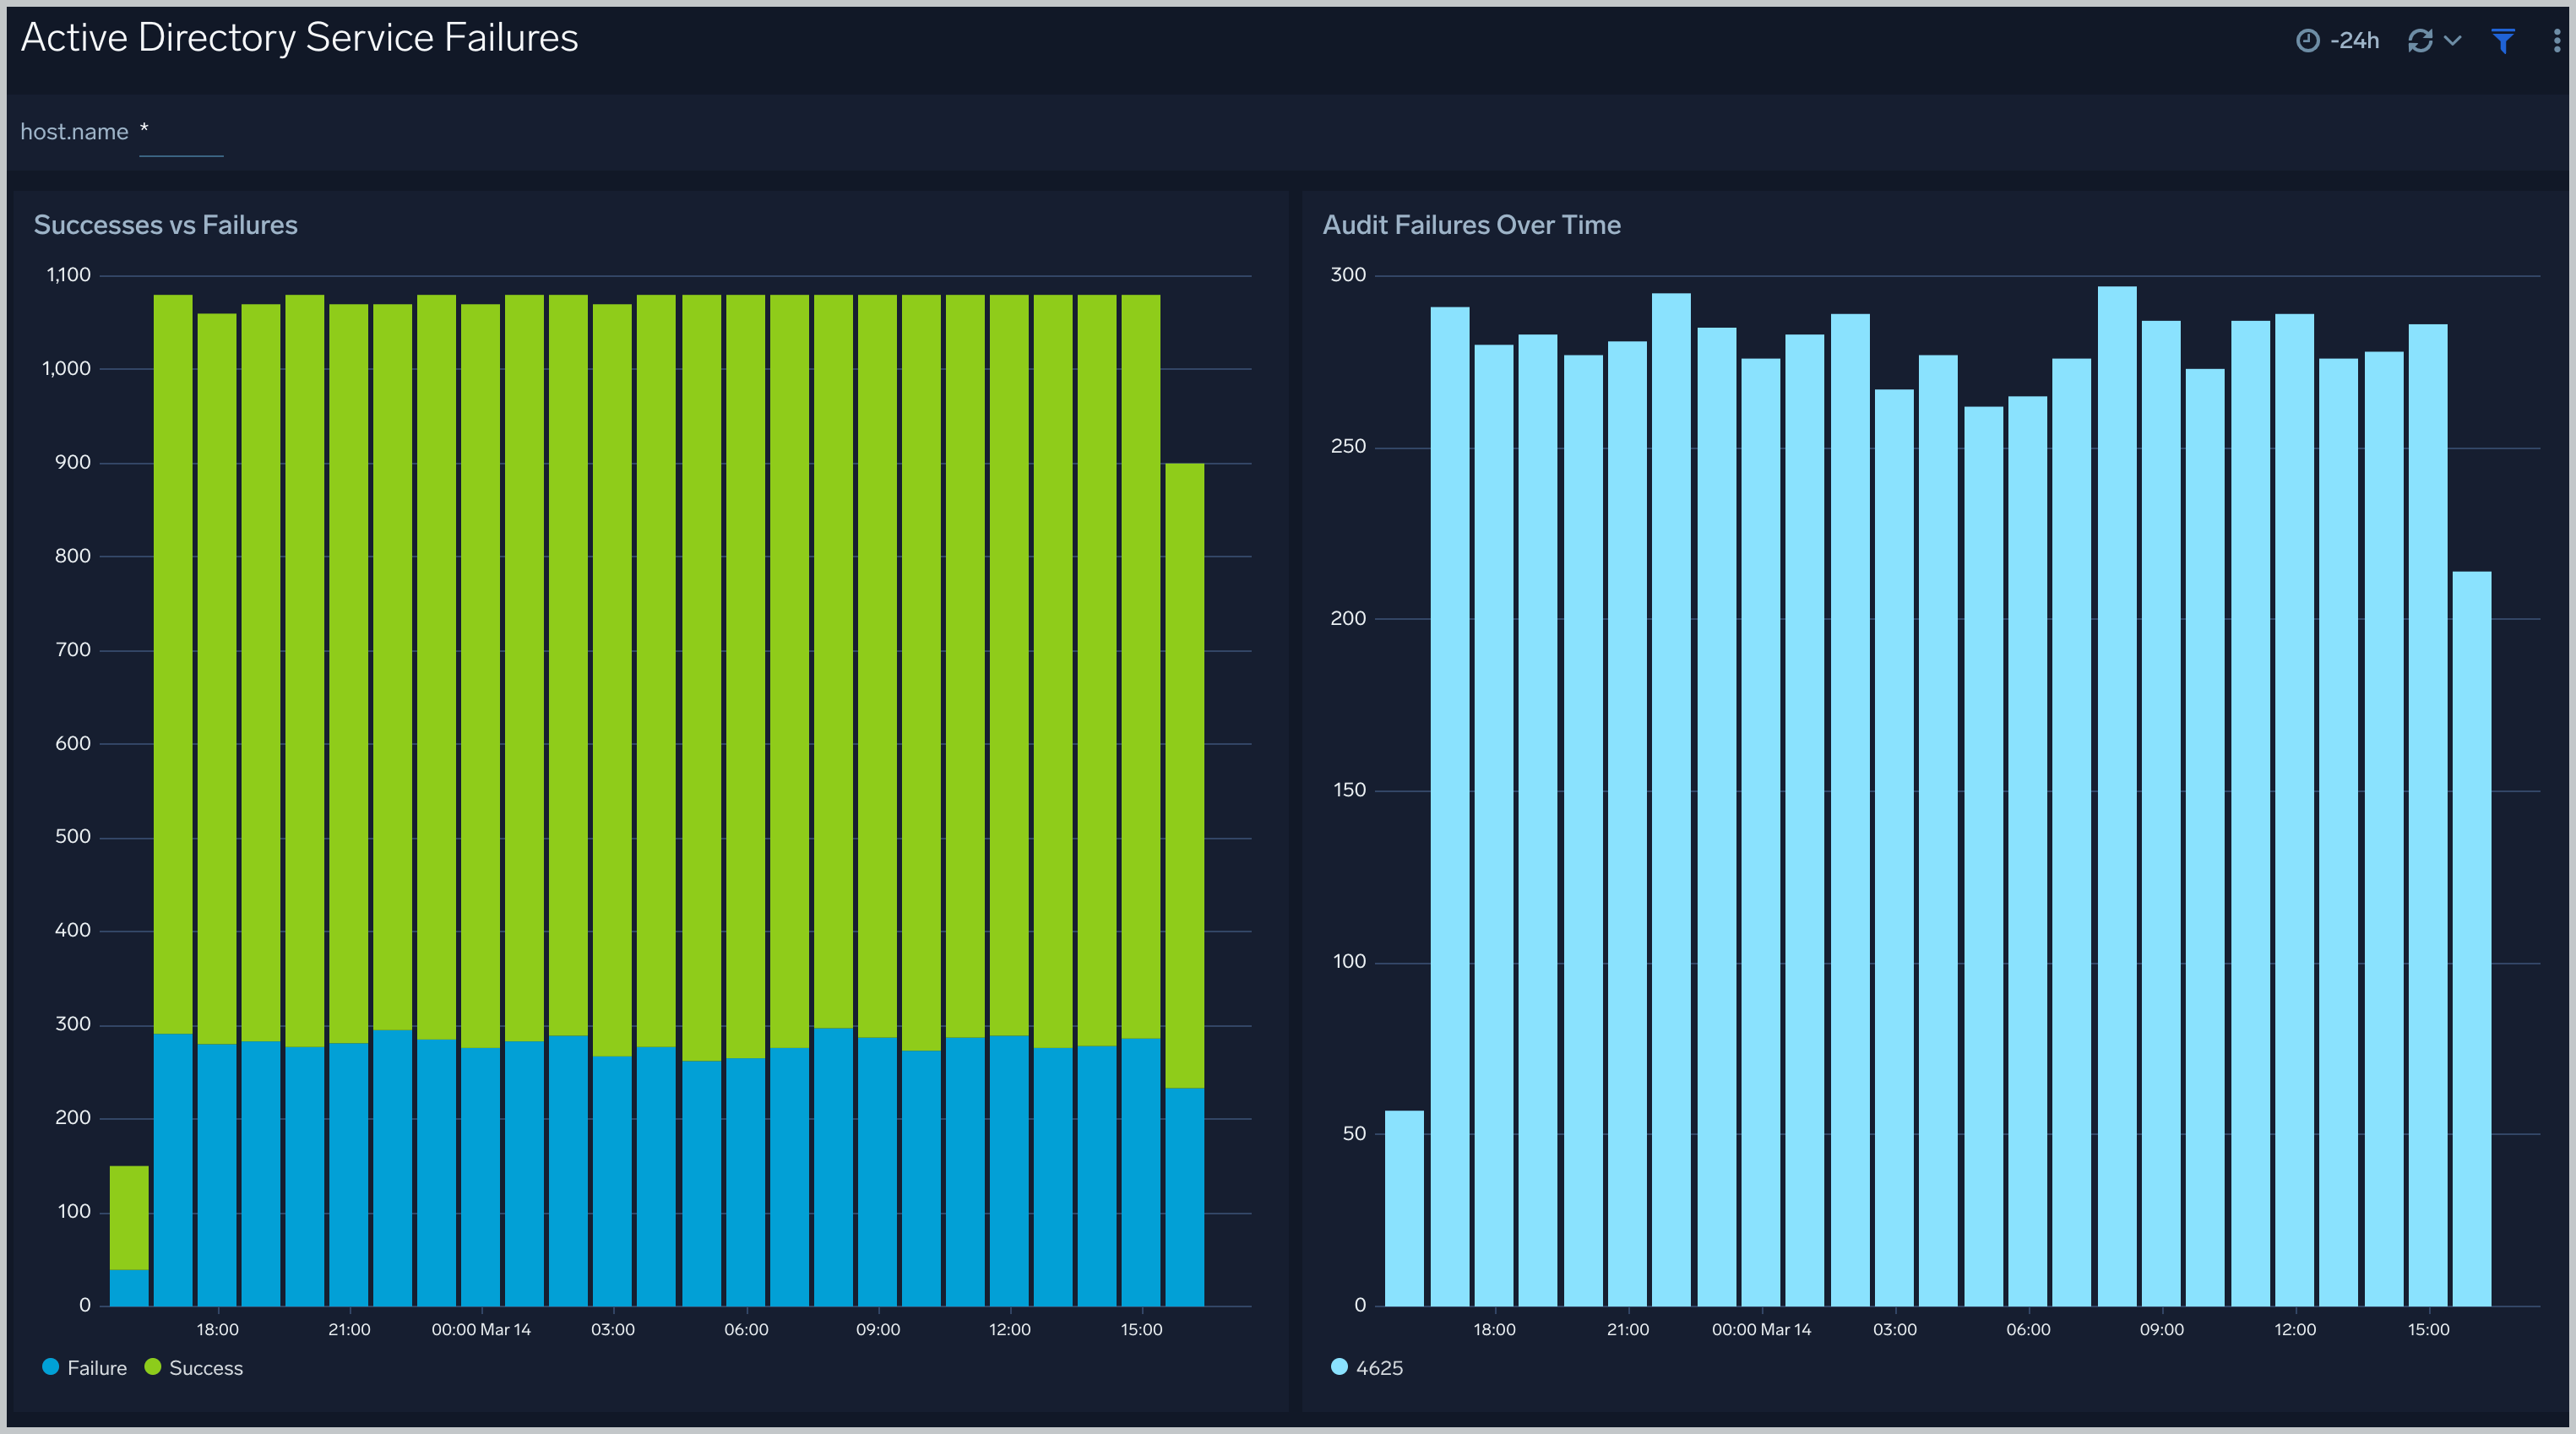
Active Directory Service Failures
The Active Directory Service Failures dashboard provides an at-a-glance view of success, failures, and audit failures overtime.