LogExplain
The LogExplain operator allows you to compare sets of structured logs based on events you are interested in. Structured logs can be in JSON, CSV, key-value, or any structured format. Often logs relevant to troubleshooting and security insights are scattered among other logs that show the expected behavior and performance. These logs normally consist of different content, where it is helpful to see which values occur more often in events of interest versus normal operation logs. For example, events of interest often contain information relevant to persistent errors, excess load, and high latency.
You will need to specify an event of interest as a conditional statement, this is called the Event Condition. You can specify a condition to compare against the event-of-interest condition, this is called the Against Condition. If no Against Condition is provided, LogExplain will generate the comparison data set based on the fields in your Event Condition.
LogExplain will process your data against the specified conditions and create separate data sets to compare:
- A control data set from normal operations data.
- An event-of-interest data set.
LogExplain gathers frequent (at least 5%) joint-column entries, such as key-value pairs that occur more frequently compared to the control set. The results indicate what entities correlate with the event you are interested in.
The following table shows the fields that are returned in results.
_explanation | _relevance | _test_coverage | _control_coverage |
|---|---|---|---|
| The fields and respective values from the comparison. | The probability that the explanation occurs in the event-of-interest data set. Values are 0 to 1. | The percentage of data in the event-of-interest set that has the explanation. The link opens a new search that drills down to these logs based on the related explanation. | The percentage of control data in the event-of-interest set that has the explanation. The link opens a new search that drills down to these logs based on the related explanation. |
When test and control coverage are both 100%, the relevance is evaluated as 0.
Explanations are displayed in descending order according to their relevancy. In order for an explanation to be shown, it must satisfy the following conditions:
- The test coverage must be greater than 5%.
- The relevance must be greater than 0.1. Joint key-value pairs with relevancy below 0.6 are not significant explanations.
- Less relevant explanations will only be shown if they contain at least one key-value pair that is not already included in a more relevant explanation.
With the provided results you can:
- Click the provided links to drill down and further explore logs from each explanation.
- Run subsequent searches. For example, if an IP address is an outlier you might search for logs referencing that IP address for further investigation.
Syntax
| logexplain <event_condition> [against <against_condition>] on <fieldname>[,<fieldname>, ...]
| Parameter | Description |
|---|---|
event_condition | A boolean expression that defines the event of interest. |
against_condition | A boolean expression that defines the ideal comparison data set. If not provided the complement of event_condition is used. |
fieldname | A comma-separated list of fields to process against the conditions. |
Limitations
- Field values must be categorical.
- Built-in metadata fields are not supported.
- Not supported with Real Time alerts.
- Time Compare and the compare operator are not supported against LogExplain results.
- Response fields
_explanation,_relevance,_test_coverage, and_control_coverageare not supported with Dashboard filters. - If you reach the memory limit you can try to shorten the time range or the number of specified fields. When the memory limit is reached you will get partial results on a subset of your data.
Response links
- Drill down searches opened by clicking the link provided from the
_test_coverageand_control_coveragefields are run against message time. - When provided in a Scheduled Search alert, the links from the
_test_coverageand_control_coveragefields are invalid and will not work.
Examples
Errors by host
__sourceCategory=stream
| if(_raw matches "error", 1, 0) as hasError
| logexplain hasError == 1 on _sourceHost
Access denied
Having seen that there are a lot of AccessDenied errors, in the example below, we want to explain which combinations of eventName, userName, or AWS service (invokedBy) might be responsible for errorCode having a value of AccessDenied by comparing logs with AccessDenied errors against logs with other errorCodes. Values from userNames or invokedBys might be candidates for further investigation.
_sourceCategory= *cloudtrail* errorCode
| json field=_raw "eventSource" as eventSource
| json field=_raw "eventName" as eventName
| json field=_raw "errorCode" as errorCode
| json field=_raw "recipientAccountId" as recAccountId
| json field=_raw "userIdentity.accountId" as srcAccountId
| json field=_raw "userIdentity.invokedBy" as invokedBy nodrop
| json field=_raw "userIdentity.sessionContext.sessionIssuer.userName" as userName nodrop
| json field=_raw "sourceIPAddress" as sourceIp
| logexplain (errorCode="AccessDenied") on eventName, userName, invokedBy, sourceIp
Kubernetes
After using LogReduce Values to explore your event logs based on specific keys, you can use LogExplain to analyze the frequency of events.
If a cluster of logs has reason="FailedScheduling" indicating the Kubernetes scheduler is unable to find nodes that can satisfy requirements for the requested pods, you can use logexplain to understand which pods and the reason they are unable to find a node to run in.
_sourceCategory="nite-primary-eks/events"
| where _raw contains "forge"
| json auto "object.reason", "object.involvedObject.name", "object.message" as reason, objectName, message
| logexplain (reason="FailedScheduling") on objectName, message
AWS CloudTrail
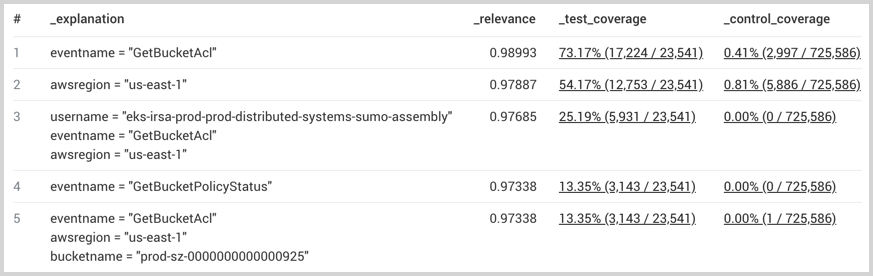
After using LogReduce Values to explore your event logs based on specific keys you can use LogExplain to analyze which users, IP addresses, AWS regions, and S3 event names most explain the S3 Access Denied error based on their prevalence in AWS CloudTrail logs that contain S3 Access Denied errors versus logs that do not contain these errors.
_sourceCategory=*cloudtrail*
| json field=_raw "userIdentity.userName" as userName nodrop
| json field=_raw "userIdentity.sessionContext.sessionIssuer.userName" as userName_role nodrop
| if (isNull(userName), if(!isNull(userName_role),userName_role, "Null_UserName"), userName) as userName
| json field=_raw "eventSource" as eventSource
| json field=_raw "eventName" as eventName
| json field=_raw "awsRegion" as awsRegion
| json field=_raw "errorCode" as errorCode nodrop
| json field=_raw "errorMessage" as errorMessage nodrop
| json field=_raw "sourceIPAddress" as sourceIp nodrop
| json field=_raw "requestParameters.bucketName" as bucketName nodrop
| json field=_raw "recipientAccountId" as accountId
| where eventSource matches "s3.amazonaws.com"  and accountId matches "*"
| logexplain (errorCode matches "*AccessDenied*") on sourceIp, userName, awsRegion, eventName, bucketName
Results show the relevance of each explanation:
Windows Credentials
As a SecOps user, I want to detect compromised user credentials for Windows machines.
SecOps Insight: A hacked credential will display a remote login pattern (eventdata_logontype = 10) where a given user logs into more machines than they usually do, based on eventid = 4624 (login successful). I want to baseline 14 days of remote access activity and detect outliers in the most recent 24 hours.
Approach 1: Time Compare
The time compare query attempts to enumerate all machine-to-user combinations over the past 24 hours and compares the average daily logins for each pair of machine and user. As compare only supports up to 8 sequential slices, the data has to be sliced into 2 day intervals with 7 epochs, to create 14 days of data.
_sourceCategory=OS*Windows* eventid=4624 eventdata_logontype=10
| count by eventdata_targetusername, eventdata_workstationname
| where !isBlank(eventdata_targetusername) && !isBlank(eventdata_workstationname)
compare with timeshift 2d 7 avg
| if(isNull(_count), 0.01, _count) as _count
| if(isNull(_count_14d_avg), 0.01, _count_14d_avg) as _count_14d_avg
| (_count - _count_14d_avg) / _count_14d_avg as percentageIncrease
| if(_count_14d_avg == 0.01, 9999, percentageIncrease) as percentageIncrease
| sort - percentageIncrease, _count
In an example dataset, this requires you to examine 150 machine-user combinations based on the percentage increase in activity and 773 rows in the worst case.
Approach 2: The equivalent query with LogExplain
_sourceCategory=OS*Windows* eventid=4624 eventdata_logontype=10
| where !isBlank(eventdata_targetusername) && !isBlank(eventdata_workstationname)
| logexplain (now() - _messagetime\< 86400000) on eventdata_workstationname, eventdata_targetusername
In an example dataset, this requires you to examine just 4 results, versus 773 in the worst case for time compare. The machines were not reported as significant in the logexplain algorithm, as they appeared at relatively the same frequency in both the baseline and comparison logs. Subjectively, the 4 users identified by logexplain were among the 150 results in the time compare query, sorted by percent increase in activity, so we believe our accuracy was at least as good as time compare with fewer results for the user to examine.
One important difference for logexplain is that it is able to detectusers who were very active 14 days ago but are no longer or less active recently. This is important as hackers may have left the network by the time Sec Ops chooses to run any of these queries. Time compare on the other hand, if sorted based on percent increase of activity, will force the user to examine all 773 user-machine combinations to get the full picture.