Sumo Logic Data Volume App
The Data Volume App provides you with a summary and detailed views of your account's data usage volume by data type, tier, category, collector, source name, and hosts via predefined searches and dashboards.
Installing the Data Volume app
To install the app:
- Select App Catalog.
- In the Search Apps field, search for and then select your app.
- Optionally, you can scroll down to preview the dashboards included with the app. Then, click Install App (sometimes this button says Add Integration).
- Click Next.
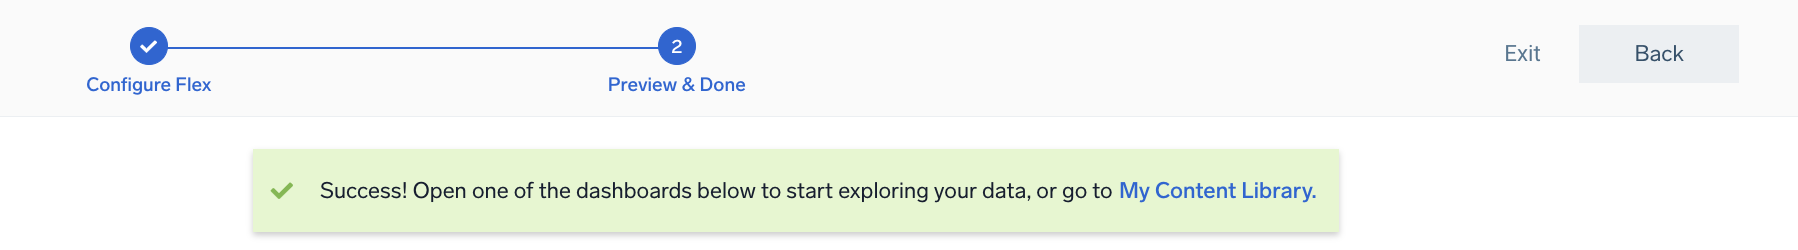
- Look for the dialog confirming that your app was installed successfully.
Once an app is installed, it will appear in your Personal folder or the folder that you specified. From here, you can share it with other users in your organization. Dashboard panels will automatically start to fill with data matching the time range query received since you created the panel. Results won't be available immediately, but within about 20 minutes, you'll see completed graphs and maps.
Viewing Data Volume Dashboards
All dashboards have a set of filters that you can apply to the entire dashboard. Use these filters to drill down and examine the data to a granular level.
- You can change the time range for a dashboard or panel by selecting a predefined interval from a drop-down list, choosing a recently used time range, or specifying custom dates and times. Learn more.
- You can use template variables to drill down and examine the data on a granular level. For more information, see Filtering Dashboards with Template Variables.
- Most Next-Gen apps allow you to provide the scope at the installation time and are comprised of a key (
_sourceCategoryby default) and a default value for this key. Based on your input, the app dashboards will be parameterized with a dashboard variable, allowing you to change the dataset queried by all panels. This eliminates the need to create multiple copies of the same dashboard with different queries.
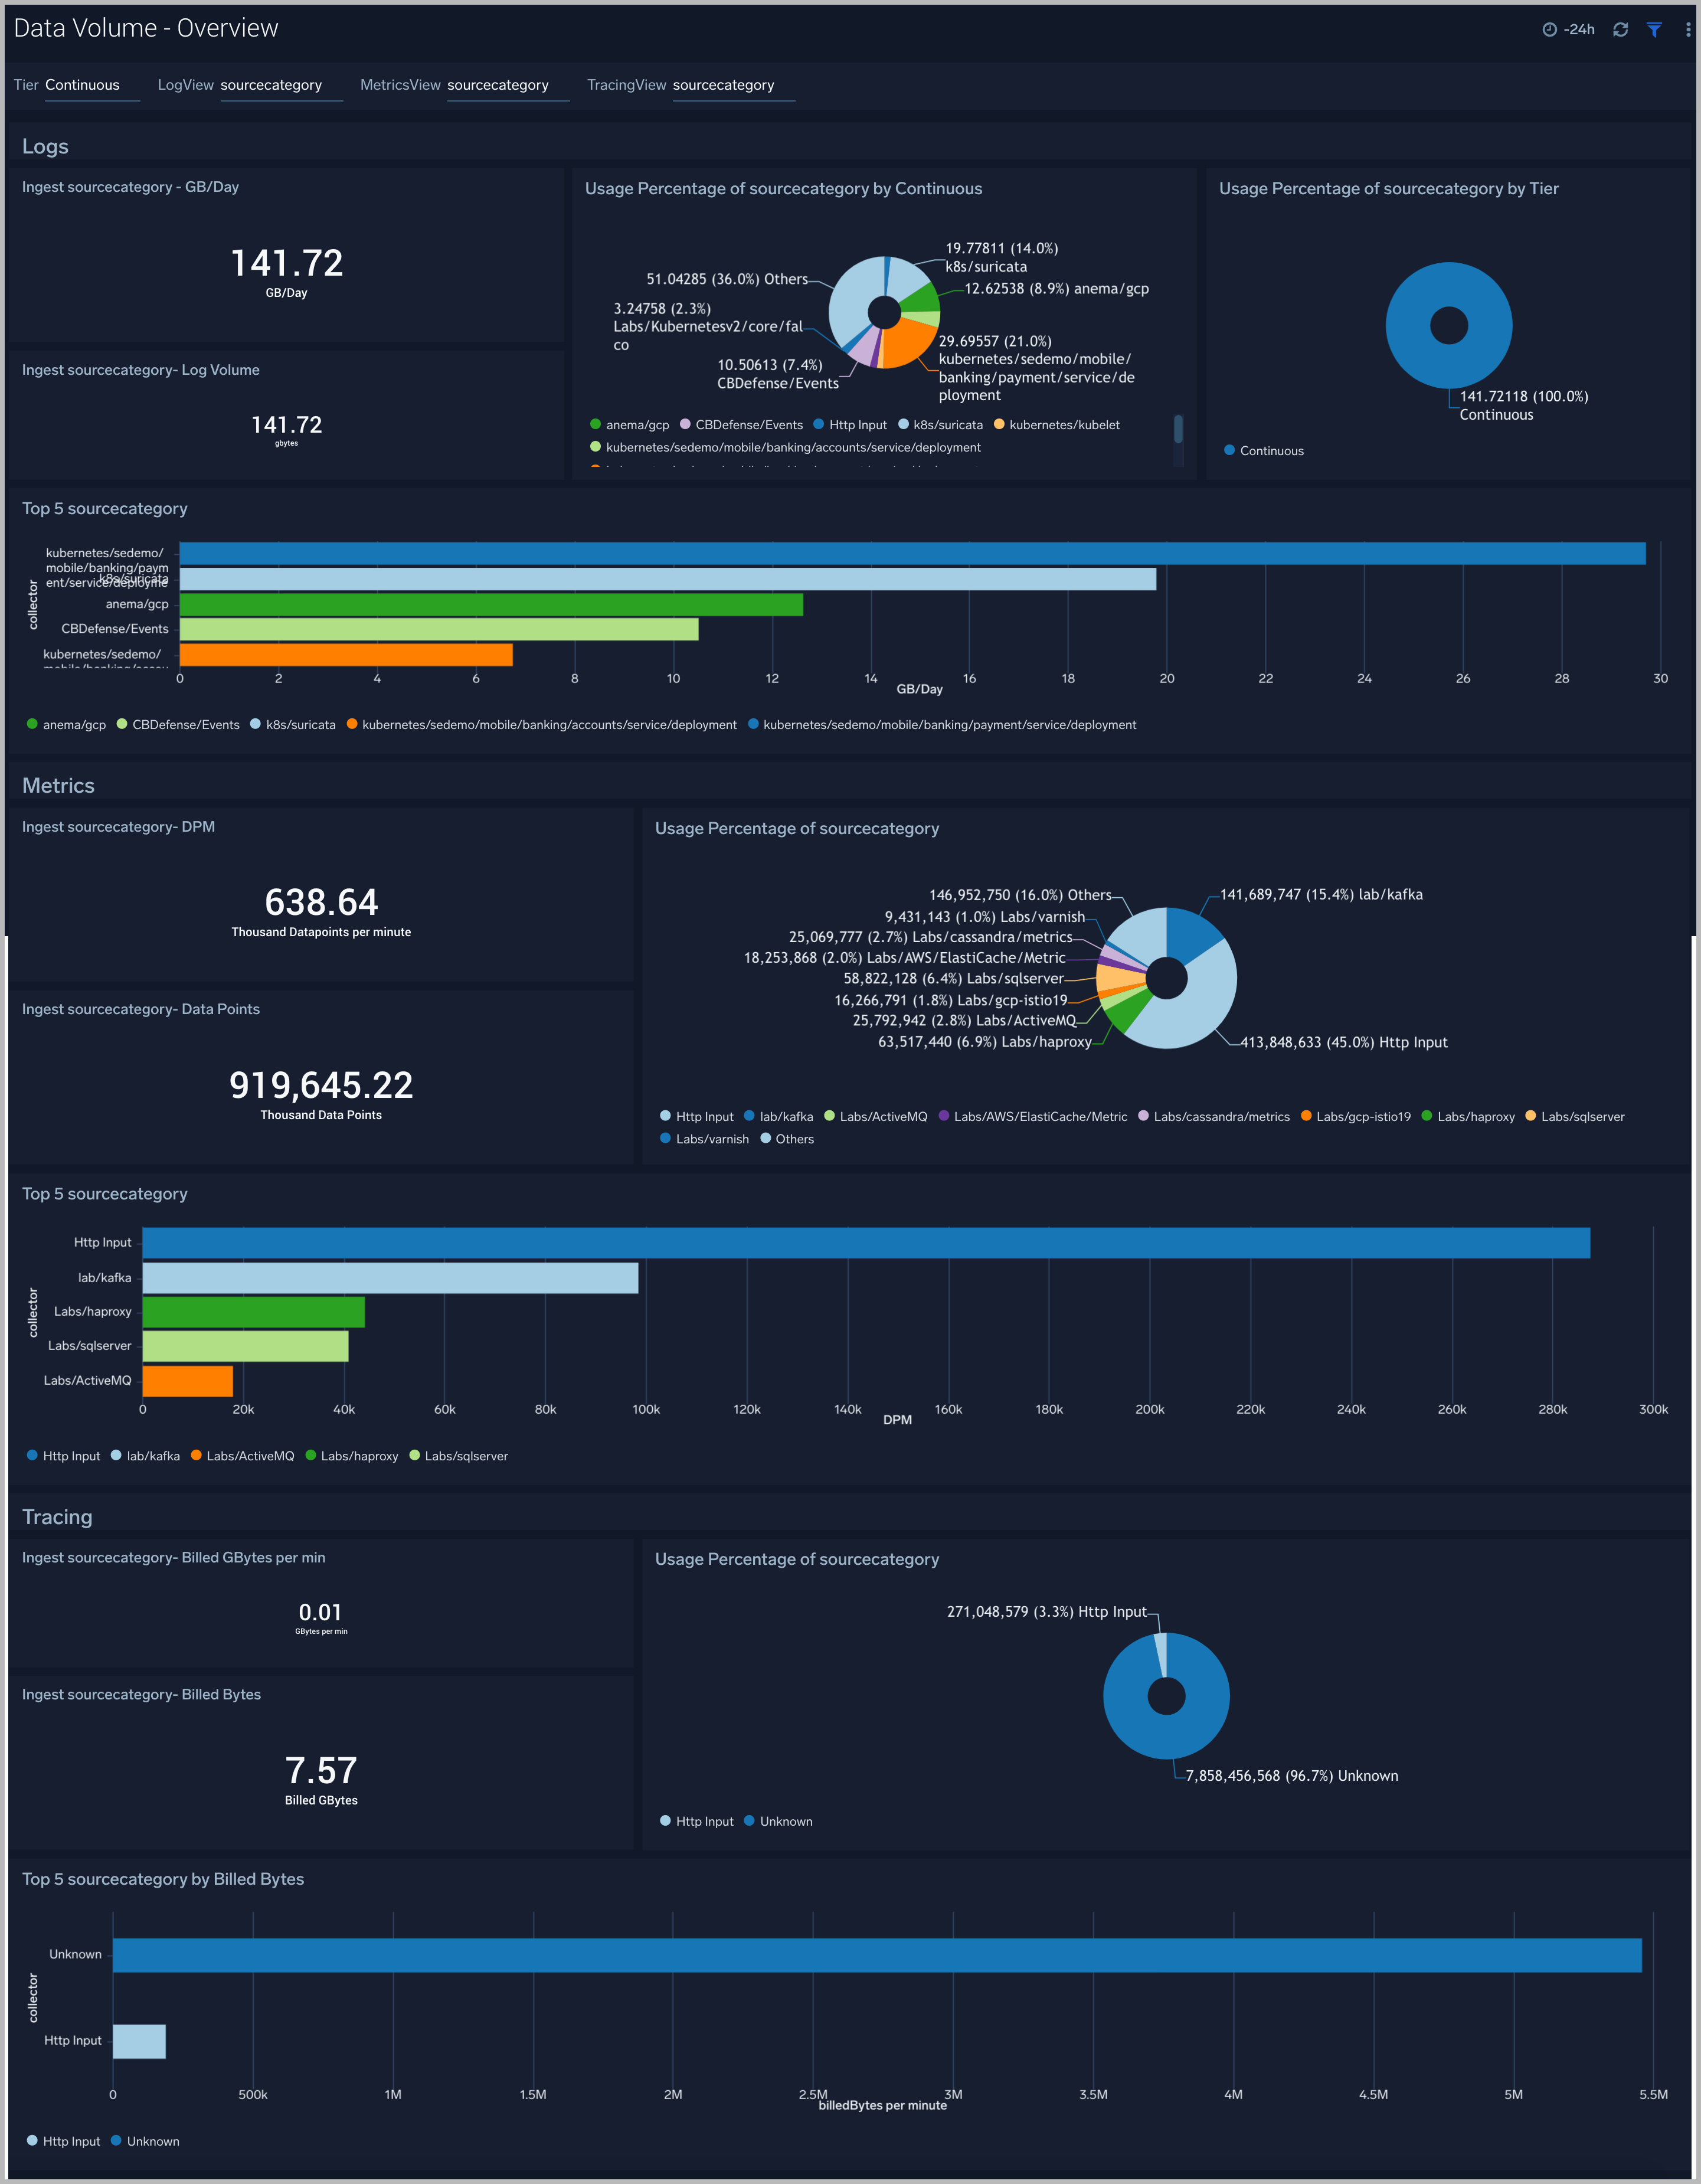
Overview
The Data Volume - Overview dashboard helps you understand your ingest in terms of Logs (by Tiers), Metrics, and Tracing capabilities.
Use this dashboard to:
- Identify the top sources, collectors, or hosts by ingesting data volume across logs, metrics, and traces
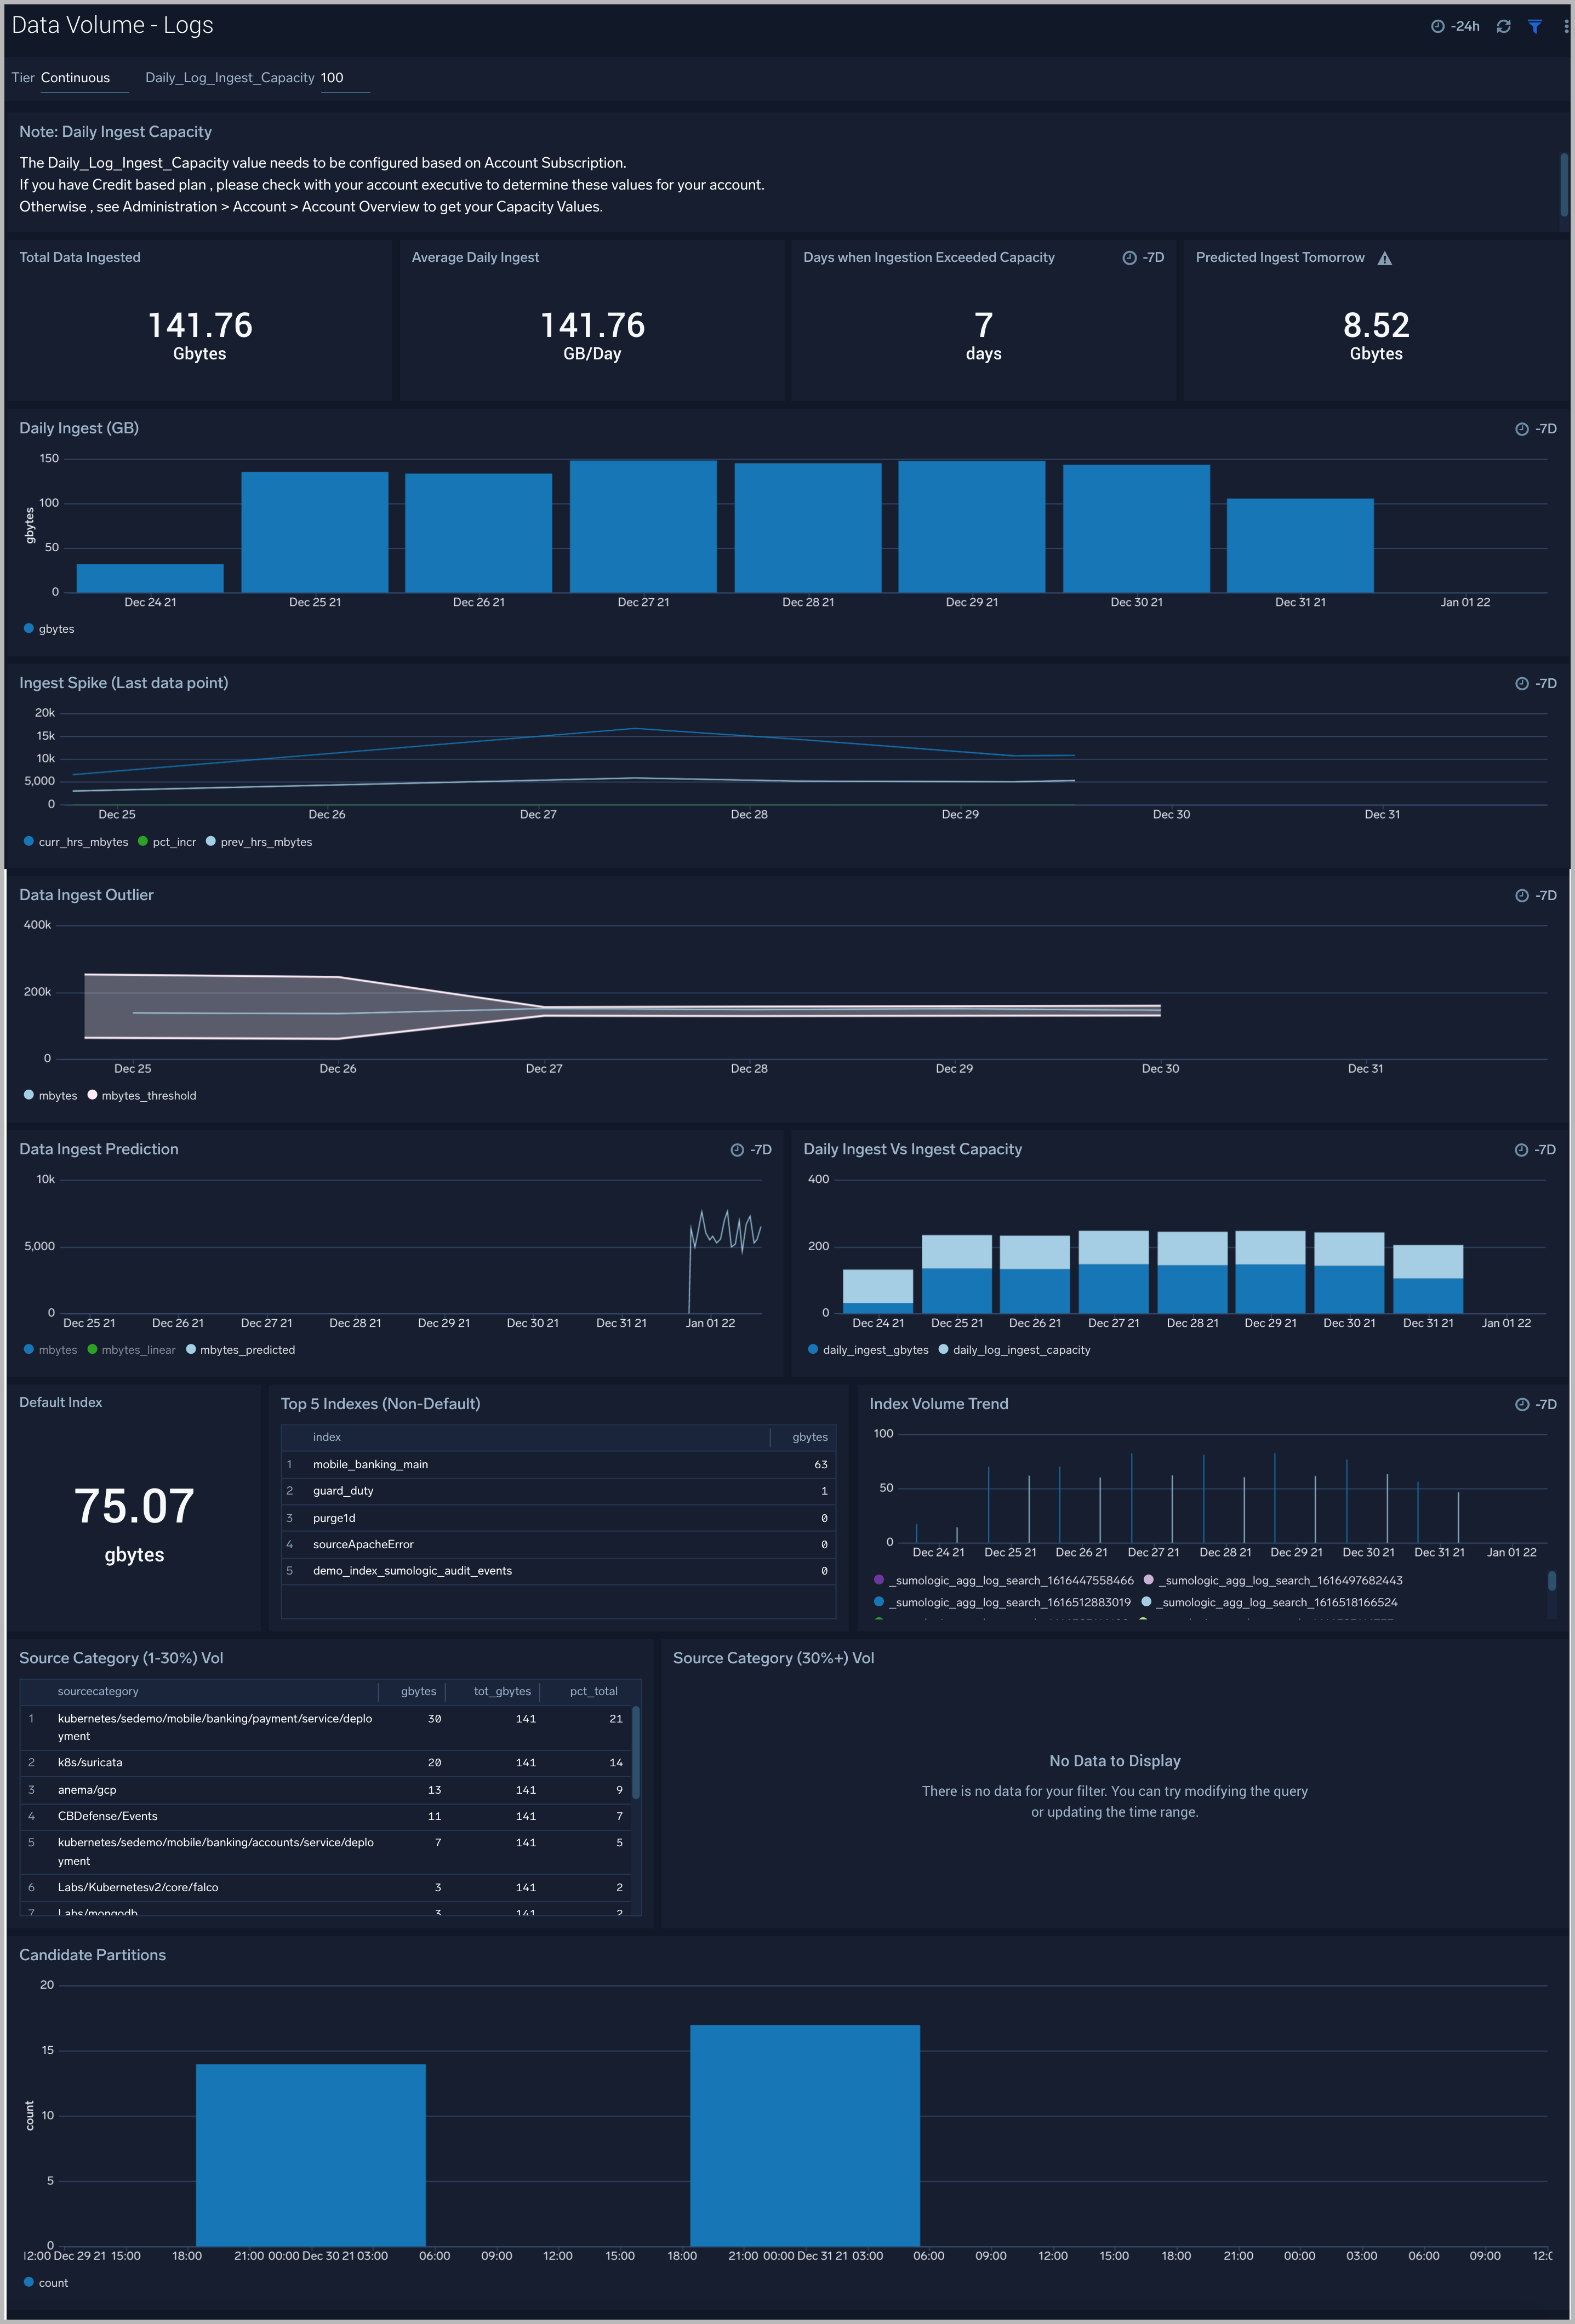
Logs
The largest data ingest typically comes from log volumes. The Data Volume - Logs dashboard allows you to view your log ingest volume by tier by ingesting spikes, outliers, and quota.
Use this dashboard to:
- Determine the log ingest volume and trends in GB across various tiers.
- Identify spikes where current hour ingestion is above 50% from the last hour. Identify outliers and forecast your data ingestion.
- Determine the log data for default index and top non-default indexes.
- Compare current ingestion to capacity and review any overages. You must configure the “Daily_Log_Ingest_Capacity” variable based on your Account Subscription. If you have Credit based plan, please check with your account executive to determine these values for your account. Otherwise, see the Account Overview page to get your capacity values.
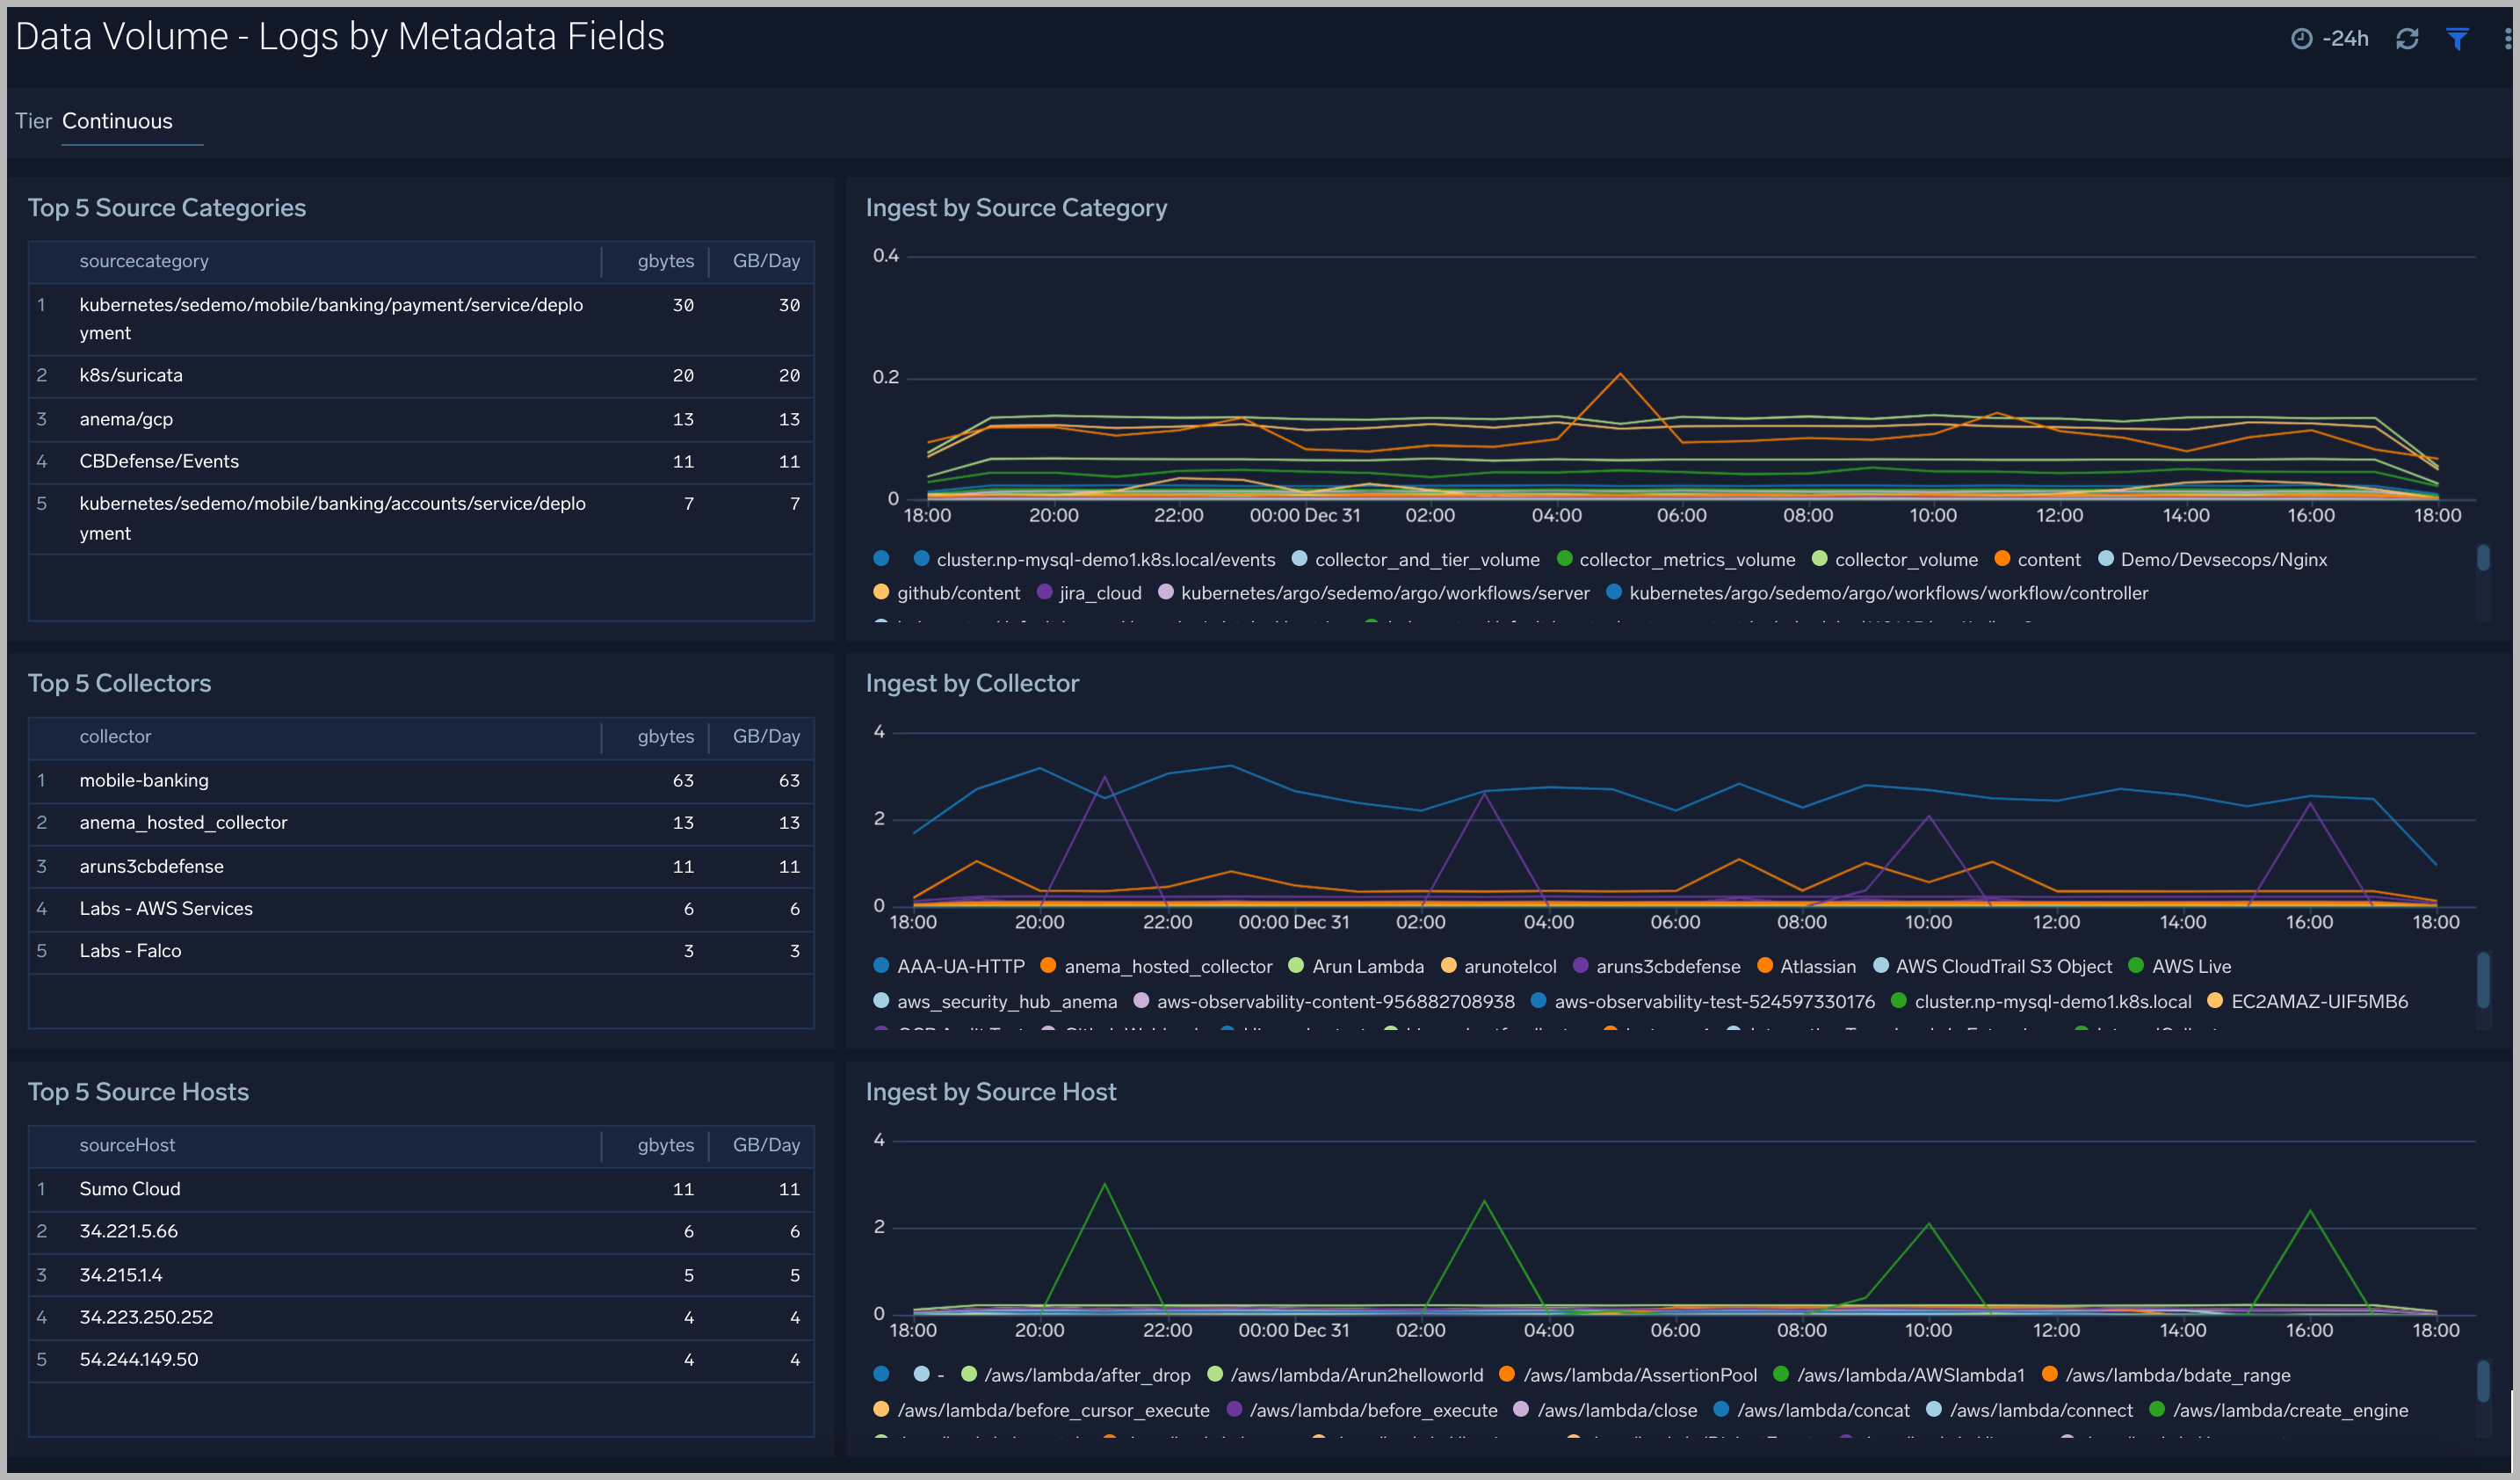
Data Volume Logs by Metadata Fields
The Data Volume - Logs by Metadata Fields dashboard allows you to view log ingest volume by tier, source categories, collectors, and hosts.
Use this dashboard to:
- Identify the top 5 sources categories, source hosts, and collectors by ingest volume
- Examine ingestion trends over time
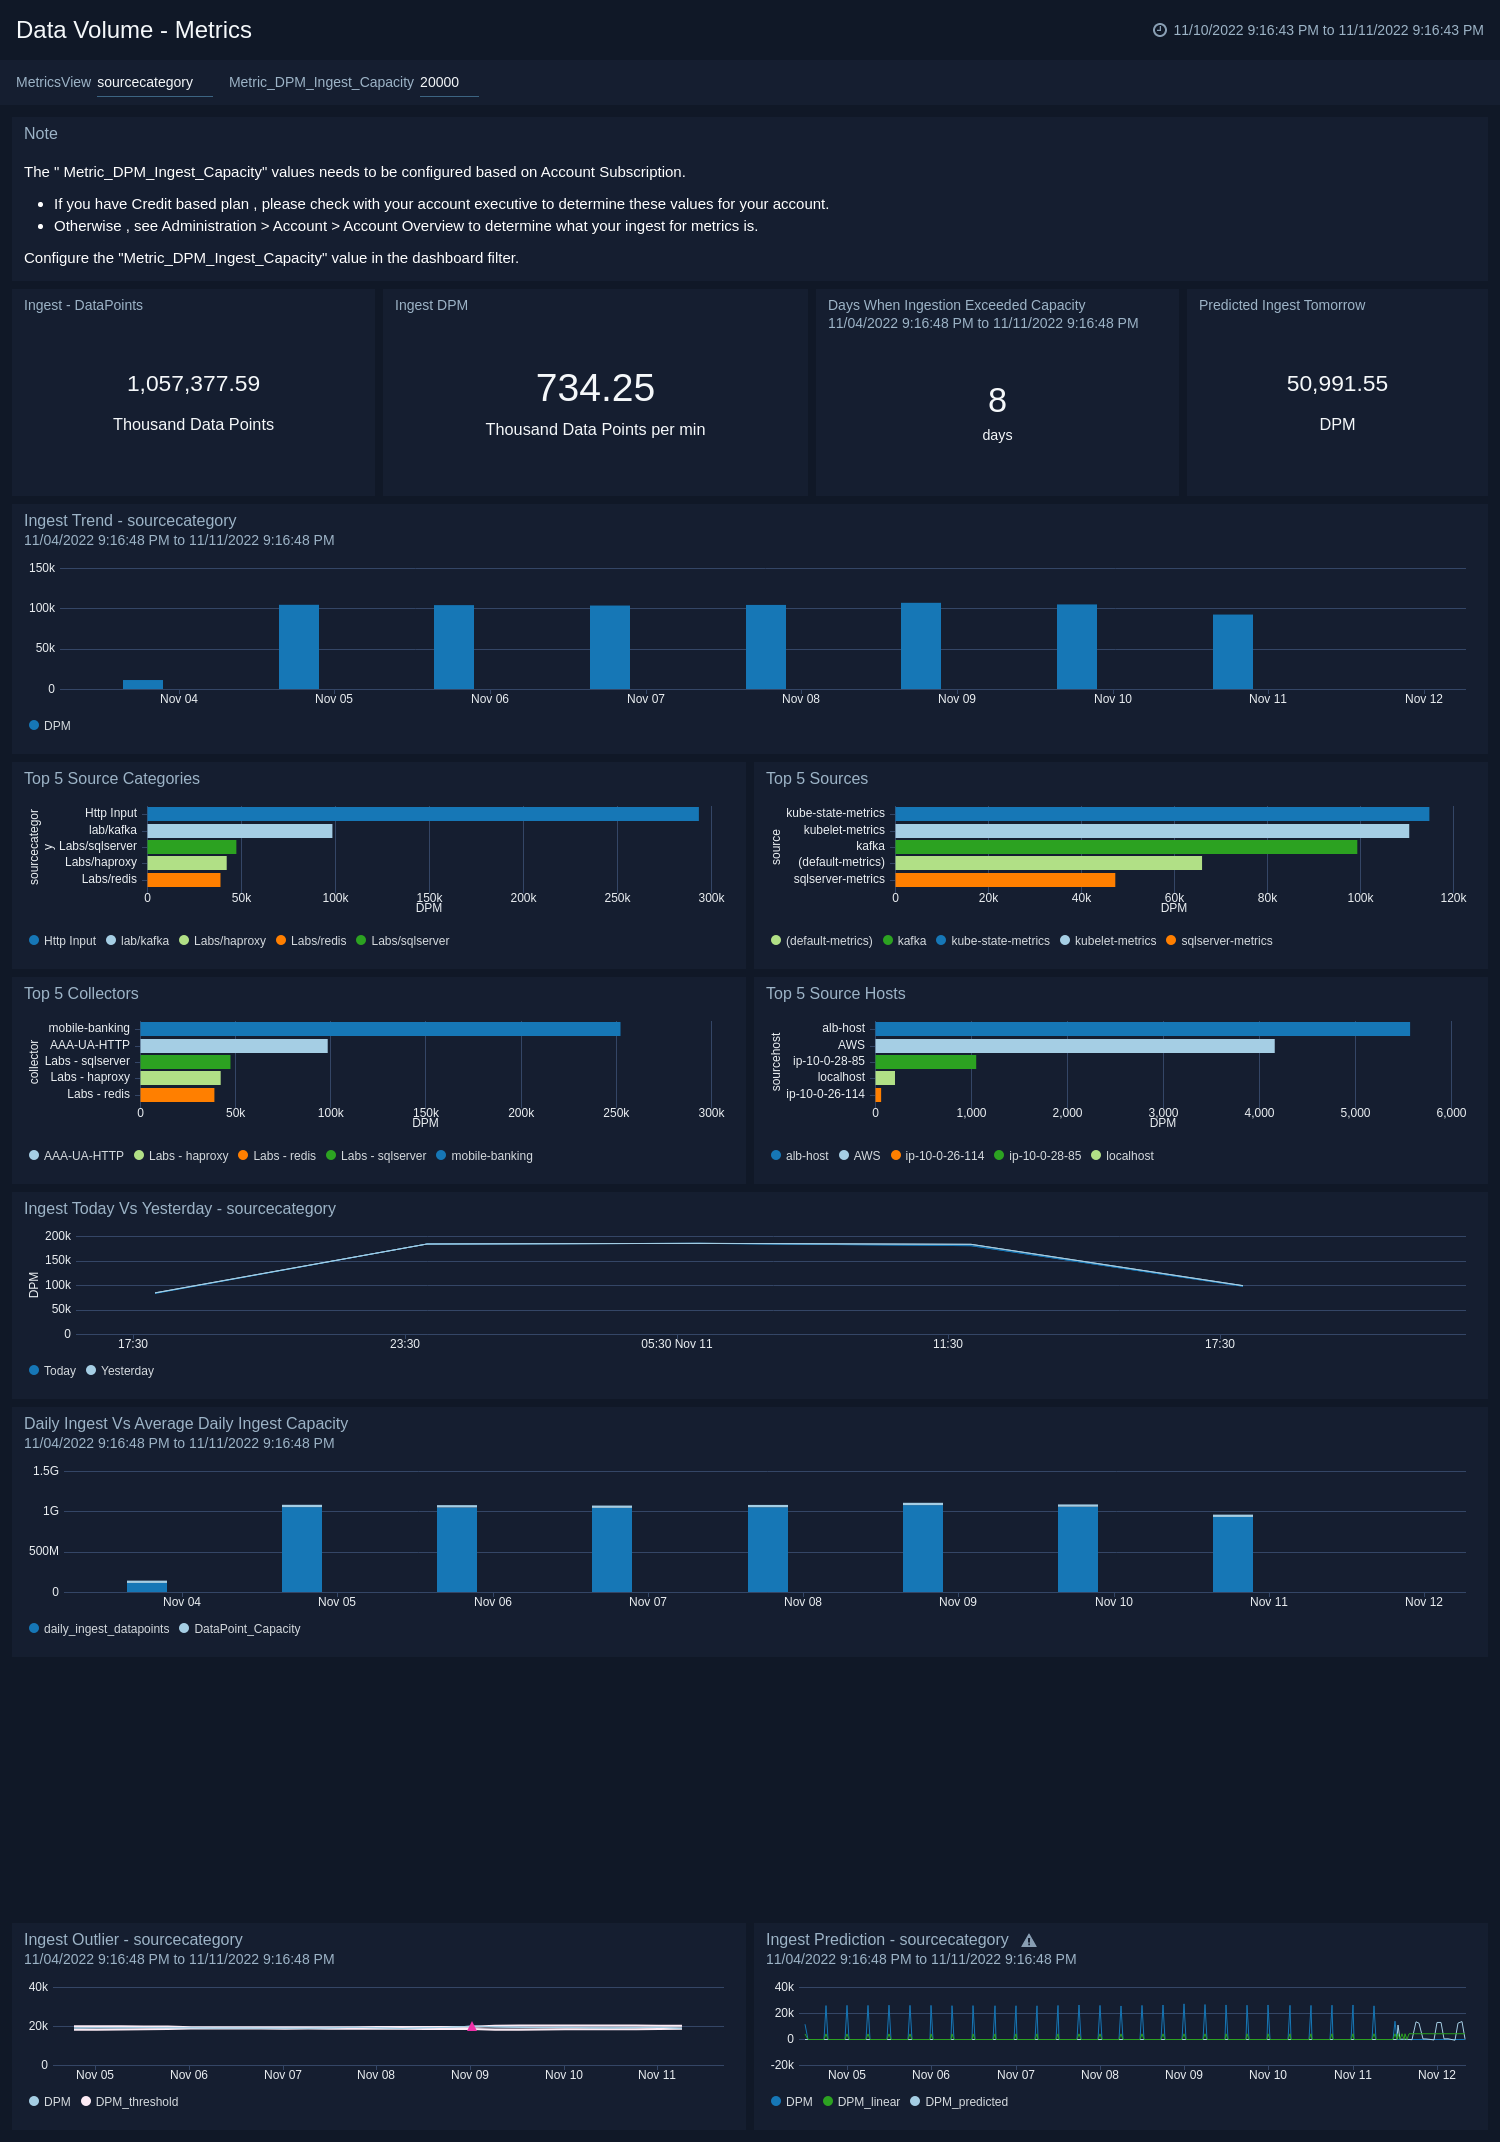
Metrics
The Data Volume - Metrics dashboard allows you to view your metrics ingested, identifies ingest outliers/spikes, and helps predict what ingestion is going to be.
Use this dashboard to:
- Determine the ingested DPM by various dimensions their
- Examine trends over time.
- Identify the spikes where current hour ingestion is above 50% from the last hour.
- Identify ingestion outliers and forecast data ingestion, analyze the comparison of your current ingestion to your capacity, and review any overages. You must configure the “Metric_DPM_Ingest_Capacity” variable that needs to be configured based on Account Subscription. If you have a Credit-based plan, please check with your account executive to determine these values for your account. Otherwise, see the Account Overview page to see your Capacity Values.
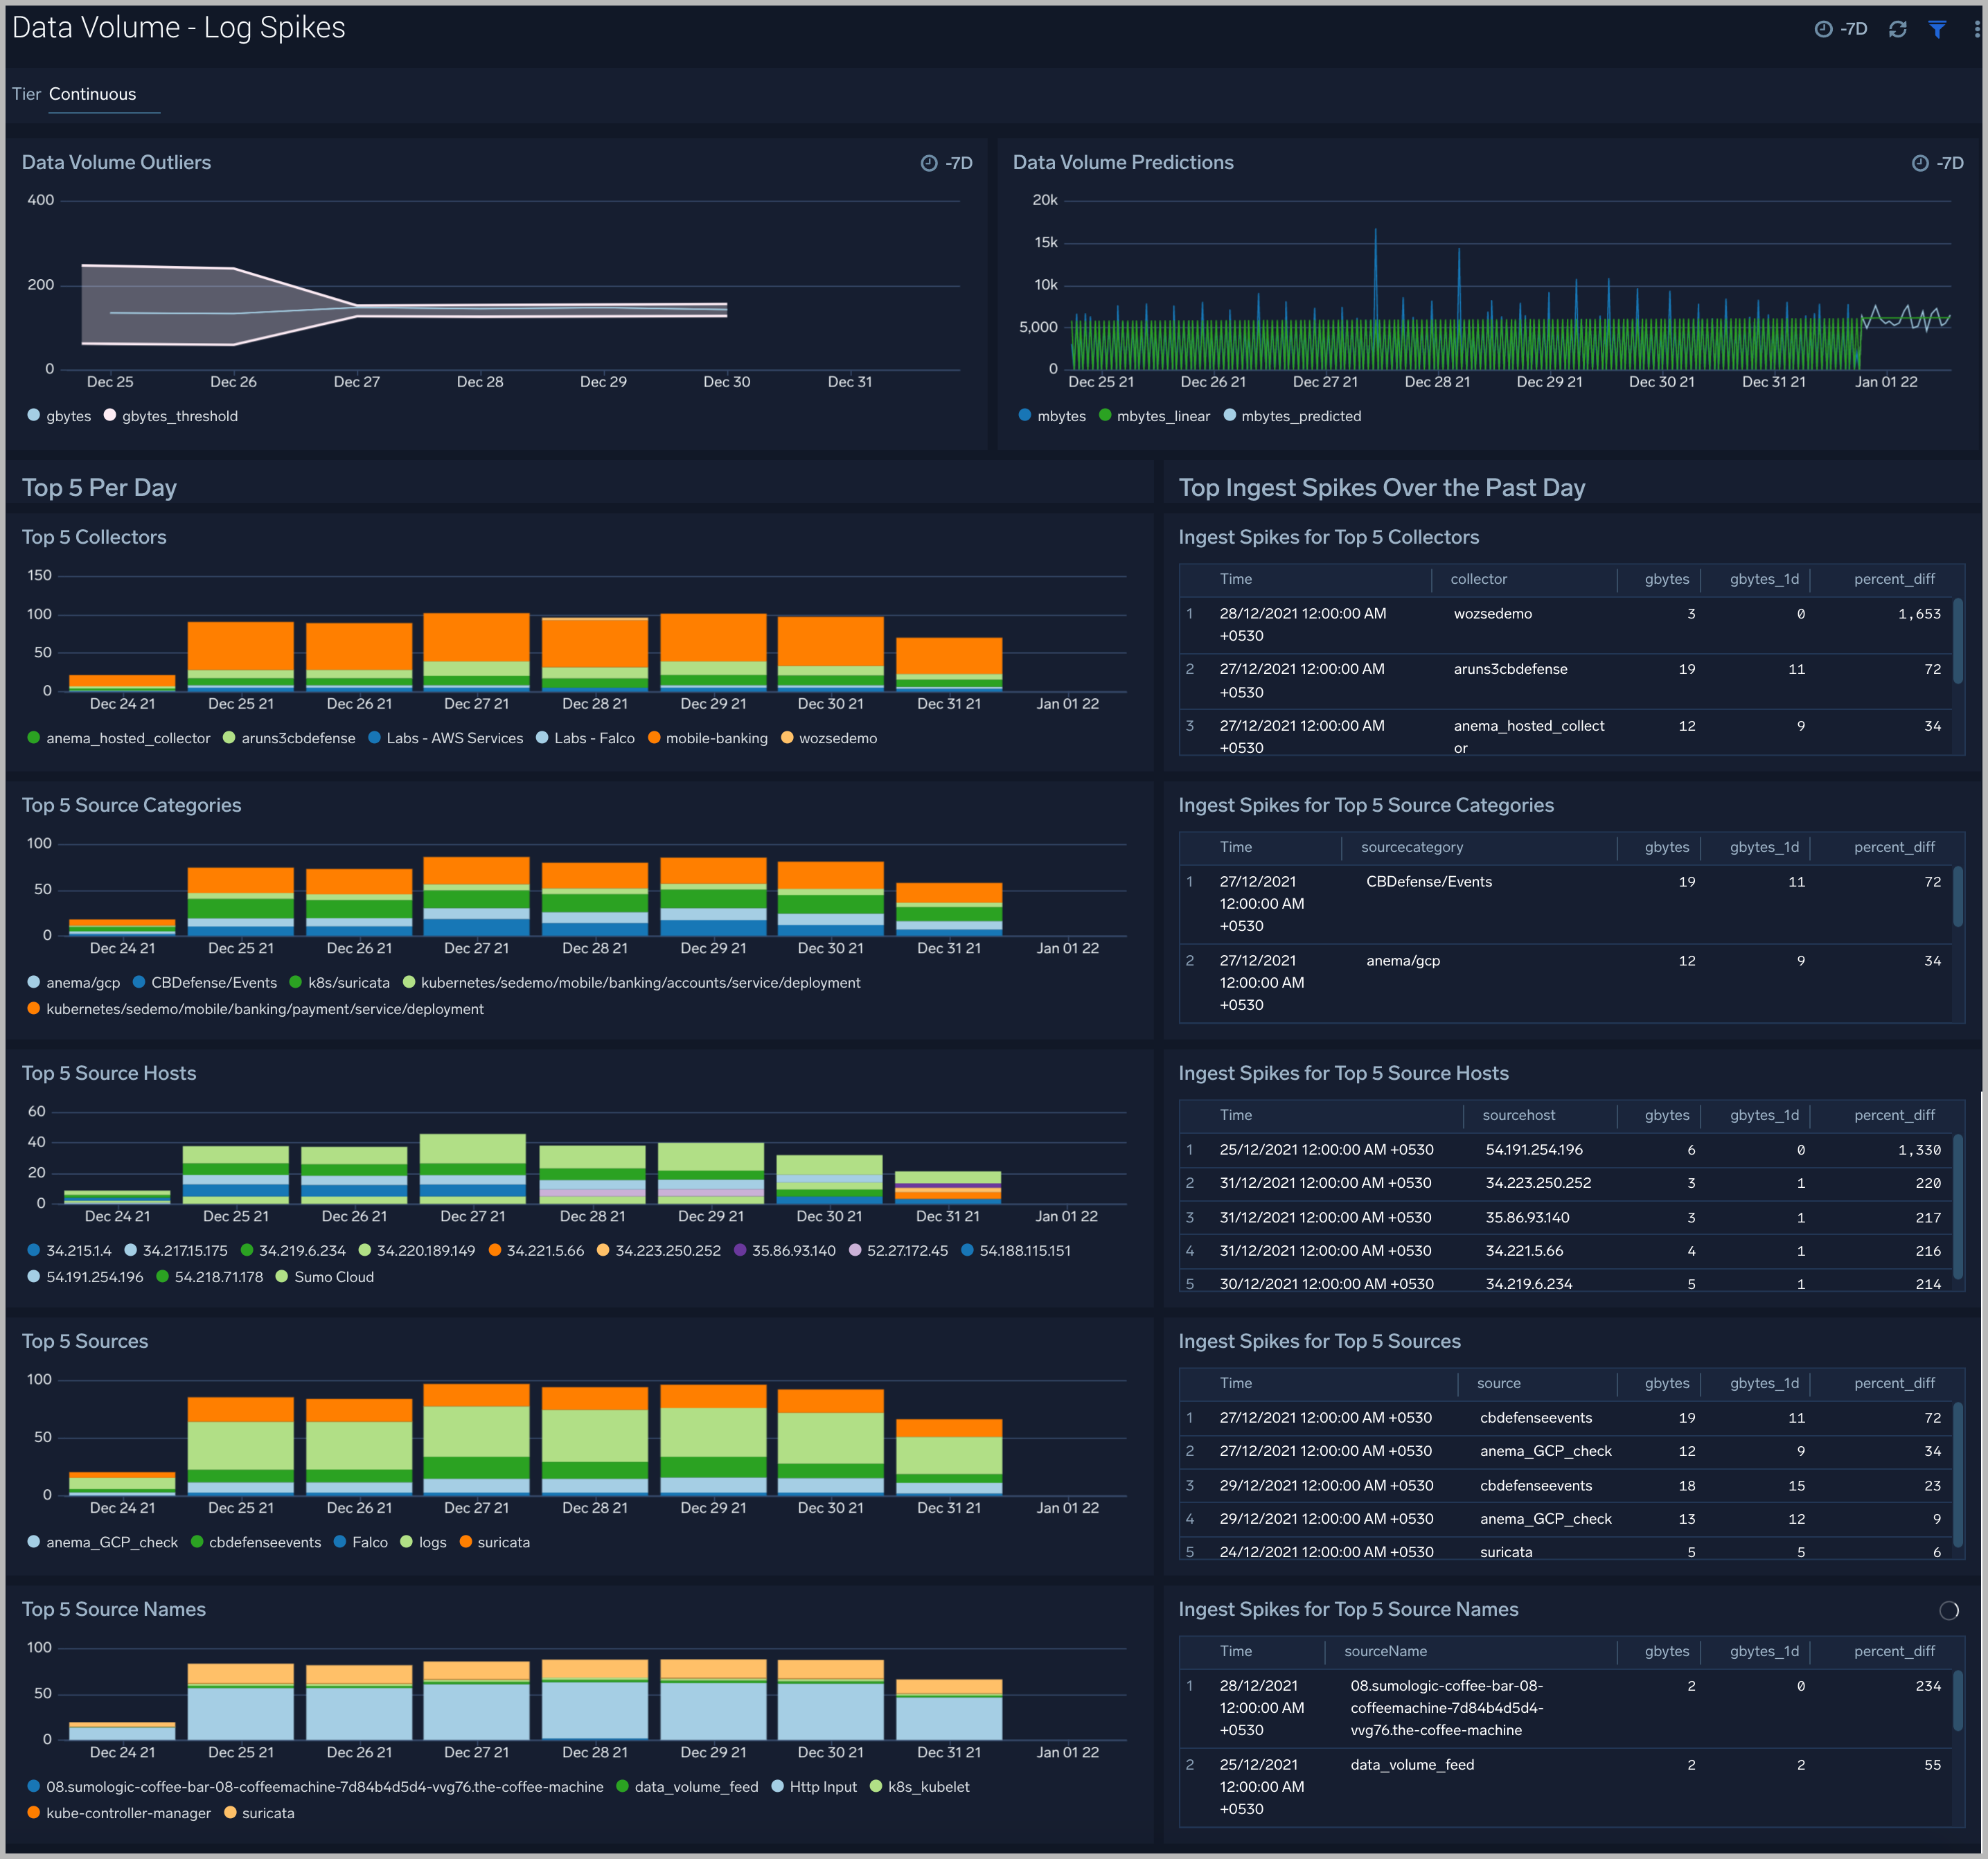
Log Spikes
The Data Volume - Log Spikes Dashboard helps you quickly identify significant increases in data ingested. Review details of your data ingested for logs.
Use this dashboard to:
- Identify ingest outliers
- Determine the spikes for top sources compared with the previous day
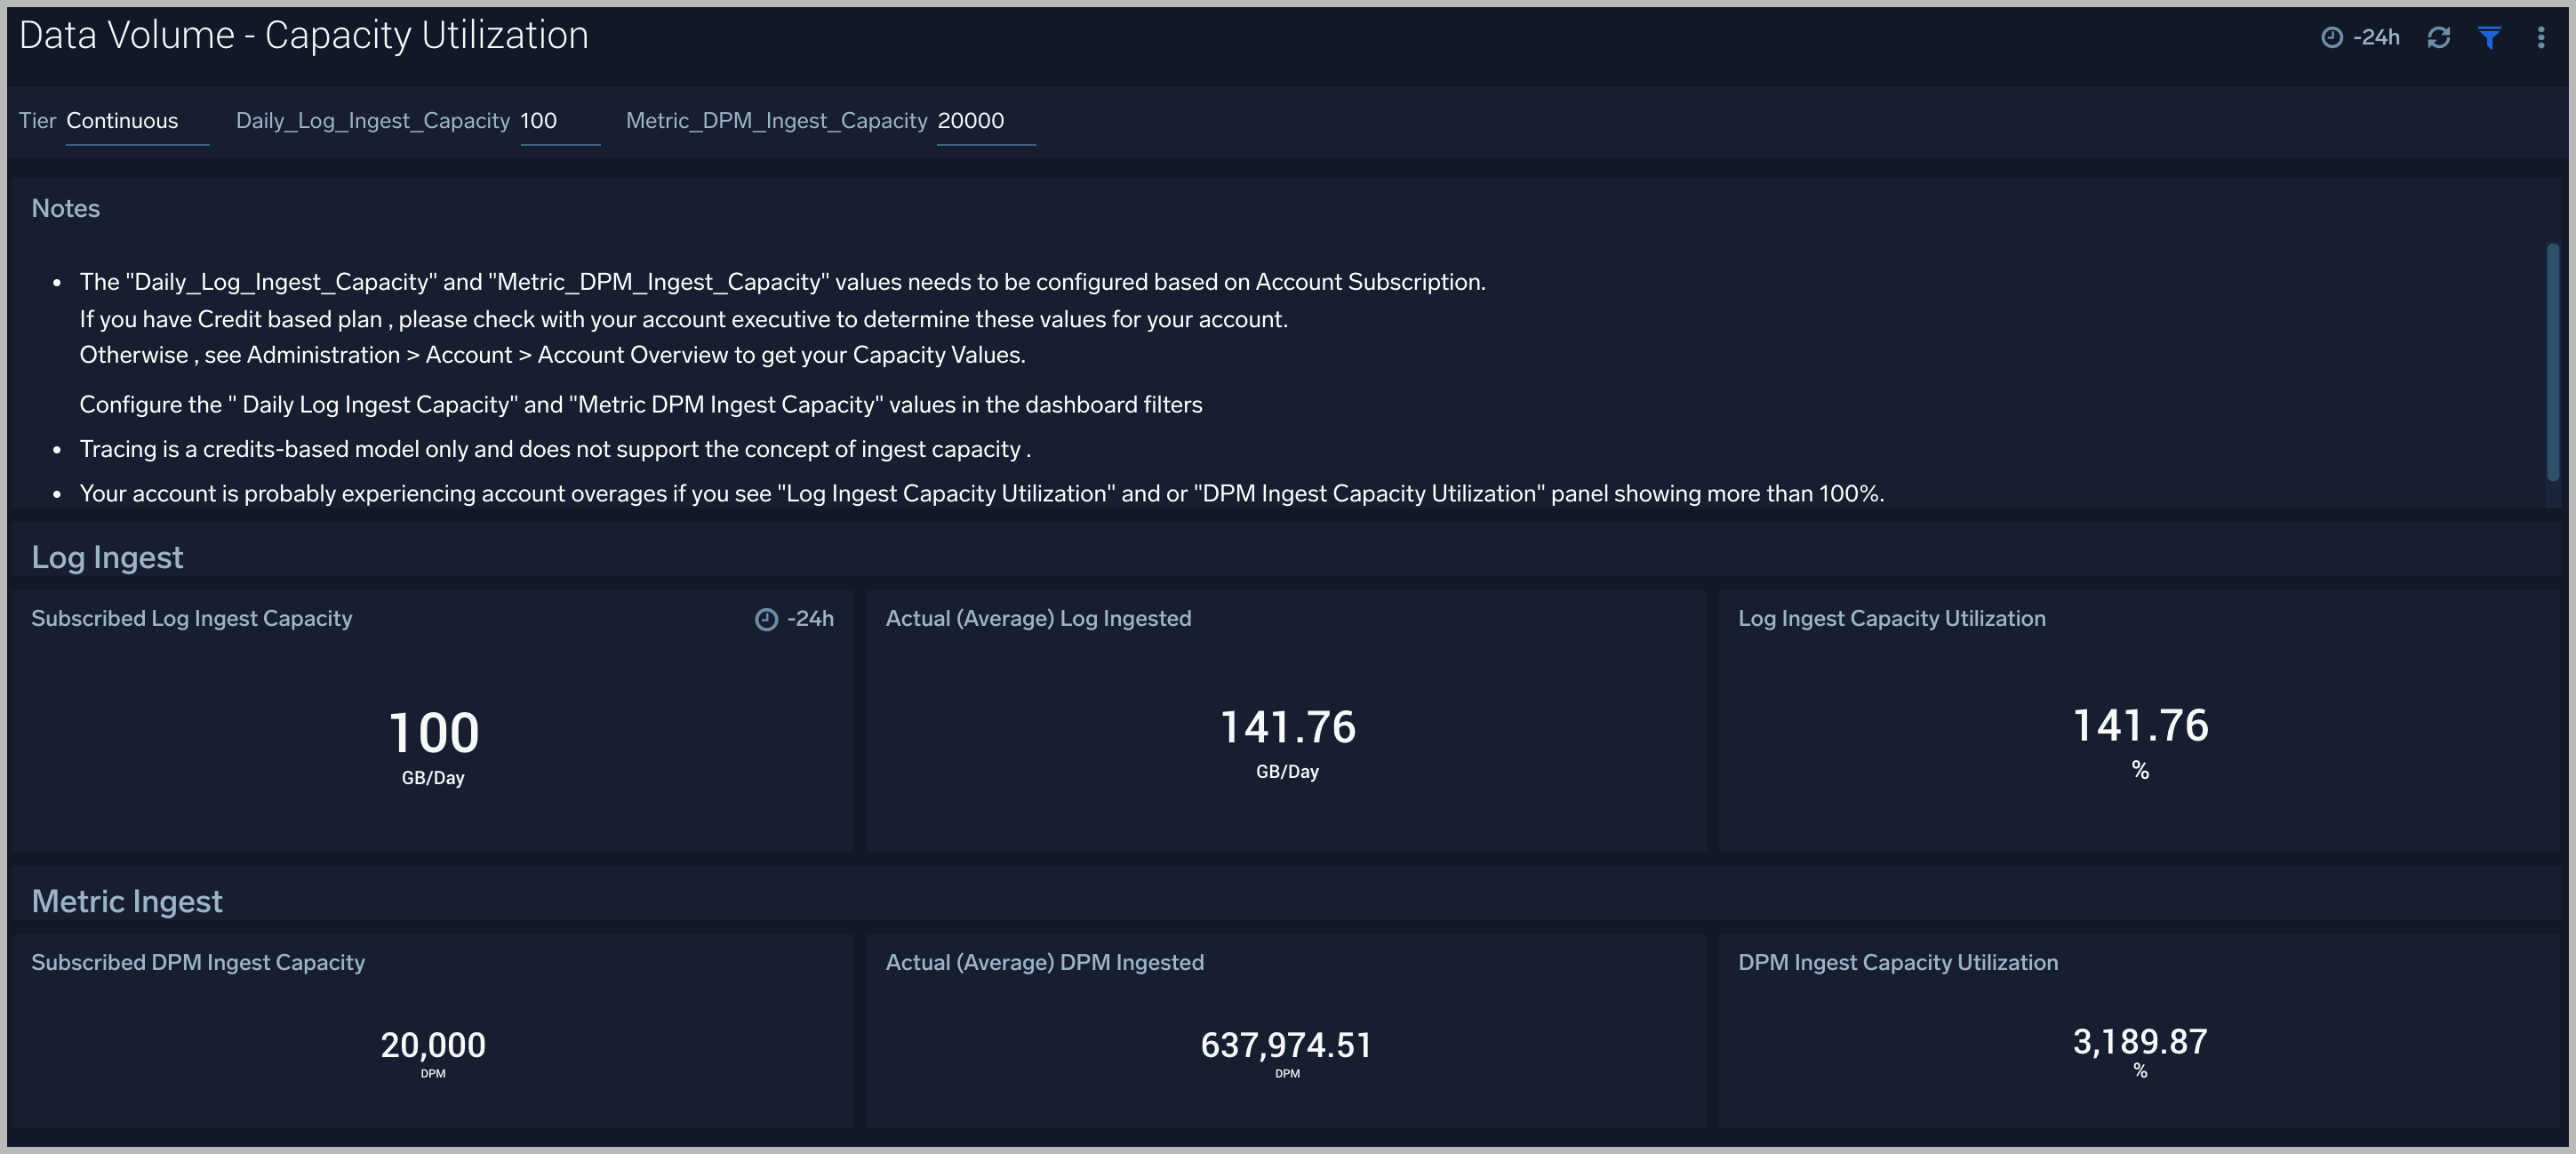
Capacity Utilization
The Data Volume - Capacity Utilization dashboard provides views of subscribed, actual, and percentage capacity utilization for logs and metrics.
Use this dashboard to:
- Identify the log and metrics ingestion capacity of your subscription. You must configure the "Daily_Log_Ingest_Capacity" and “Metric_DPM_Ingest_Capacity” variables based on your plan with Sumo Logic. If you have a Credit-based plan, please check with your account executive to determine these values for your account. Otherwise, see the Account Overview page to view the log ingest capacity value and metric DPM ingest capacity value.
- Identify the average ingestion and subscribed ingestion capacity by percentage for logs and metrics.
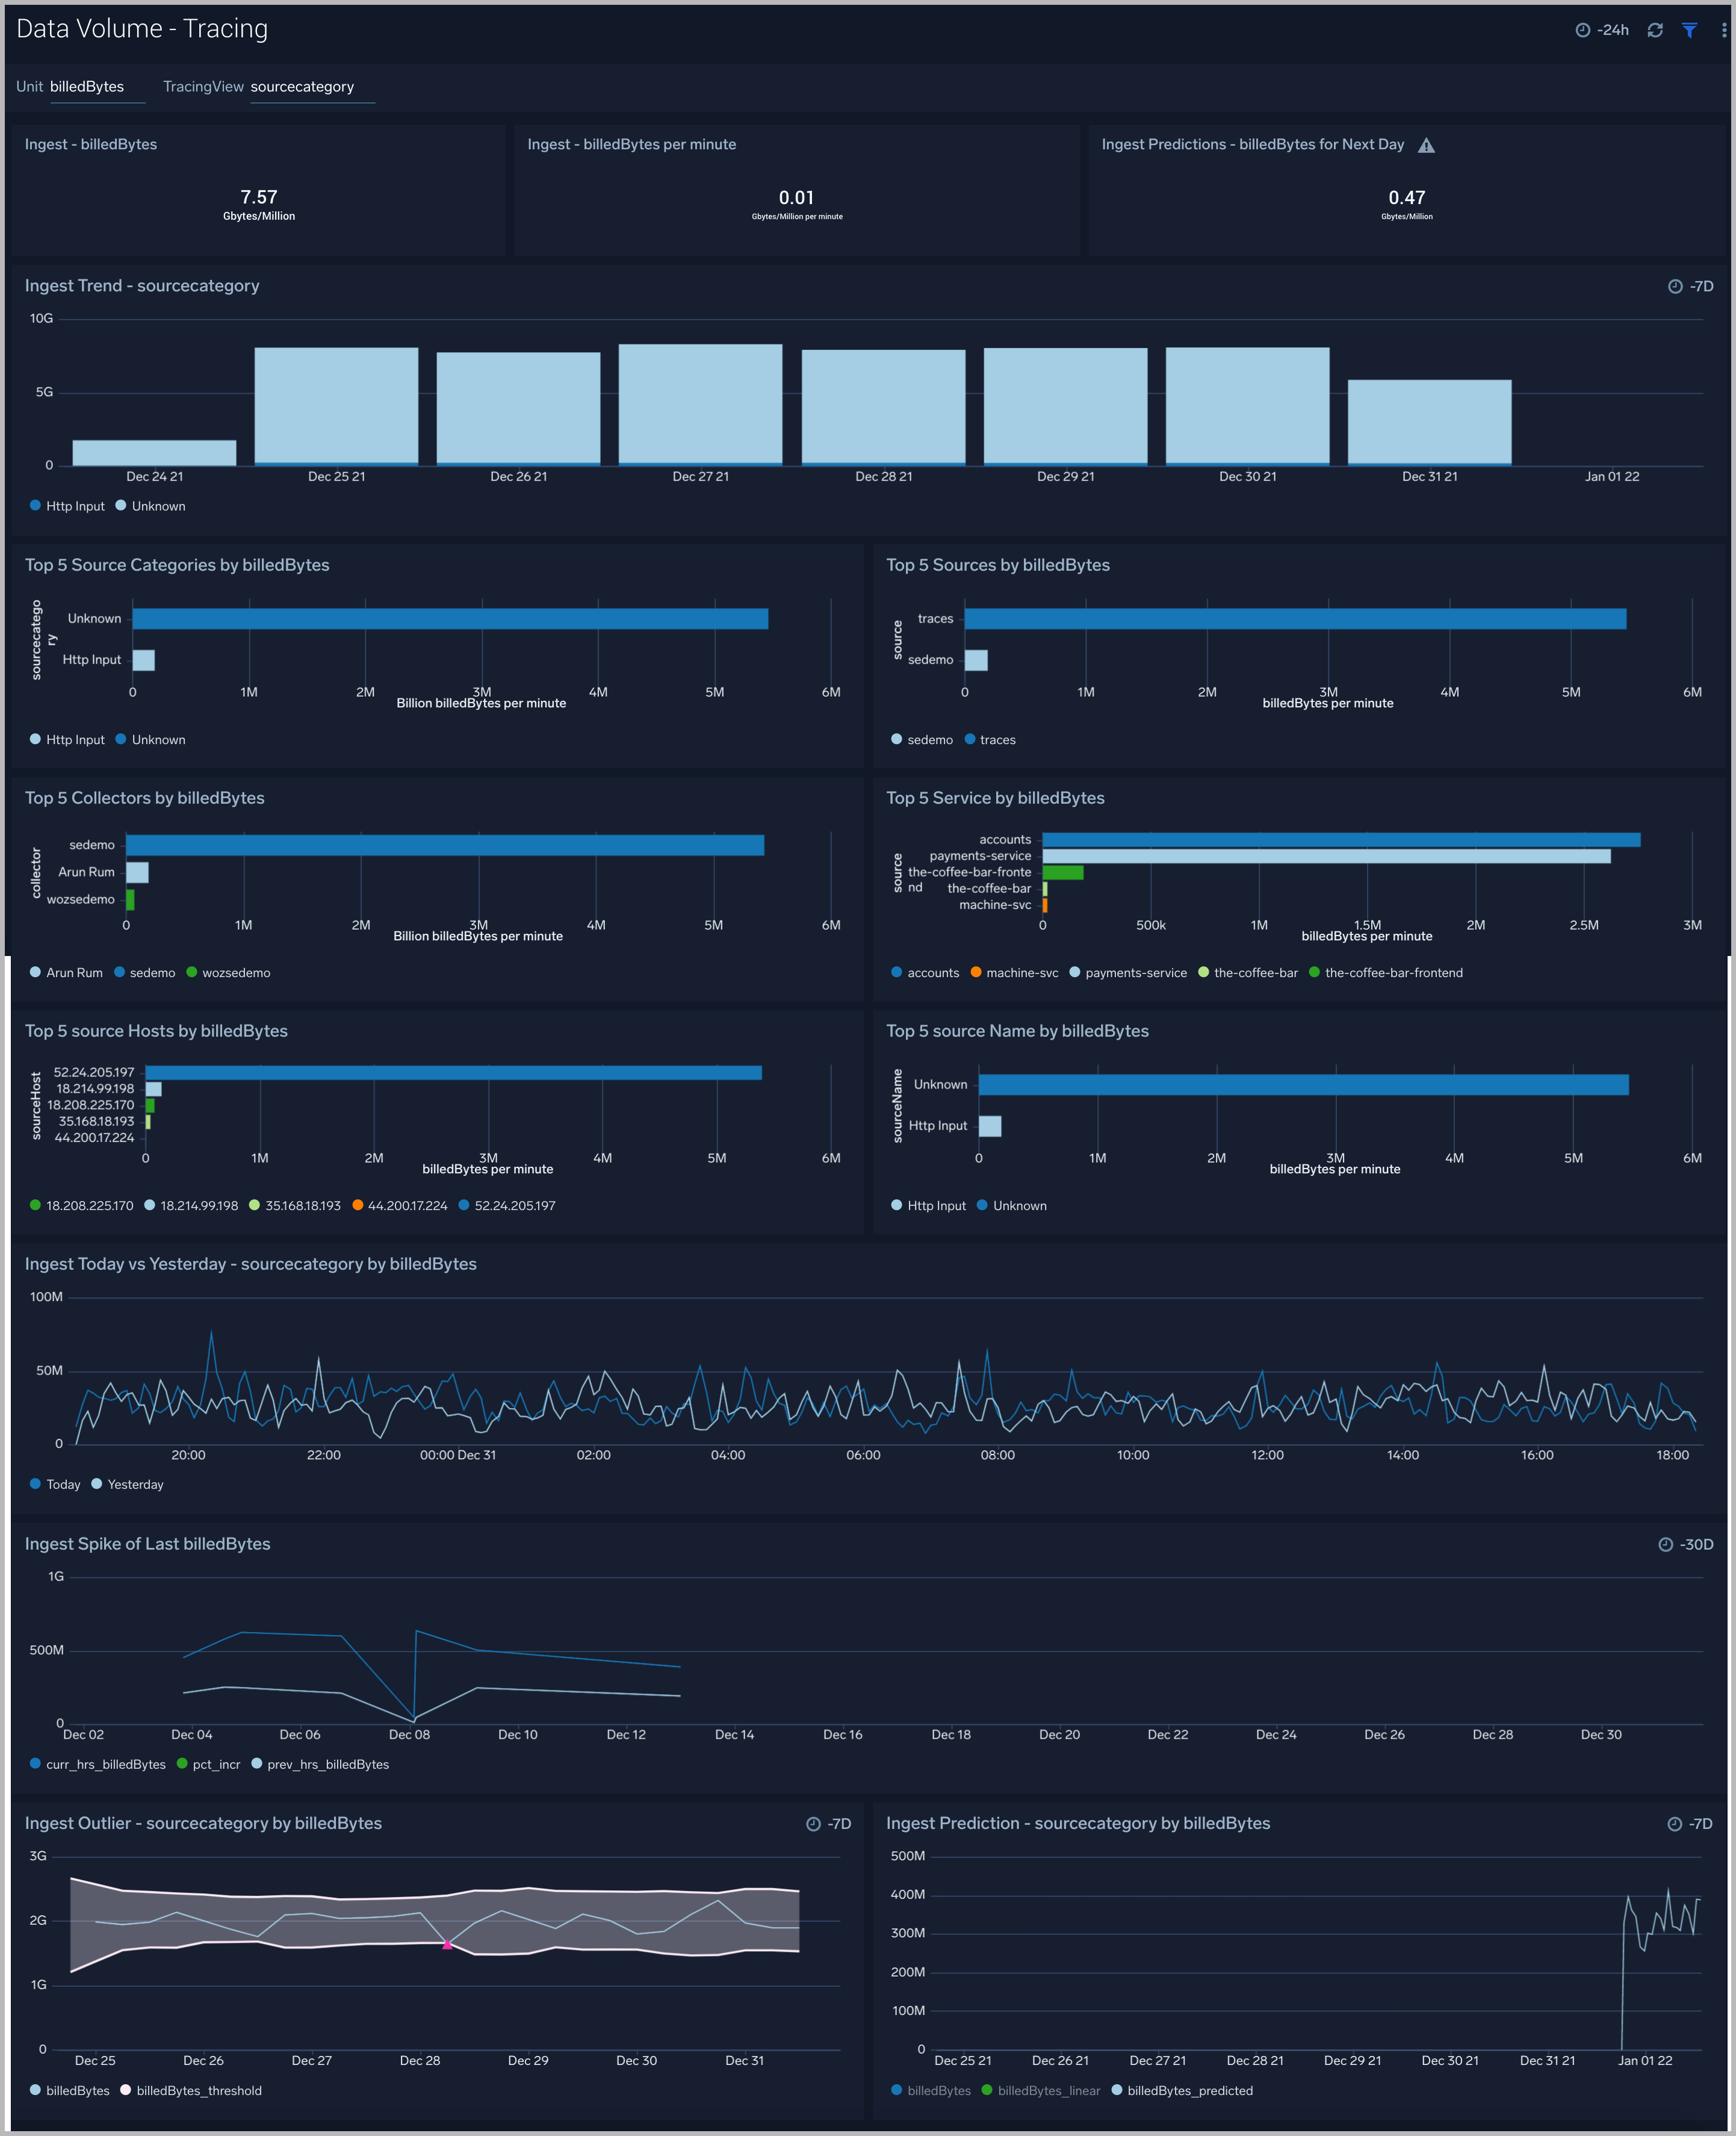
Tracing
The Data Volume - Tracing dashboard provides views of your Tracing data ingest by billed bytes and span counts per minute.
Use this dashboard to:
- Determine the ingested billedBytes/spansCount for tracing and examine trends over time.
- Identify spikes in ingestion, where ingestion for the current hour is above by 50% from the last hour.
- Identify the outliers (and forecast your data ingestion).
- Identify the top 5 source categories, source hosts, sources, and collectors by span count and billed bytes.
Upgrade/Downgrade the Data Volume app (Optional)
To update the app, do the following:
- Select App Catalog.
- In the Search Apps field, search for and then select your app.
Optionally, you can identify apps that can be upgraded in the Upgrade available section. - To upgrade the app, select Upgrade from the Manage dropdown.
- If the upgrade does not have any configuration or property changes, you will be redirected to the Preview & Done section.
- If the upgrade has any configuration or property changes, you will be redirected to Setup Data page.
- In the Configure section of your respective app, complete the following fields.
- Key. Select either of these options for the data source.
- Choose Source Category and select a source category from the list for Default Value.
- Choose Custom and enter a custom metadata field. Insert its value in Default Value.
- Key. Select either of these options for the data source.
- Click Next. You will be redirected to the Preview & Done section.
- In the Configure section of your respective app, complete the following fields.
Post-update
Your upgraded app will be installed in the Installed Apps folder, and dashboard panels will start to fill automatically.
See our Release Notes changelog for new updates in the app.
To revert the app to a previous version, do the following:
- Select App Catalog.
- In the Search Apps field, search for and then select your app.
- To version down the app, select Revert to < previous version of your app > from the Manage dropdown.
Uninstalling the Data Volume app (Optional)
To uninstall the app, do the following:
- Select App Catalog.
- In the 🔎 Search Apps field, run a search for your desired app, then select it.
- Click Uninstall.