Flex
With Sumo Logic Flex, you gain an efficient and centralized log analytics framework capable of managing enterprise-wide cloud-scale log ingestion without cost concerns. It aligns cost to business value and overcomes today’s ever-growing data challenge by only charging customers for data storage and analytics executed. This revolutionary new consumption model provides customers with a scalable and efficient log analytics architecture that grows to manage enterprise-wide and cloud-scale log ingestion without the risk of runaway costs.
Micro Lesson: Viewing the Flex App Dashboards
Log types
By default, Data Volume Index and Search Audit Index are enabled to collect data for the Flex app.
Log samples
Click to expand
[
    {
    "field":"sourcename_and_tier_volume",
    "dataTier":"Flex",
    "sizeInBytes":11555,
    "count":1
    },
    {
    "field":"collector_and_tier_volume",
    "dataTier":"Flex",
    "sizeInBytes":366,
    "count":1
    },
    {
    "field":"source_metrics_volume",
    "dataTier":"Flex",
    "sizeInBytes":4463,
    "count":47
    },
    {
    "field":"source_and_tier_volume",
    "dataTier":"Flex",
    "sizeInBytes":731,
    "count":1
    },
    {
    "field":"sourcehost_metrics_volume",
    "dataTier":"Flex",
    "sizeInBytes":4973,
    "count":47
    },
    {
    "field":"sourcecategory_metrics_volume",
    "dataTier":"Flex",
    "sizeInBytes":5362,
    "count":47
    },
    {
    "field":"PDET/CIS/AWS/Vanta/Flow",
    "dataTier":"Flex",
    "sizeInBytes":70759,
    "count":126
    },
    {
    "field":"collector_volume",
    "dataTier":"Flex",
    "sizeInBytes":262,
    "count":1
    },
    {
    "field":"sourcename_metrics_volume",
    "dataTier":"Flex",
    "sizeInBytes":5481,
    "count":47
    },
    {
    "field":"collector_metrics_volume",
    "dataTier":"Flex",
    "sizeInBytes":5159,
    "count":47
    },
    {
    "field":"view_volume",
    "dataTier":"Flex",
    "sizeInBytes":364,
    "count":1
    },
    {
    "field":"",
    "dataTier":"Flex",
    "sizeInBytes":333,
    "count":19
    },
    {
    "field":"PDET/CIS/AWS/GuardDuty",
    "dataTier":"Flex",
    "sizeInBytes":30471,
    "count":15},
    {
    "field":"sourcehost_and_tier_volume",
    "dataTier":"Flex",
    "sizeInBytes":1158,
    "count":1
    },
    {
    "field":"view_and_tier_volume",
    "dataTier":"Flex",
    "sizeInBytes":546,
    "count":1
    },
    {
    "field":"PDET/CIS/AWS/CloudTrail/Analytics",
    "dataTier":"Flex",
    "sizeInBytes":62273,
    "count":70
    },
    {
    "field":"sourcecategory_volume",
    "dataTier":"Flex",
    "sizeInBytes":6485,
    "count":1
    },
    {
    "field":"sourcehost_volume",
    "dataTier":"Flex",
    "sizeInBytes":794,
    "count":1
    },
    {
    "field":"sedemostag/events",
    "dataTier":"Flex",
    "sizeInBytes":22790,
    "count":19
    },
    {
    "field":"source_volume",
    "dataTier":"Flex",
    "sizeInBytes":497,
    "count":1
    }
]
Sample queries
_index=sumologic_volume
| parse regex "(?<data>\{[^\{]+\})" multi
| json field=data "field","dataTier","sizeInBytes","count" as sourcecategory, dataTier, bytes, count
| where _sourceCategory matches "sourcecategory_and_tier_volume" and dataTier matches "Flex"
| bytes/1024/1024/1024 as gbytes
| sum(gbytes) as gbytes
| ((queryEndTime() - queryStartTime())/(1000*60*60*24)) as duration_in_day
| gbytes / duration_in_day as %"GB/Day"
| fields %"GB/Day"
For more examples, refer to Log and Tracing Data Volume Index and Metrics Data Volume Index.
Installing the Flex app
Flex app will be pre-installed for all the Flex users.
- Navigate to App Catalog > Installed Apps to find the installed Flex app.
- Click the Flex app tile.
- Go to What's Included > Dashboards: View content in Library to preview the dashboards.
If you do not have the Flex app installed, follow the below steps.
To install the app:
- Select App Catalog.
- In the Search Apps field, search for and then select your app.
- Optionally, you can scroll down to preview the dashboards included with the app. Then, click Install App (sometimes this button says Add Integration).
- Click Next.
- Look for the dialog confirming that your app was installed successfully.
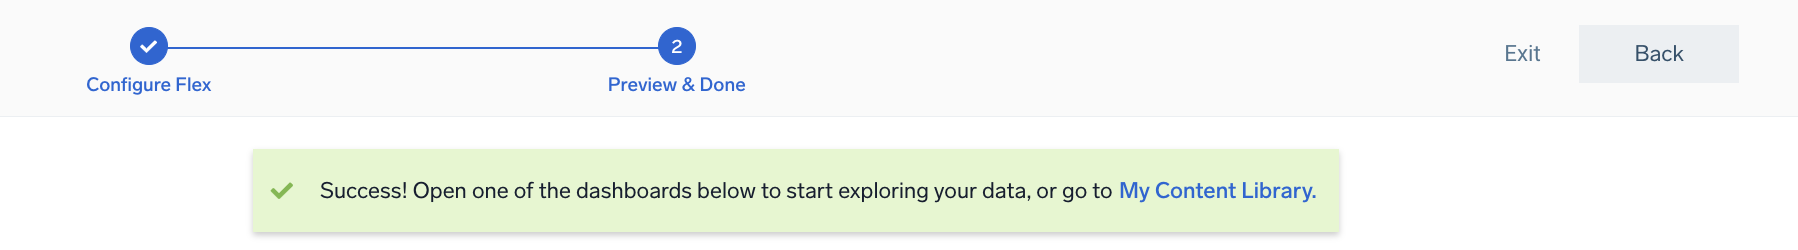
Once an app is installed, it will appear in your Personal folder or the folder that you specified. From here, you can share it with other users in your organization. Dashboard panels will automatically start to fill with data matching the time range query received since you created the panel. Results won't be available immediately, but within about 20 minutes, you'll see completed graphs and maps.
Viewing Flex app dashboards
All dashboards have a set of filters that you can apply to the entire dashboard. Use these filters to drill down and examine the data to a granular level.
- You can change the time range for a dashboard or panel by selecting a predefined interval from a drop-down list, choosing a recently used time range, or specifying custom dates and times. Learn more.
- You can use template variables to drill down and examine the data on a granular level. For more information, see Filtering Dashboards with Template Variables.
- Most Next-Gen apps allow you to provide the scope at the installation time and are comprised of a key (
_sourceCategoryby default) and a default value for this key. Based on your input, the app dashboards will be parameterized with a dashboard variable, allowing you to change the dataset queried by all panels. This eliminates the need to create multiple copies of the same dashboard with different queries.
Overview
The Flex - Overview dashboard displays the amount of data that you are ingesting and scanning in logs. It also helps you understand how much data you are ingesting in Metrics and Tracing.
Capacity Utilization
The Flex - Capacity Utilization dashboard displays the subscribed, actual, and percentage capacity utilization for logs and metrics.
Credits Consumed
The Flex - Credits Consumed dashboard provides visibility into the total amount of Sumo Logic Credits consumed by your organization. This allows you to monitor and control search costs.
Feature Level Scan Volume
The Flex - Feature Level Scan Volume dashboard provides visibility into the scan volume at a feature level in order to monitor and control cost at a feature level.
Log Spikes
The Flex - Log Spikes dashboard helps to review details of your data ingested for logs.
Logs
The Flex - Logs dashboard helps you see your log ingest volume between default and non-default indexes along with the predicted growth. This dashboard also provides details about the data volume scan and predicted growth for scan volume.
Metrics
The Flex - Metrics dashboard helps you review metrics details of your data ingestion and identify areas of high-volume ingest.
Tracing
The Flex - Tracing dashboard helps to review Tracing details of your data ingest and to identify areas of high-volume ingest.
Upgrading the Flex app (Optional)
To update the app, do the following:
- Select App Catalog.
- In the Search Apps field, search for and then select your app.
Optionally, you can identify apps that can be upgraded in the Upgrade available section. - To upgrade the app, click Upgrade.
- If the upgrade does not have any configuration or property changes, you will be redirected to the Preview & Done section.
- If the upgrade has any configuration or property changes, you will be redirected to Setup Data page.
- In the Configure section of your respective app, complete the following fields.
- Key. Select either of these options for the data source.
- Choose Source Category and select a source category from the list for Default Value.
- Choose Custom and enter a custom metadata field. Insert its value in Default Value.
- Key. Select either of these options for the data source.
- Click Next. You will be redirected to the Preview & Done section.
- In the Configure section of your respective app, complete the following fields.
Post-update
Your upgraded app will be installed in the Installed Apps folder, and dashboard panels will start to fill automatically.
See our Release Notes changelog for new updates in the app.
Uninstalling the Flex app (Optional)
To uninstall the app, do the following:
- Select App Catalog.
- In the 🔎 Search Apps field, run a search for your desired app, then select it.
- Click Uninstall.