Strimzi Kafka - Classic Collector

This guide provides an overview of Kafka metrics collection from kafka pods deployed with the Strimzi Kafka operator.
The Sumo Logic App for Strimzi Kafka is a unified logs and metrics app. The app helps you to monitor the availability, performance, and resource utilization of Kafka messaging/streaming clusters. Pre-configured dashboards provide insights into the cluster status, throughput, broker operations, topics, replication, zookeepers, node resource utilization, and error logs.
This App has been tested with following Kafka Operator versions:
- 0.35.0
This App has been tested with following Kafka versions:
- 3.4.0
Sample log messages
{
  "timestamp":1617392000686,
  "log":"[2021-04-02 19:33:20,598] INFO [KafkaServer id=0] started (kafka.server.KafkaServer)",
  "stream":"stdout",
  "time":"2021-04-02T19:33:20.599066311Z"
}
Sample queries
This sample query string is from the Logs panel of the Kafka - Logs dashboard.
messaging_cluster=* messaging_system="kafka" \
| json auto maxdepth 1 nodrop | if (isEmpty(log), _raw, log) as kafka_log_message \
| parse field=kafka_log_message "[*] * *" as date_time,severity,msg | where severity in ("ERROR", "FATAL") \
| count by date_time, severity, msg | sort by date_time | limit 10
Metrics
The list of metrics collected can be found here.
Collecting logs and metrics for Strimzi Kafka Pods
Collection architecture is similar to Kafka and described here.
This section provides instructions for configuring log and metric collection for the Sumo Logic App for Strimzi Kafka.
Prerequisites for Kafka Cluster Deployment
Before configuring the collection you will require below items
-
Access to the existing kubernetes cluster where strimzi cluster operator is deployed. If not done you can follow the strimzi documentation.
-
Namespace where all the kafka pods will be created or are already deployed.
-
Download the kafka-metrics-sumologic-telegraf.yaml. If you already have an existing yaml, you will have to merge the contents of both the files. This file contains the Kafka resource.
Deploying Sumo Logic Kubernetes Collection
- Create a new namespace to deploy resources. The below command creates a sumologiccollection namespace.
kubectl create ns sumologiccollection
-
Download sumologic_values_eks.yaml file. This file contains the remote write configuration for metrics which the app uses. You can add or remove metrics depending upon your use case.
-
Generate the Sumo Logic access ids and access keys in the Sumo Logic portal.
-
Install the Sumo Logic Kubernetes Collection using sumologic_values_eks.yaml file (in folder) by following the instructions here. Ensure that you are monitoring your Kubernetes clusters with the Telegraf operator enabled. If you are not, then follow these instructions to do so. The below command enables traces and telegraf operators using the credentials generated in the previous step and deploys the 2.10.0 helm chart version.
helm upgrade --install sumologic sumologic/sumologic \
  --namespace sumologiccollection \
 --set sumologic.accessId=<access id> \
 --set sumologic.accessKey=<access key> \
 --set sumologic.clusterName="<Your Cluster Name>" \
 --set sumologic.traces.enabled=true \
 –-set telegraf-operator.enabled=true \
 --version 2.10.0 -f sumologic_values_eks.yaml
A collector will be created in your Sumo Logic org with cluster name, provided in above command. You can verify it by going to the collection page.
Configure Metrics Collection
Follow these steps to collect metrics from a Kubernetes environment:
- Preparing custom image for running Kafka with Jolokia agent
Strimzi operator does not support jolokia agent out of the box so we need to update the kafka image. To Build kafka pod image follow below instructions:
-
Download the Dockerfile.
-
The above file uses container images available in the publicly available Strimzi Container Registry. Change the base image
quay.io/strimzi/kafka:latest-kafka-3.4.0to the respective kafka version's image you want to use. -
Download the latest version of the Jolokia JVM-Agent from Jolokia, rename the file to
jolokia.jarand place it in the same folder as dockerfile. -
Build the docker images using below commands.
docker build --platform <platform> -t "${MAIN_DOCKER_TAG}:${KAFKA_APP_TAG}" .
docker tag "${MAIN_DOCKER_TAG}:${KAFKA_APP_TAG}" ${REGISTRY}/${REPOSITORY}:${KAFKA_APP_TAG}`
Example:
docker build --platform linux/amd64 -t "kafka:kafka-3.4.0" .
docker tag "kafka:kafka-3.4.0" public.ecr.aws/g0d6f4n6/strimzi-kafka-jolokia:kafka-3.4.0 -
Push the images in your container repository. Strimzi supports both private container registries as well as public registries.You can either configure image pull secrets at the Cluster operator level or in the PodTemplate section.
-
Update the
<<IMAGE_TAG>>in kafka-metrics-sumologic-telegraf.yaml file downloaded earlier. -
Add annotations on your Kafka pods
-
Open kafka-metrics-sumologic-telegraf.yaml in any editor and go to spec -> kafka -> template -> pod -> metadata -> annotations section.
-
In the tags sections(
[inputs.jolokia2_agent.tags]and[inputs.disk.tags]), enter in values for the parameters marked with<<CLUSTER_NAME>>,<<ENVIRONMENT>>in the yaml file:environment. Replace<<ENVIRONMENT>>with the deployment environment where the Kafka cluster identified by the value of servers resides. For example: dev, prod or qa. While this value is optional we highly recommend setting it.messaging_cluster. Replace<<CLUSTER_NAME>>with a name to identify this Kafka cluster. This cluster name will be shown in the Sumo Logic dashboards.
Do not modify the following values as it will cause the Sumo Logic app to not function correctly.
telegraf.influxdata.com/class: sumologic-prometheus. This instructs the Telegraf operator what output to use. This should not be changed.prometheus.io/scrape: "true". This ensures our Prometheus plugin will scrape the metrics.prometheus.io/port: "9273". This tells Prometheus what ports to scrape metrics from. This should not be changed.- In the tags sections(
[inputs.jolokia2_agent.tags]and[inputs.disk.tags])component: “messaging”- This value is used by Sumo Logic apps to identify application components.messaging_system: “kafka”- This value identifies the database system.
- In the input plugins(
telegraf.influxdata.com/inputs) section:urls- The URL to the Kafka server. As telegraf will be run as a sidecar theurlsshould always be localhost. This can be a comma-separated list to connect to multiple Kafka servers.
For more information on all other parameters, see this doc for more parameters that can be configured in the Telegraf agent globally.
For more information on configuring the Joloka input plugin for Telegraf, see this doc.
-
Configure Logs Collection
If your Kafka helm chart/pod is writing the logs to standard output then the Sumologic Kubernetes Collection will automatically capture the logs from stdout and will send the logs to Sumologic.If not then you have to use tailing-sidecar approach.
-
Add labels on your Kafka pods
- Open kafka-metrics-sumologic-telegraf.yaml in any editor and go to spec -> kafka -> template -> pod -> metadata -> labels section.
- Enter in values for the parameters marked with
<<CLUSTER_NAME>>,<<ENVIRONMENT>>in the yaml file:-
environment. Replace<<ENVIRONMENT>>with the deployment environment where the Kafka cluster identified by the value of servers resides. For example: dev, prod or qa. While this value is optional we highly recommend setting it. -
messaging_cluster. Replace<<CLUSTER_NAME>>with a name to identify this Kafka cluster. This cluster name will be shown in the Sumo Logic dashboards. -
Do not modify the following values as it will cause the Sumo Logic app to not function correctly.
component: “messaging”- This value is used by Sumo Logic apps to identify application components.messaging_system: “kafka”- This value identifies the messaging system.
-
-
Collect Kafka logs written to log files (Optional). If your Kafka helm chart/pod is writing its logs to log files, you can use a sidecar to send log files to standard out. To do this:
- Determine the location of the Kafka log file on Kubernetes. This can be determined from helm chart configurations.
- Install the Sumo Logic tailing sidecar operator.
- Add the following annotation in addition to the existing annotations in kafka-metrics-sumologic-telegraf.yaml file.
annotations:
  tailing-sidecar: sidecarconfig;<mount>:<path_of_kafka_log_file>/<kafka_log_file_name>`
Example:
annotations:
tailing-sidecar: sidecarconfig;data:/opt/Kafka/kafka_<VERSION>/logs/server.log -
Configure Fields in Sumo Logic
Create the following Fields in Sumo Logic prior to configuring collection. This ensures that your logs and metrics are tagged with relevant metadata, which is required by the app dashboards. For information on setting up fields, see Sumo Logic Fields.
pod_labels_componentpod_labels_environmentpod_labels_messaging_systempod_labels_messaging_cluster
-
Adding FER for normalizing fields
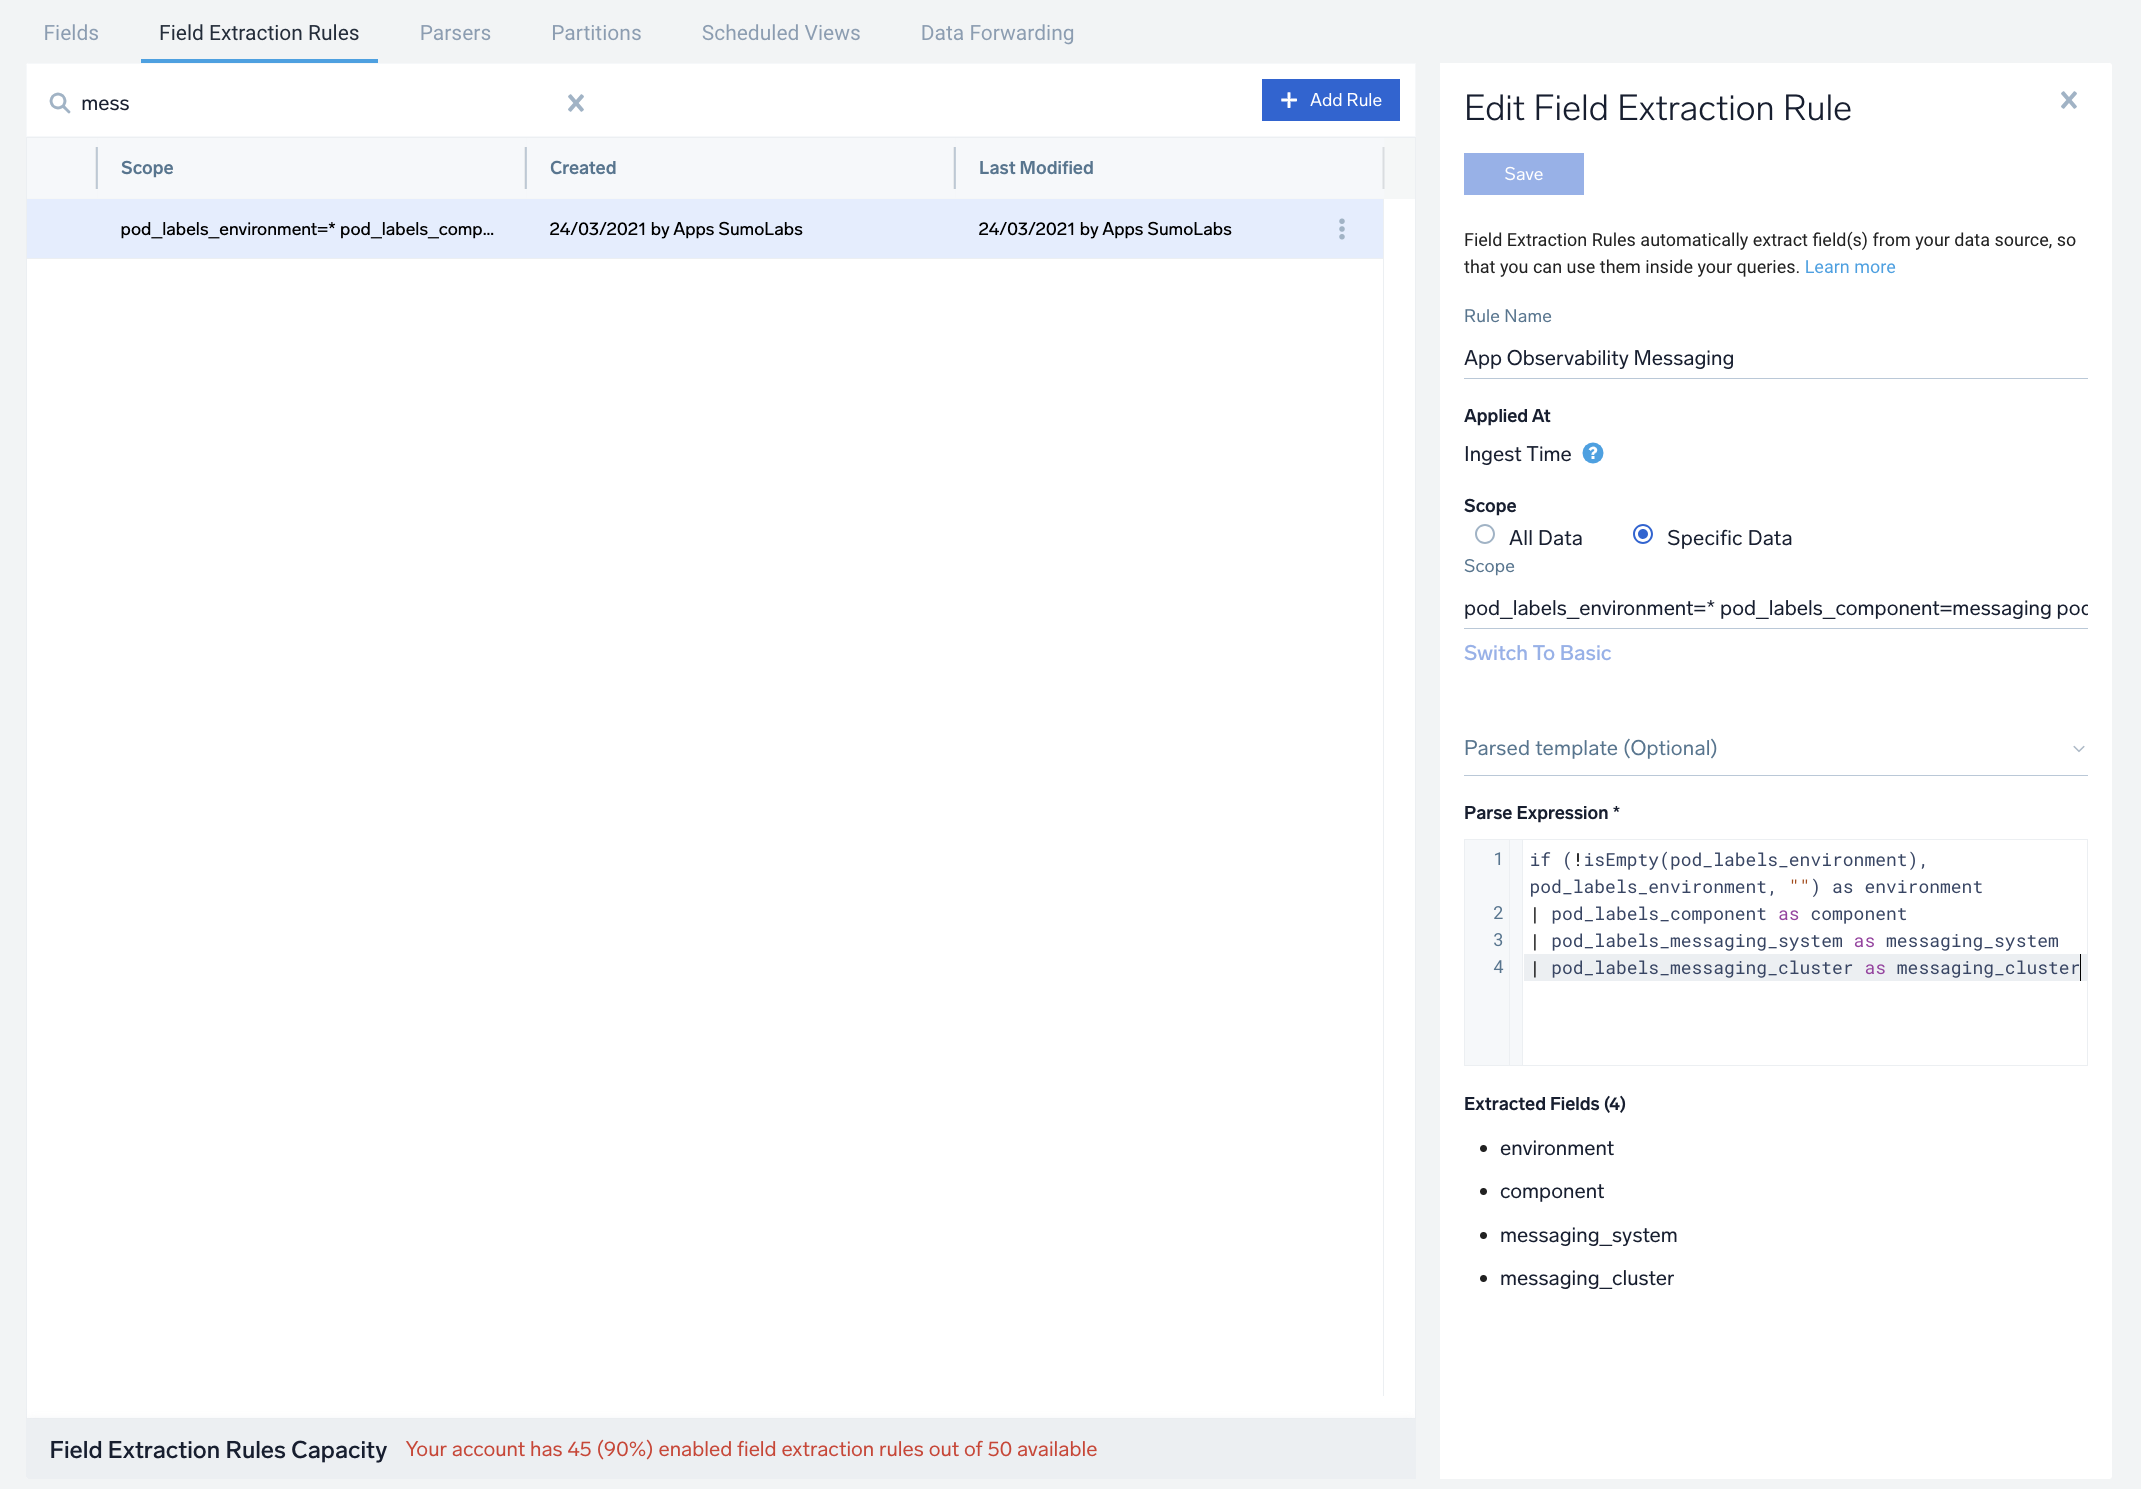
Labels created in Kubernetes environments automatically are prefixed with pod_labels. To normalize these for our app to work, we need to create a Field Extraction Rule if not already created for Messaging Application Components. To do so:
- In the main Sumo Logic menu, select Manage Data > Logs > Field Extraction Rules.
- Click the + Add button on the top right of the table.
- The Add Field Extraction Rule form will appear. Enter the following options:
- Rule Name. Enter the name as App Component Observability - Messaging.
- Applied At. Choose Ingest Time
- Scope. Select Specific Data
- Scope: Enter the following keyword search expression:
pod_labels_environment=* pod_labels_component=messaging
pod_labels_messaging_system=kafka pod_labels_messaging_cluster=* - Parse Expression. Enter the following parse expression:
if (!isEmpty(pod_labels_environment), pod_labels_environment, "") as environment
| pod_labels_component as component
| pod_labels_messaging_system as messaging_system
| pod_labels_messaging_cluster as messaging_cluster
- Click Save to create the rule.

Deploying Kafka Pods
After updating kafka-metrics-sumologic-telegraf.yaml, you can use the below command to deploy the Kafka pods
kubectl apply -f kafka-metrics-sumologic-telegraf.yaml -n <<NAMESPACE>>
Deployment Verification
-
Make sure that the Kafka pods are running and correct annotations / labels are applied by using the command:
kubectl describe pod <Kafka_pod_name> -
Verifying Metrics in Kafka pods
- You can ssh to Kafka pod and run following commands to make sure Telegraf (and Jolokia) is scraping metrics from your Kafka Pod:
curl localhost:9273/metrics
curl http://localhost:8778/jolokia/list
- The Sumo Logic Kubernetes collection will automatically start collecting logs and metrics from the pods having the annotations and labels defined in the previous steps. Verify logs and metrics are flowing into Sumo Logic by running the following query in Log Search and Metrics Explorer:
component="messaging" and messaging_system="kafka"
Troubleshooting
-
If you are still not seeing metrics or logs follow the troubleshooting guide.
-
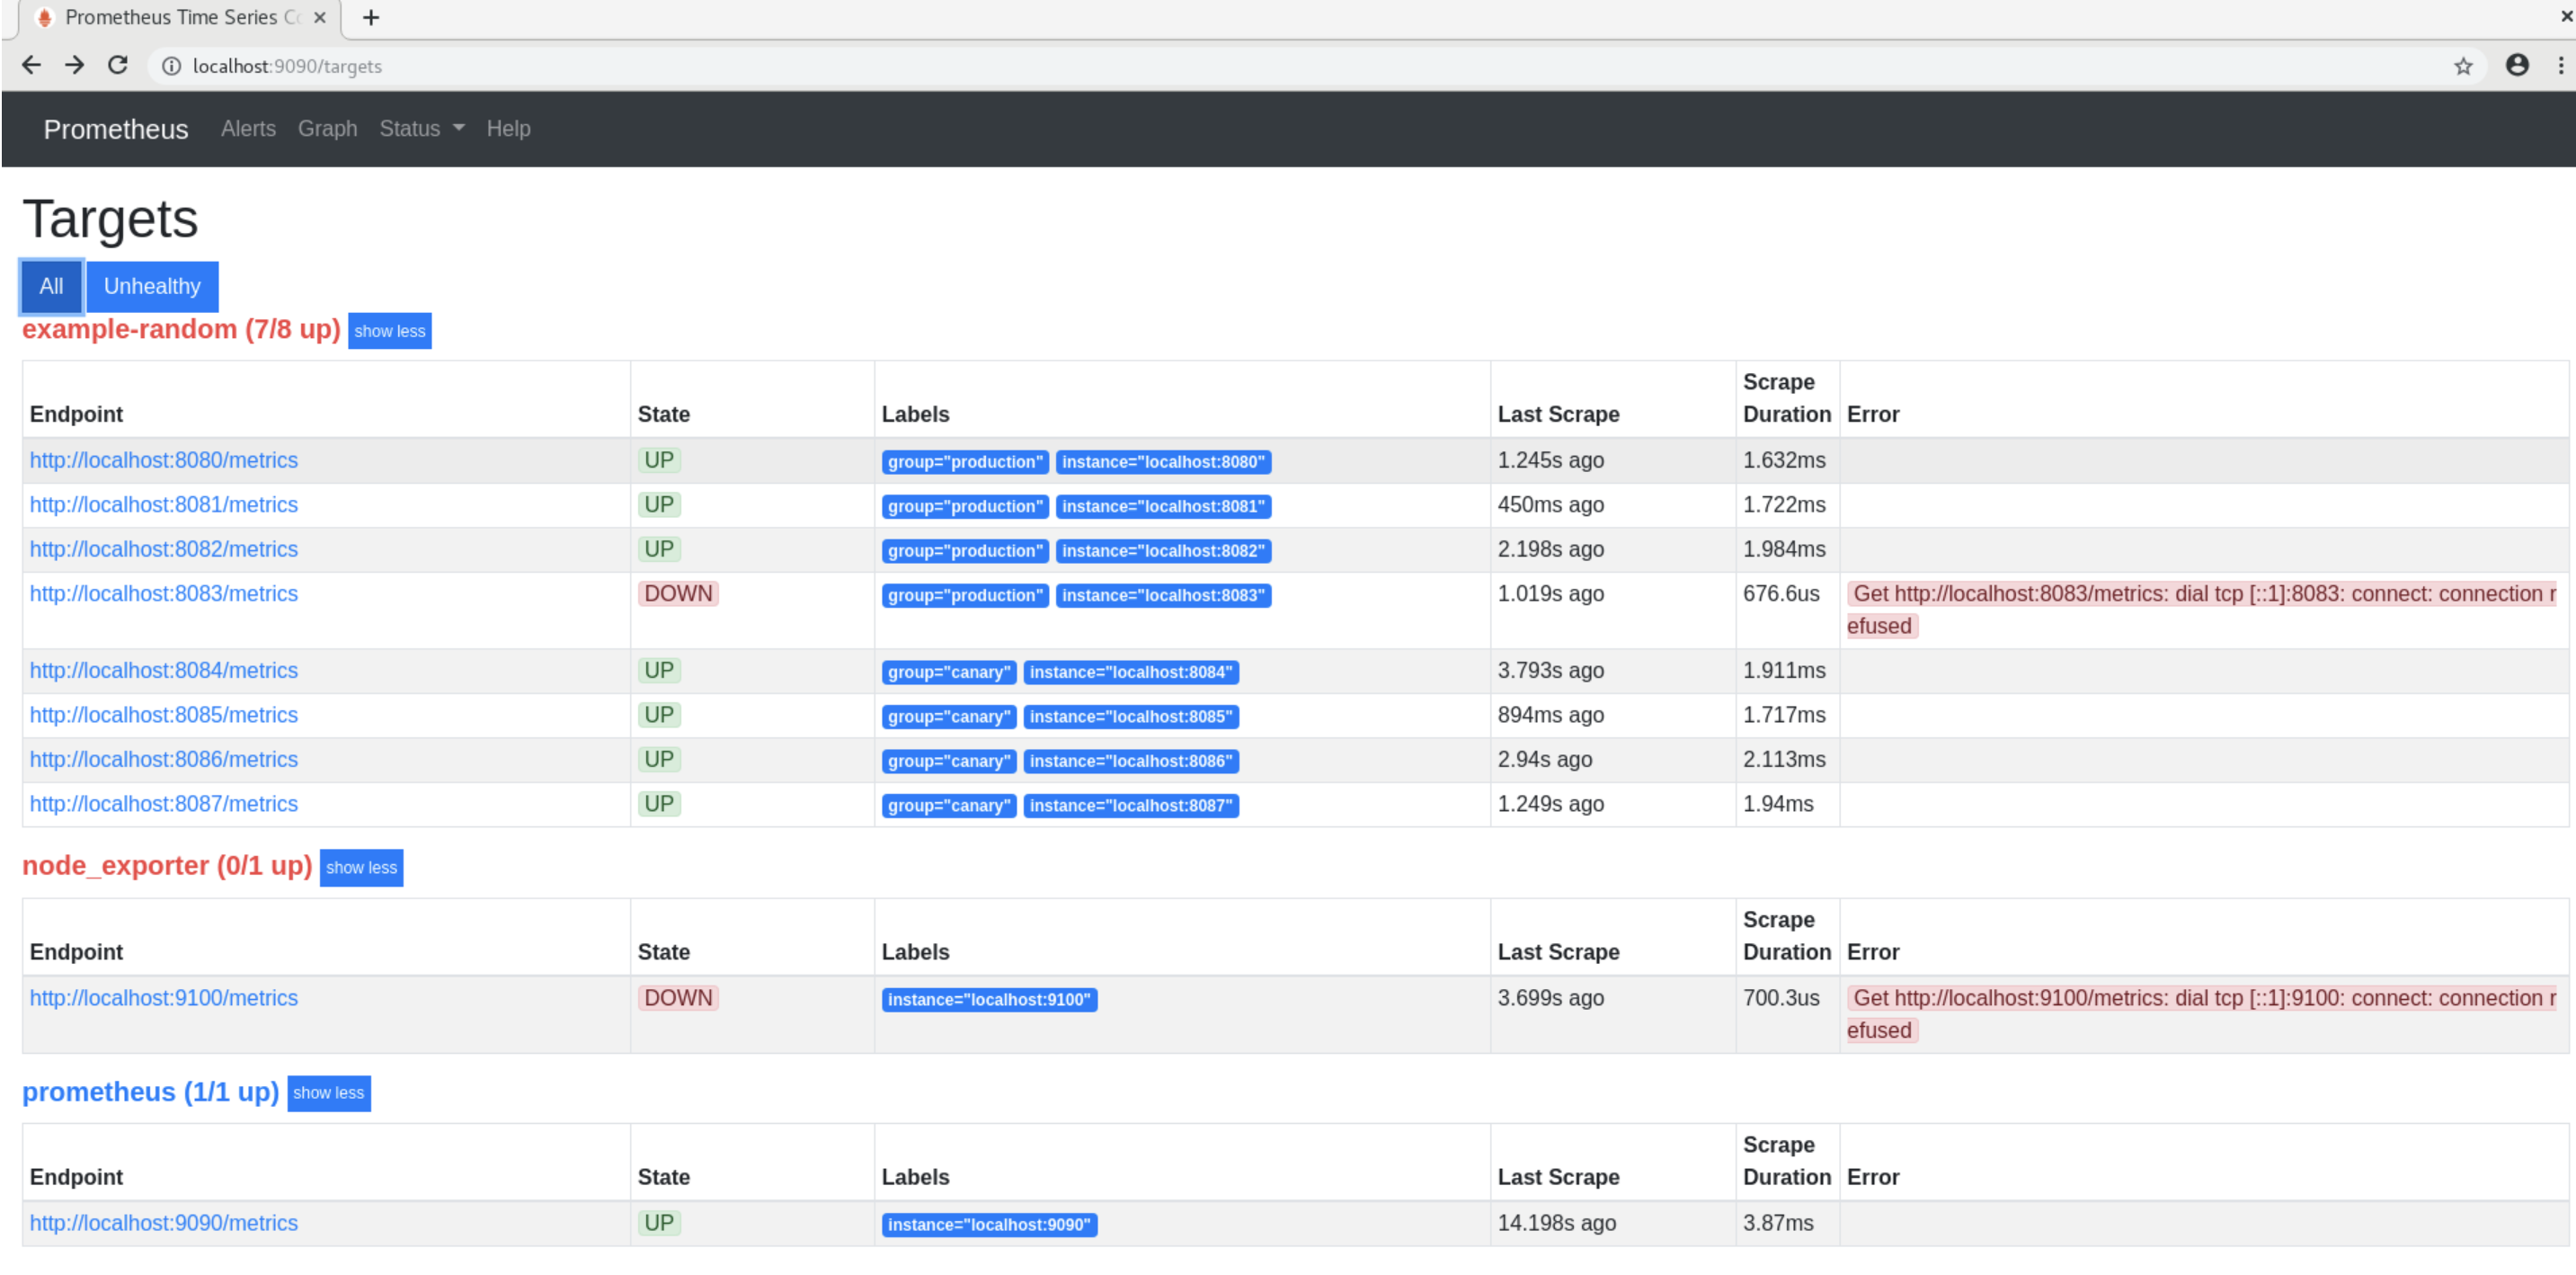
If you are seeing unhealthy targets in prometheus console, sometimes custom network policies may be responsible for affecting connectivity across prometheus pods and kafka pods.

Follow the below steps below to allow traffic from sumologiccollection namespace:
- First we need to label the sumologiccollection namespace
kubectl label namespace sumologiccollection namespace=sumologiccollection
You can validate above by below command
kubectl get namespaces sumologiccollection --show-labels
- Then add below snippet in your existing network policy to allow all traffic from sumologiccollection namespace. We can restrict it from specific ports as well but let's first start by allowing all ports.Since podSelector works for only pods in the same namespace as network policy we are using namespaceSelector property.
  - from:
      - namespaceSelector:
          matchExpressions:
          - key: namespace
            operator: In
            values: ["sumologiccollection"]
Installing Kafka Alerts
Follow the instructions to install the monitors. The list of alert can be found here.
Installing the Kafka App
This section demonstrates how to install the Strimzi Kafka App.
Locate and install the app you need from the App Catalog. If you want to see a preview of the dashboards included with the app before installing, click Preview Dashboards.
- From the App Catalog, search for and select the app.
- Select the version of the service you're using and click Add to Library.
note
Version selection is not available for all apps.
- To install the app, complete the following fields.
- App Name. You can retain the existing name, or enter a name of your choice for the app.
- Data Source. Choose Enter a Custom Data Filter, and enter a custom Kafka cluster filter. Examples:
- For all Kafka clusters
messaging_cluster=* - For a specific cluster:
messaging_cluster=Kafka.dev.01. This should be the same as<<Cluster Name>>value provided while defining annotations and labels. - Clusters within a specific environment:
messaging_cluster=Kafka-1 and environment=prod. This assumes you have set the optional environment tag while configuring collection. This should be same as<<Cluster Name>>and<<ENVIRONMENT>>values provided while defining annotations and labels.
- For all Kafka clusters
- Advanced. Select the Location in Library (the default is the Personal folder in the library), or click New Folder to add a new folder.
- Click Add to Library.
When an app is installed, it will appear in your Personal folder, or another folder that you specified. From here, you can share it with your organization.
Panels will start to fill automatically. It's important to note that each panel slowly fills with data matching the time range query and received since the panel was created. Results won't immediately be available, but with a bit of time, you'll see full graphs and maps.
Viewing the Kafka Dashboards
The dashboards are identical to Kafka and their use cases can be found here.