Couchbase - OpenTelemetry Collector
Couchbase, a modern database for enterprise applications, is a distributed document database with a powerful search engine and in-built operational and analytical capabilities. It brings the power of NoSQL to the edge and provides fast, efficient bidirectional synchronization of data between the edge and the cloud.
The Sumo Logic app for Couchbase helps you monitor activity in Couchbase. The pre-configured dashboards provide insight into the Error, events and HTTP Access pattern that help you understand your clusters.
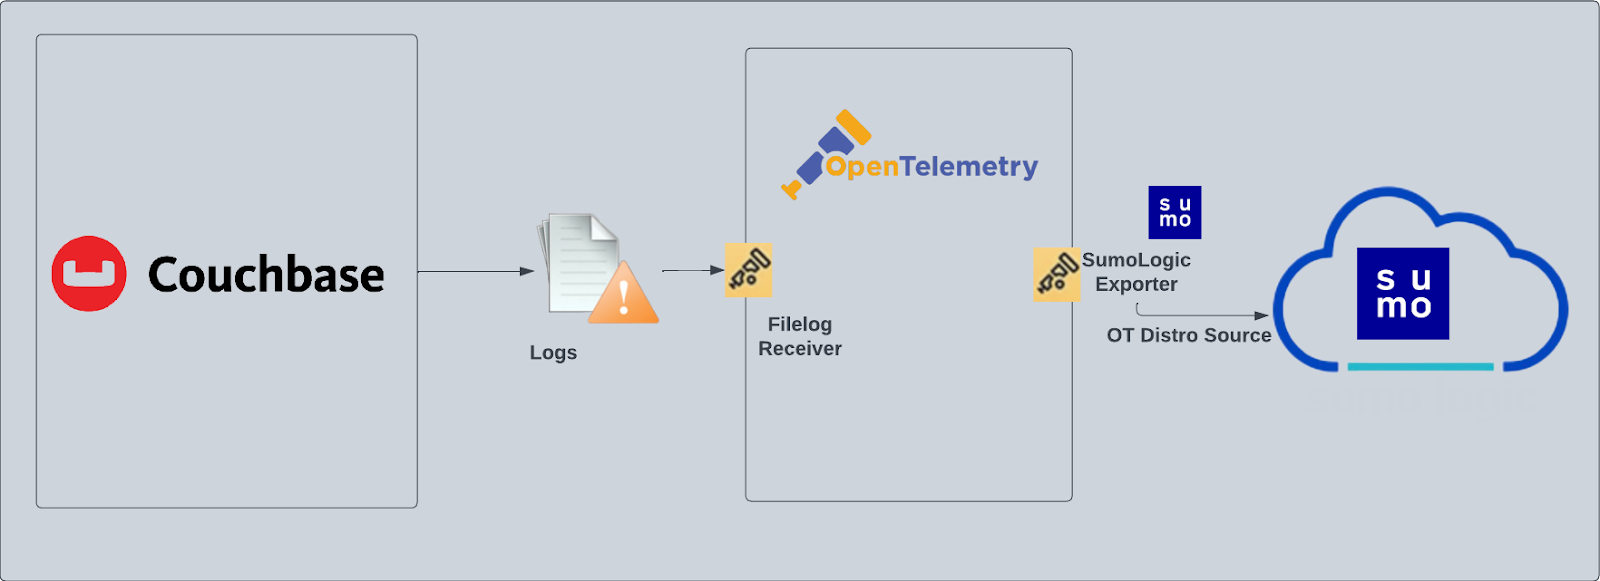
Couchbase logs are sent to Sumo Logic through OpenTelemetry filelog receiver.
This App has been tested with Couchbase version 7.0.2.
Fields creation in Sumo Logic for Couchbase
Following are the Fields which will be created as part of Couchbase App install if not already present:
db.cluster.name. User configured. Enter a name to identify this Couchbase cluster. This cluster name will be shown in the Sumo Logic dashboards.db.system. Has a fixed value ofcouchbase.deployment.environment. User configured. Through this Couchbase cluster is identified by the environment where it resides. For example: dev, prod or qa.sumo.datasource. Has a fixed value ofcouchbase.
Prerequisite
By default, the Couchbase will write the log to the log directory that was configured during installation. For example, on Linux, the log directory would be /opt/couchbase/var/lib/couchbase/logs. By default, the Audit log is disabled, you must enable the audit log following these instructions. Query log, error log, the access log will be enabled by default.
For Linux systems with ACL Support, the otelcol install process should have created the ACL grants necessary for the otelcol system user to access default log locations. You can verify the active ACL grants using the getfacl command. Install the ACL in your Linux environment, if not installed.
The required ACL may not be supported for some rare cases, for example, Linux OS Distro, which is officially not supported by Sumo Logic. In this case, you can run the following command to explicitly grant the permissions.
sudo setfacl -R -m d:u:otelcol-sumo:r-x,d:g:otelcol-sumo:r-x,u:otelcol-sumo:r-x,g:otelcol-sumo:r-x <PATH_TO_LOG_FILE>
Run the above command for all the log files in the directory that need to be ingested, which are not residing in the default location.
If Linux ACL Support is not available, traditional Unix-styled user and group permission must be modified. It should be sufficient to add the otelcol system user to the specific group that has access to the log files.
For Windows systems, log files which are collected should be accessible by the SYSTEM group. Use the following set of PowerShell commands if the SYSTEM group does not have access.
$NewAcl = Get-Acl -Path "<PATH_TO_LOG_FILE>"
# Set properties
$identity = "NT AUTHORITY\SYSTEM"
$fileSystemRights = "ReadAndExecute"
$type = "Allow"
# Create new rule
$fileSystemAccessRuleArgumentList = $identity, $fileSystemRights, $type
$fileSystemAccessRule = New-Object -TypeName System.Security.AccessControl.FileSystemAccessRule -ArgumentList $fileSystemAccessRuleArgumentList
# Apply new rule
$NewAcl.SetAccessRule($fileSystemAccessRule)
Set-Acl -Path "<PATH_TO_LOG_FILE>" -AclObject $NewAcl
Collection configuration and app installation
As part of data collection setup and app installation, you can select the App from App Catalog and click on Install App. Follow the steps below.
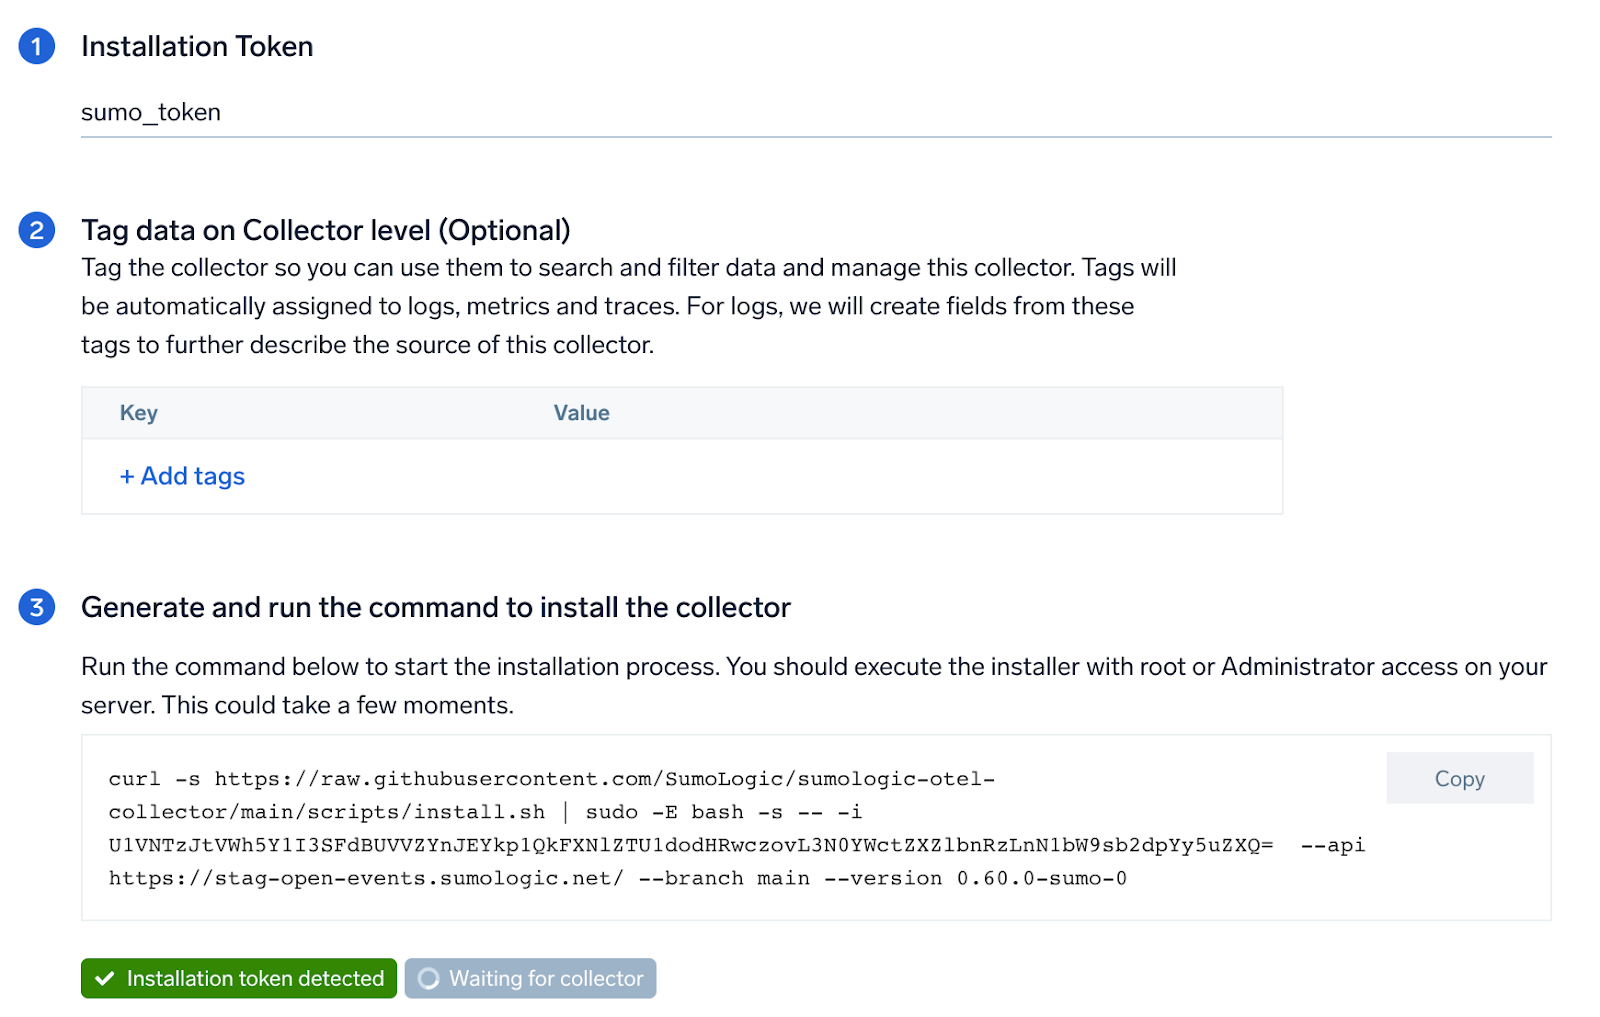
Step 1: Set up Collector
If you want to use an existing OTel Collector, this step can be skipped by selecting the option of using an existing Collector.
If you want to create a new Collector please select Add a new Collector option.
Select the platform for which you want to install the Sumo OpenTelemetry Collector.
This will generate a command which can be executed in the machine which needs to get monitored. Once executed it will install the Sumo Logic OpenTelemetry Collector agent.
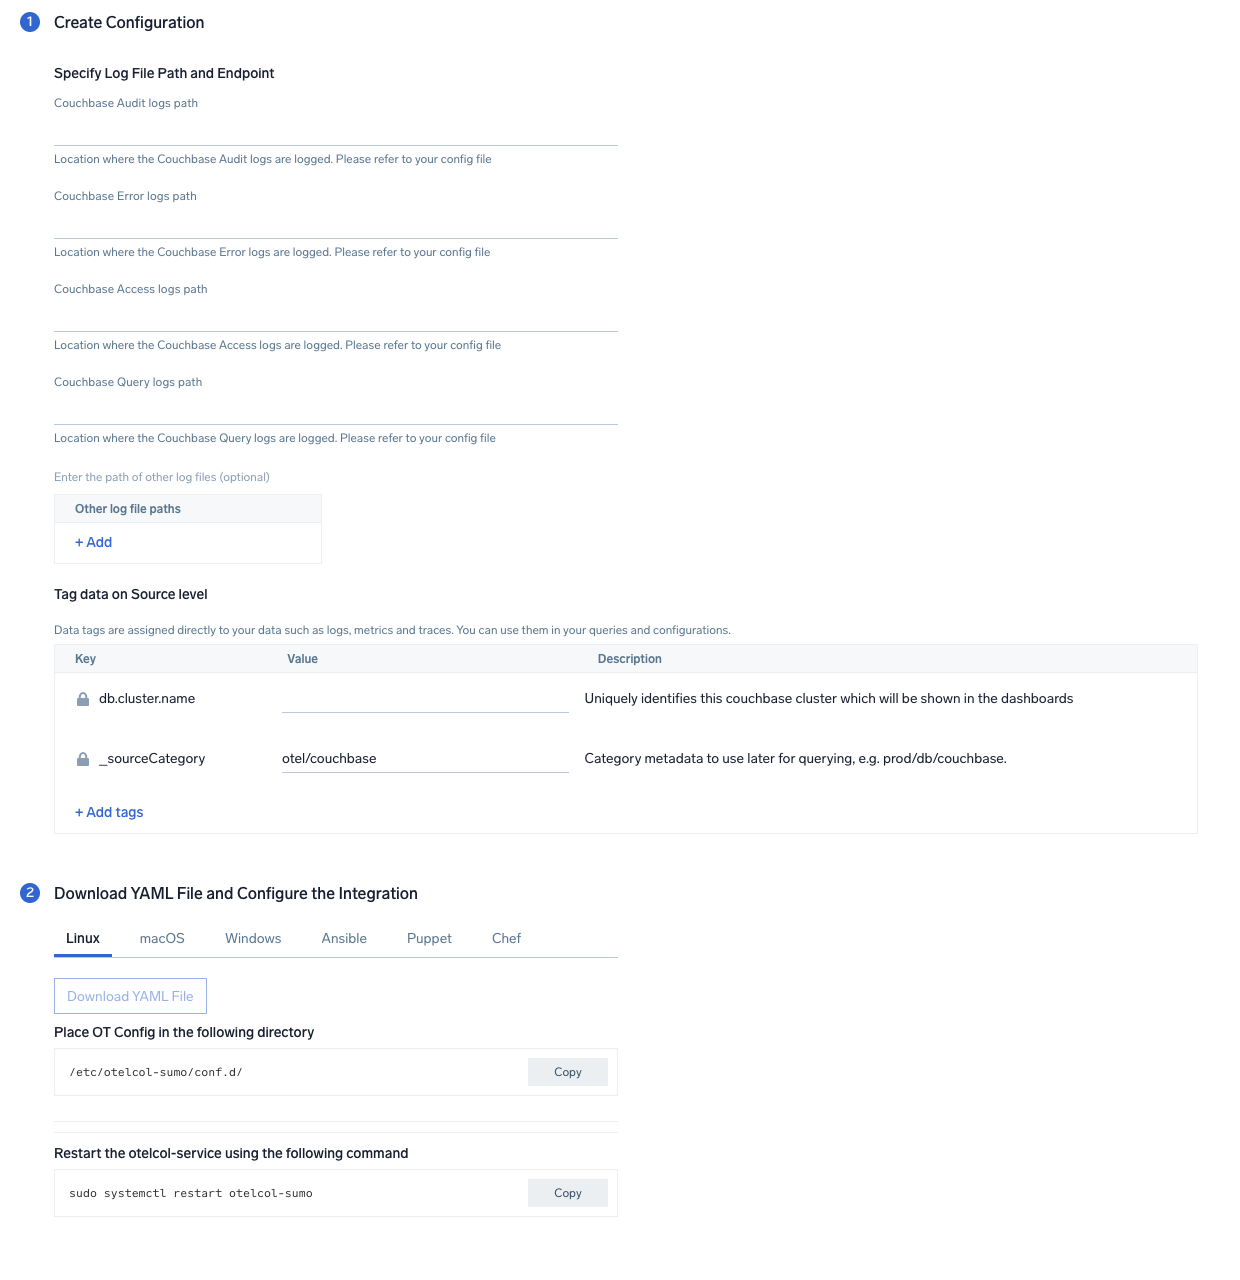
Step 2: Configure integration
In this step, you will configure the yaml file required for Couchbase Log Collection. Path of the log file configured to capture couchbase logs needs to be given here.
The files are typically located in folder /opt/couchbase/var/lib/couchbase/logs.
- For Audit Log:
/opt/couchbase/var/lib/couchbase/logs/audit.log - For Error Log:
/opt/couchbase/var/lib/couchbase/logs/error.log - For Access Log:
/opt/couchbase/var/lib/couchbase/logs/http_access.log - For Query Log:
/opt/couchbase/var/lib/couchbase/logs/query.log
You can add any custom fields which you want to tag along with the data ingested in Sumo. Click on the Download YAML File button to get the yaml file.
Step 3: Send logs to Sumo
Once you have downloaded the yaml file as described in the previous step, follow the below steps based on your platform.
- Linux
- Windows
- macOS
- Chef
- Ansible
- Puppet
- Copy the yaml file to
/etc/otelcol-sumo/conf.d/folder in the Couchbase instance which needs to be monitored. - restart the collector using:
sudo systemctl restart otelcol-sumo
- Copy the yaml file to
C:\ProgramData\Sumo Logic\OpenTelemetry Collector\config\conf.dfolder in the machine which needs to be monitored. - Restart the collector using:
Restart-Service -Name OtelcolSumo
- Copy the yaml file to
/etc/otelcol-sumo/conf.d/folder in the Couchbase instance which needs to be monitored. - Restart the otelcol-sumo process using:
otelcol-sumo --config /etc/otelcol-sumo/sumologic.yaml --config "glob:/etc/otelcol-sumo/conf.d/*.yaml"
- Copy the yaml file into your Chef cookbook files directory
files/<downloaded_yaml_file>. - Use a Chef file resource in a recipe to manage it.
cookbook_file '/etc/otelcol-sumo/conf.d/<downloaded_yaml_file>' do mode 0644 notifies :restart, 'service[otelcol-sumo]', :delayed end - Add the recipe to your collector setup to start collecting the data. Every team typically has their established way of applying the Chef recipe. The resulting Chef recipe should look something like:
cookbook_file '/etc/otelcol-sumo/conf.d/<downloaded_yaml_file>' do
mode 0644
notifies :restart, 'service[otelcol-sumo]', :delayed
end
- Place the file into your Ansible playbook files directory.
- Run the Ansible playbook.
ansible-playbook -i inventory install_sumologic_otel_collector.yaml
-e '{"installation_token": "<YOUR_TOKEN>", "collector_tags": {<YOUR_TAGS>}, "src_config_path": "files/conf.d"}'
- Place the file into your Puppet module files directory
modules/install_otel_collector/files/<downloaded_yaml>. - Use a Puppet file resource to manage it.
file { '/etc/otelcol-sumo/conf.d/<downloaded_yaml_file>':
    ensure => present,
    source => 'puppet:///modules/install_otel_collector/<downloaded_yaml_file>',
    mode => '0644',
    notify => Service[otelcol-sumo],
} - Apply the Puppet manifest. Every team typically has their established way of applying the Puppet manifest. The resulting Puppet manifest should look something like:
node 'default' {
    class { 'install_otel_collector'
      installation_token => '<YOUR_TOKEN>',
      collector_tags => { <YOUR_TAGS> },
    }

    service { 'otelcol-sumo':
      provider => 'systemd',
      ensure => running,
      enable => true,
      require => Class['install_otel_collector'],
    }

    file { '/etc/otelcol-sumo/conf.d/<downloaded_yaml_file>':
      ensure => present,
      source => 'puppet:///modules/install_otel_collector/<downloaded_yaml_file>',
      mode => '0644',
      notify => Service[otelcol-sumo],
    }
  }
After successfully executing the above command, Sumo Logic will start receiving data from your host machine.
Click Next. This will install the app (dashboards and monitors) to your Sumo Logic Org.
Dashboard panels will start to fill automatically. It's important to note that each panel fills with data matching the time range query and received since the panel was created. Results won't immediately be available, but within 20 minutes, you'll see full graphs and maps.
Sample log messages
_time=09/Jan/2023:04:50:03 +0000+07:00 _level=ERROR _msg=Failed to perform INSERT on key <ud>key1</ud> for Keyspace default:beer-sample.inventory.hotel. Error - <ud>Duplicate Key key1</ud>
Sample queries
Following query is from Average Latency of All HTTP Requests panel from Couchbase Overview dashboard:
 %"db.cluster.name"=* %"deployment.environment"=* %"sumo.datasource"="couchbase"
| json "log" as _rawlog nodrop
| if(isEmpty(_rawlog),_raw,_rawlog) as _raw
| parse regex "(?<src_ip>\d{1,3}\.\d{1,3}\.\d{1,3}\.\d{1,3})\s+\-\s+(?<username>\S+)\s+\[(?<time>.+)\]\s+\"(?:(?<method>\w+)\s+(?<path>\S+)\sHTTP\/1.1)\"\s+(?<code>\d+)\s(?<bytes>\d+)\s(?<origin_url>\S+) \"(?<agent>.+)\"\s(?<latency>\d+)"
| avg(latency)
Viewing Couchbase Dashboards
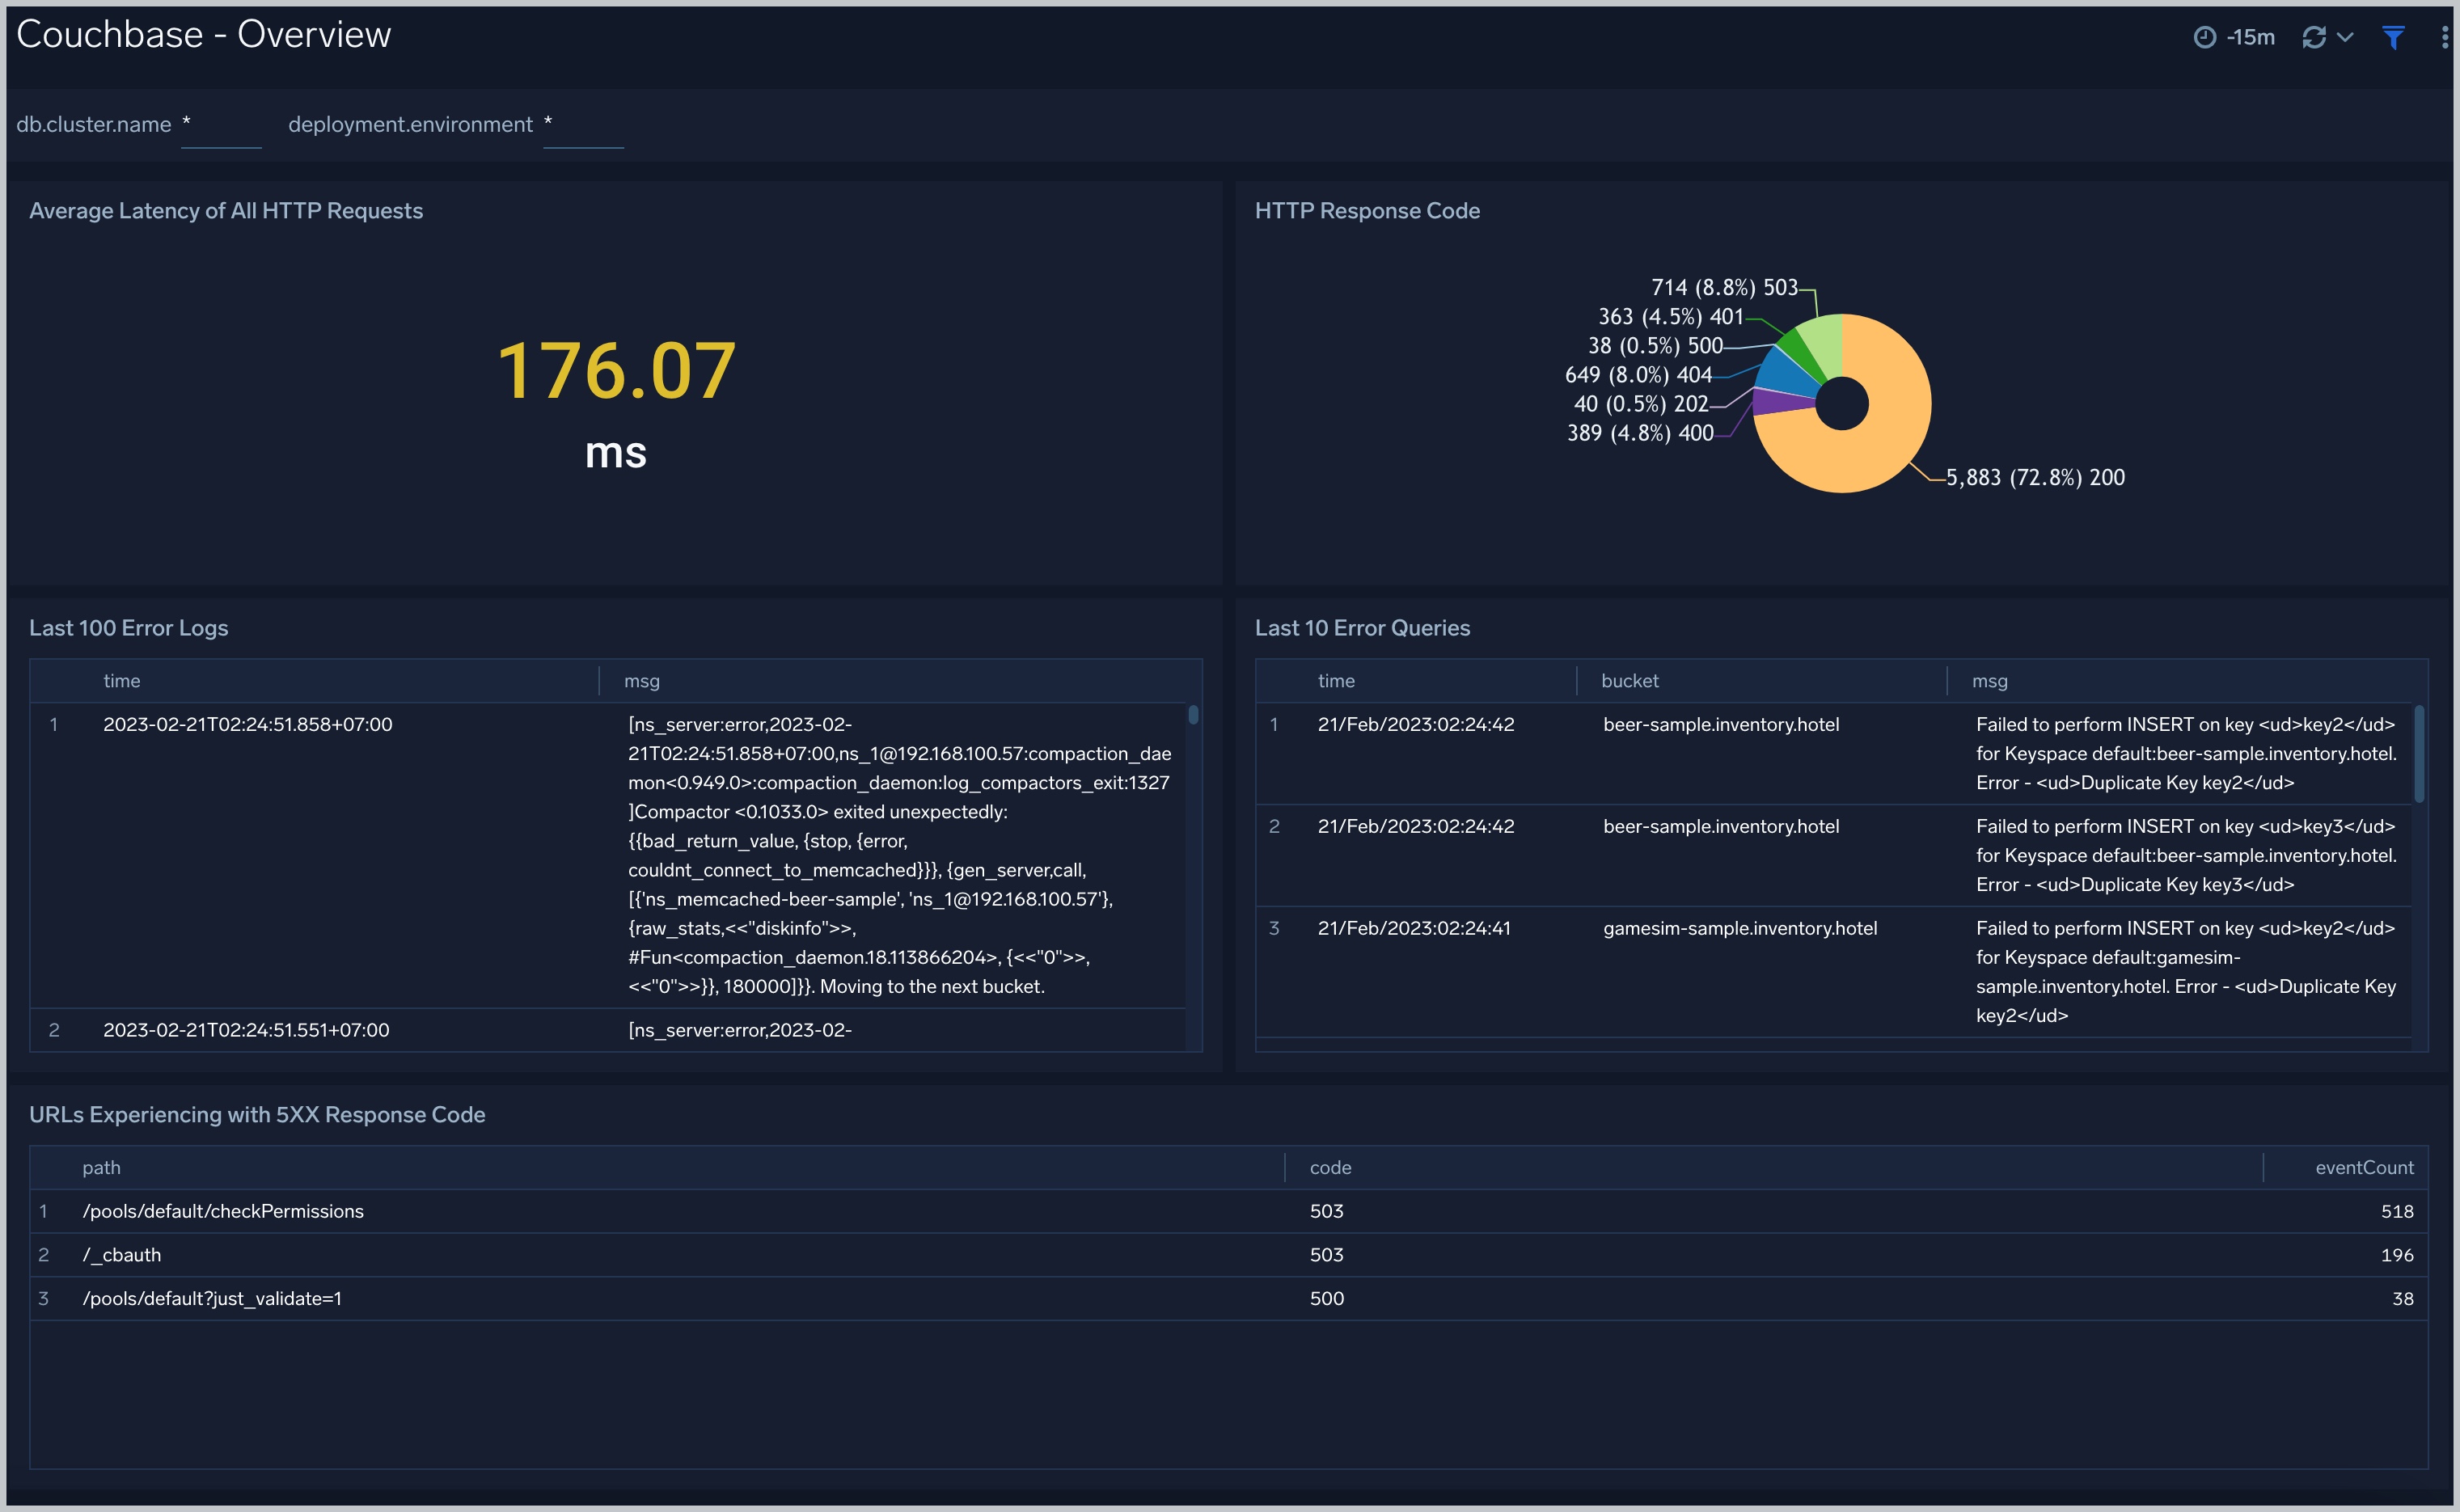
Overview
The Couchbase - Overview dashboard provides an at-a-glance view of the health of the Couchbase clusters and servers, performance, and problems causing errors.
Use this dashboard to:
- Gain insights into information about Average Latency and Response code distribution.
- Determine errors in clusters: get the list of top error logs and error queries
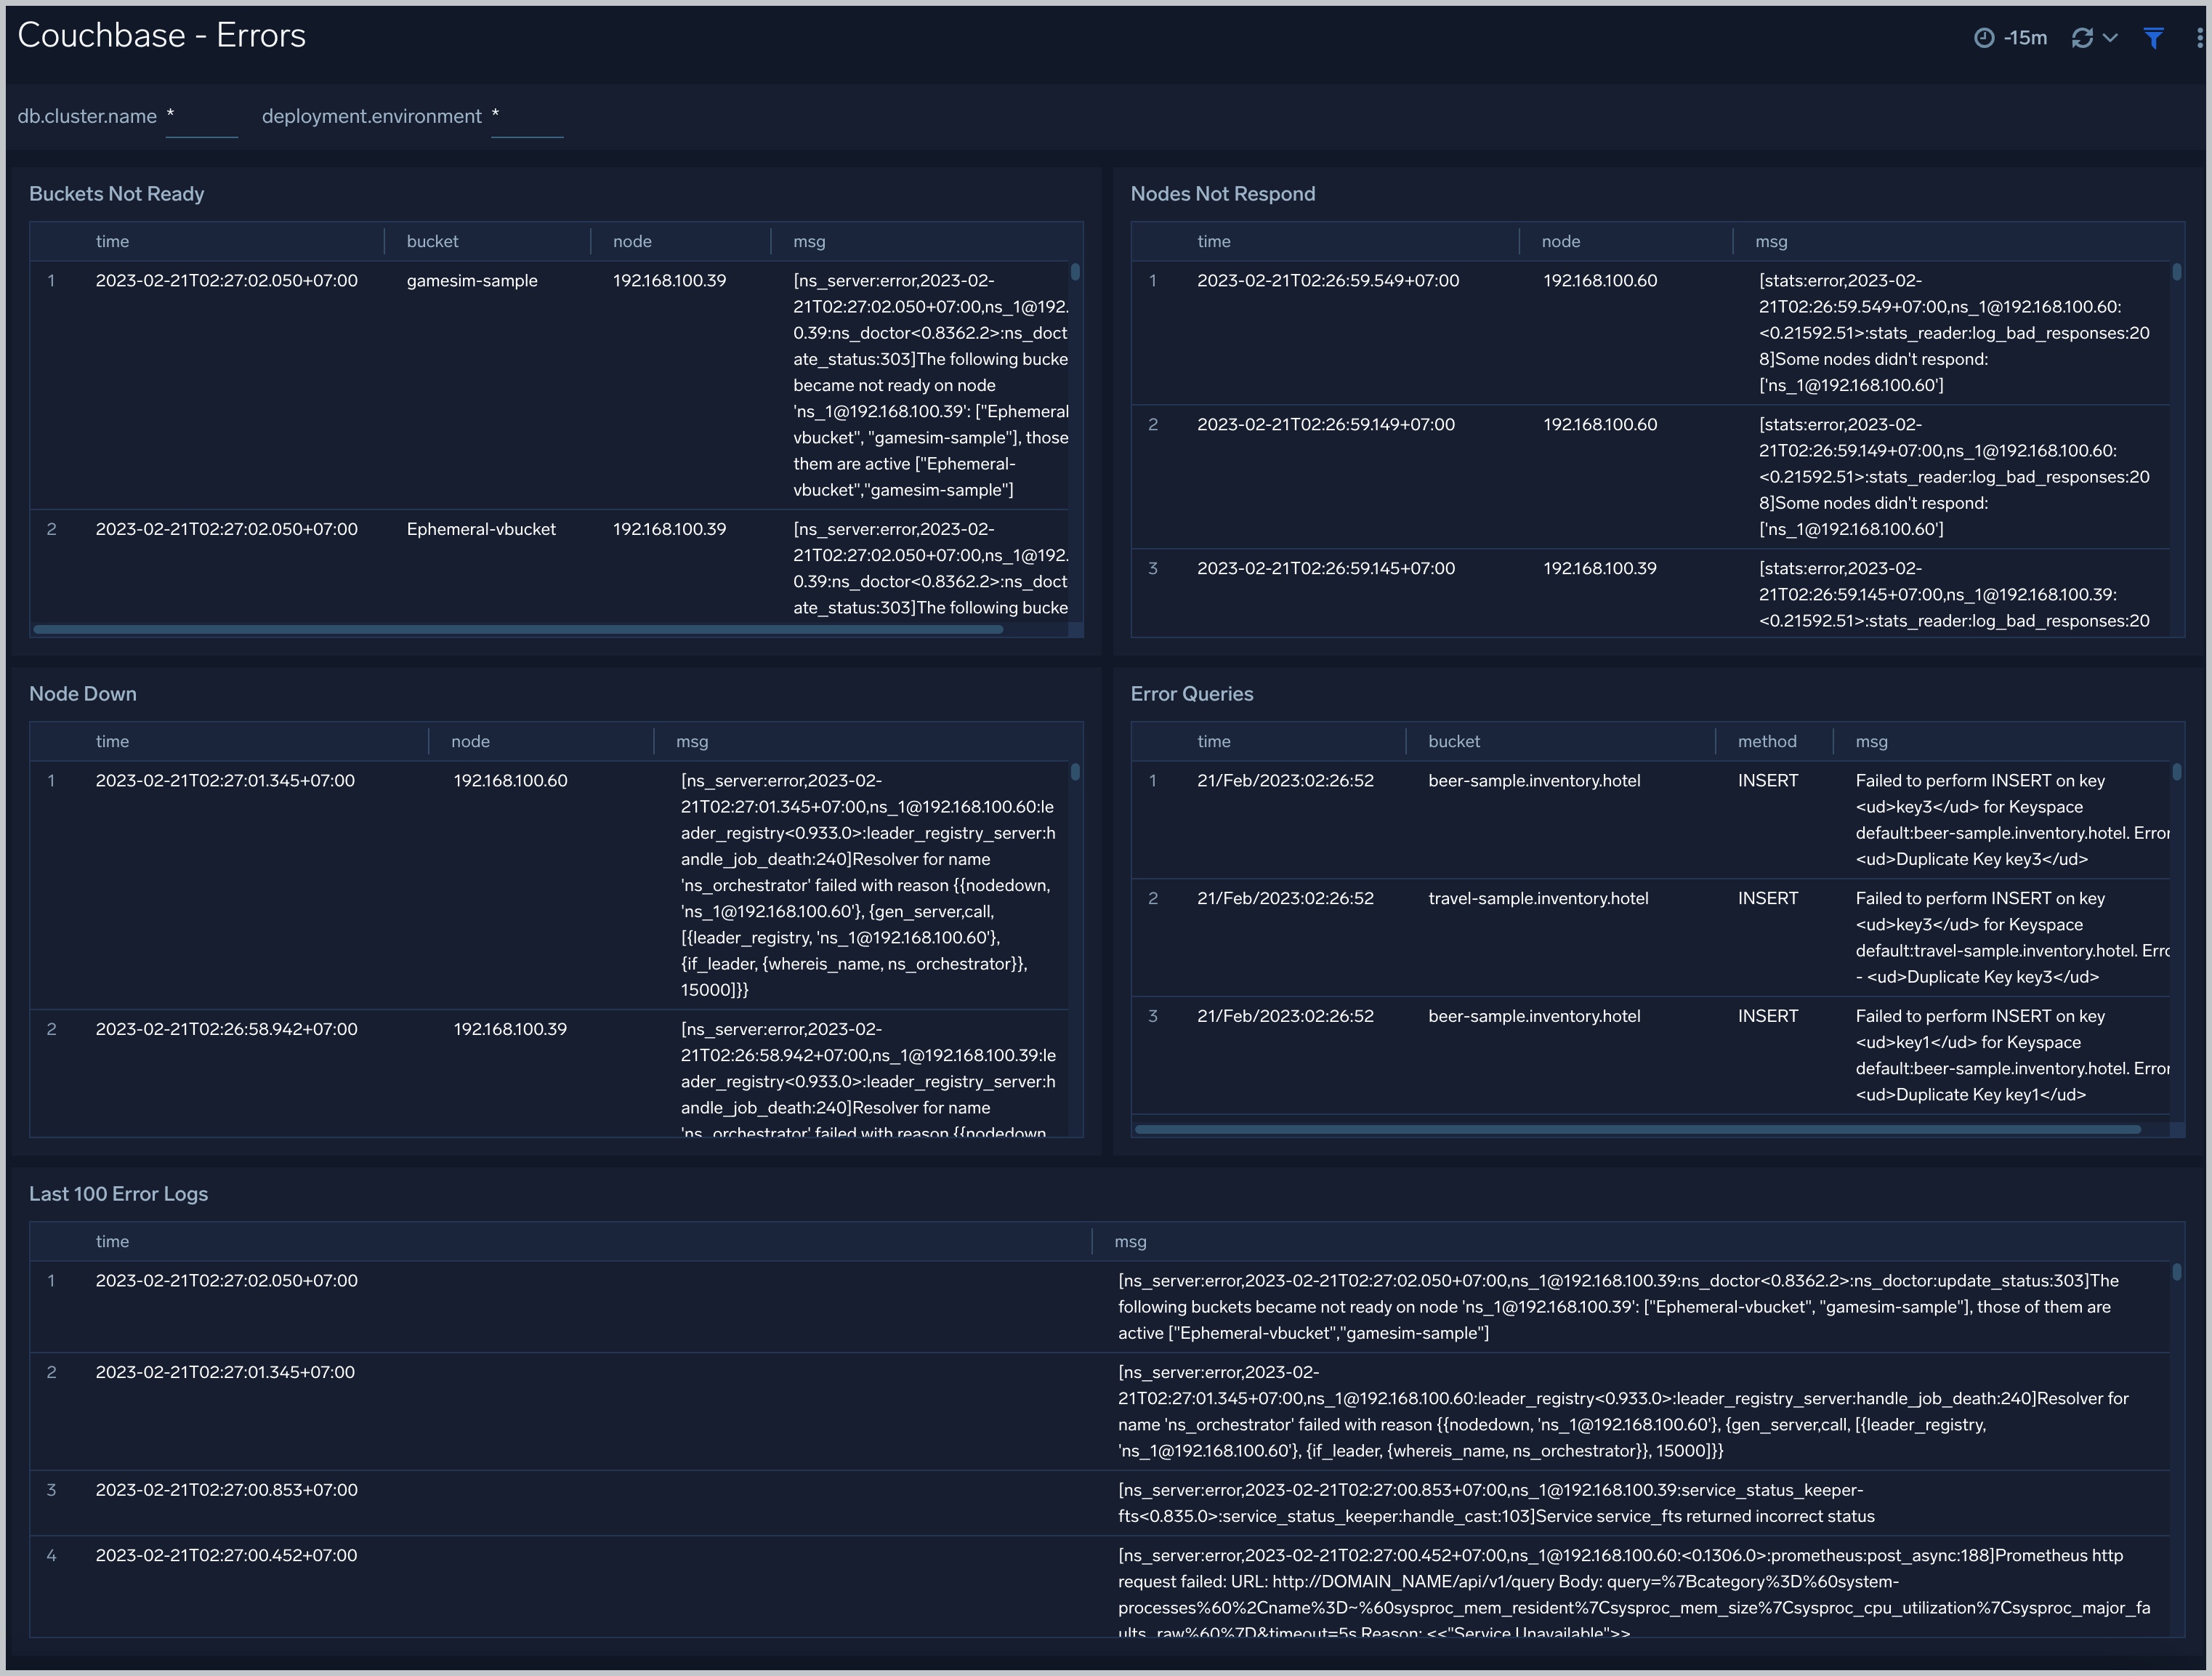
Errors
The Couchbase - Errors dashboard provides insights into errors from error logs in couchbase servers and couchbase clusters: buckets not ready, nodes not responding, node down, error queries, last error logs.
Use this dashboard to:
- Quickly identify critical errors affecting your couchbase servers.
- Identify SQL error queries from clients.
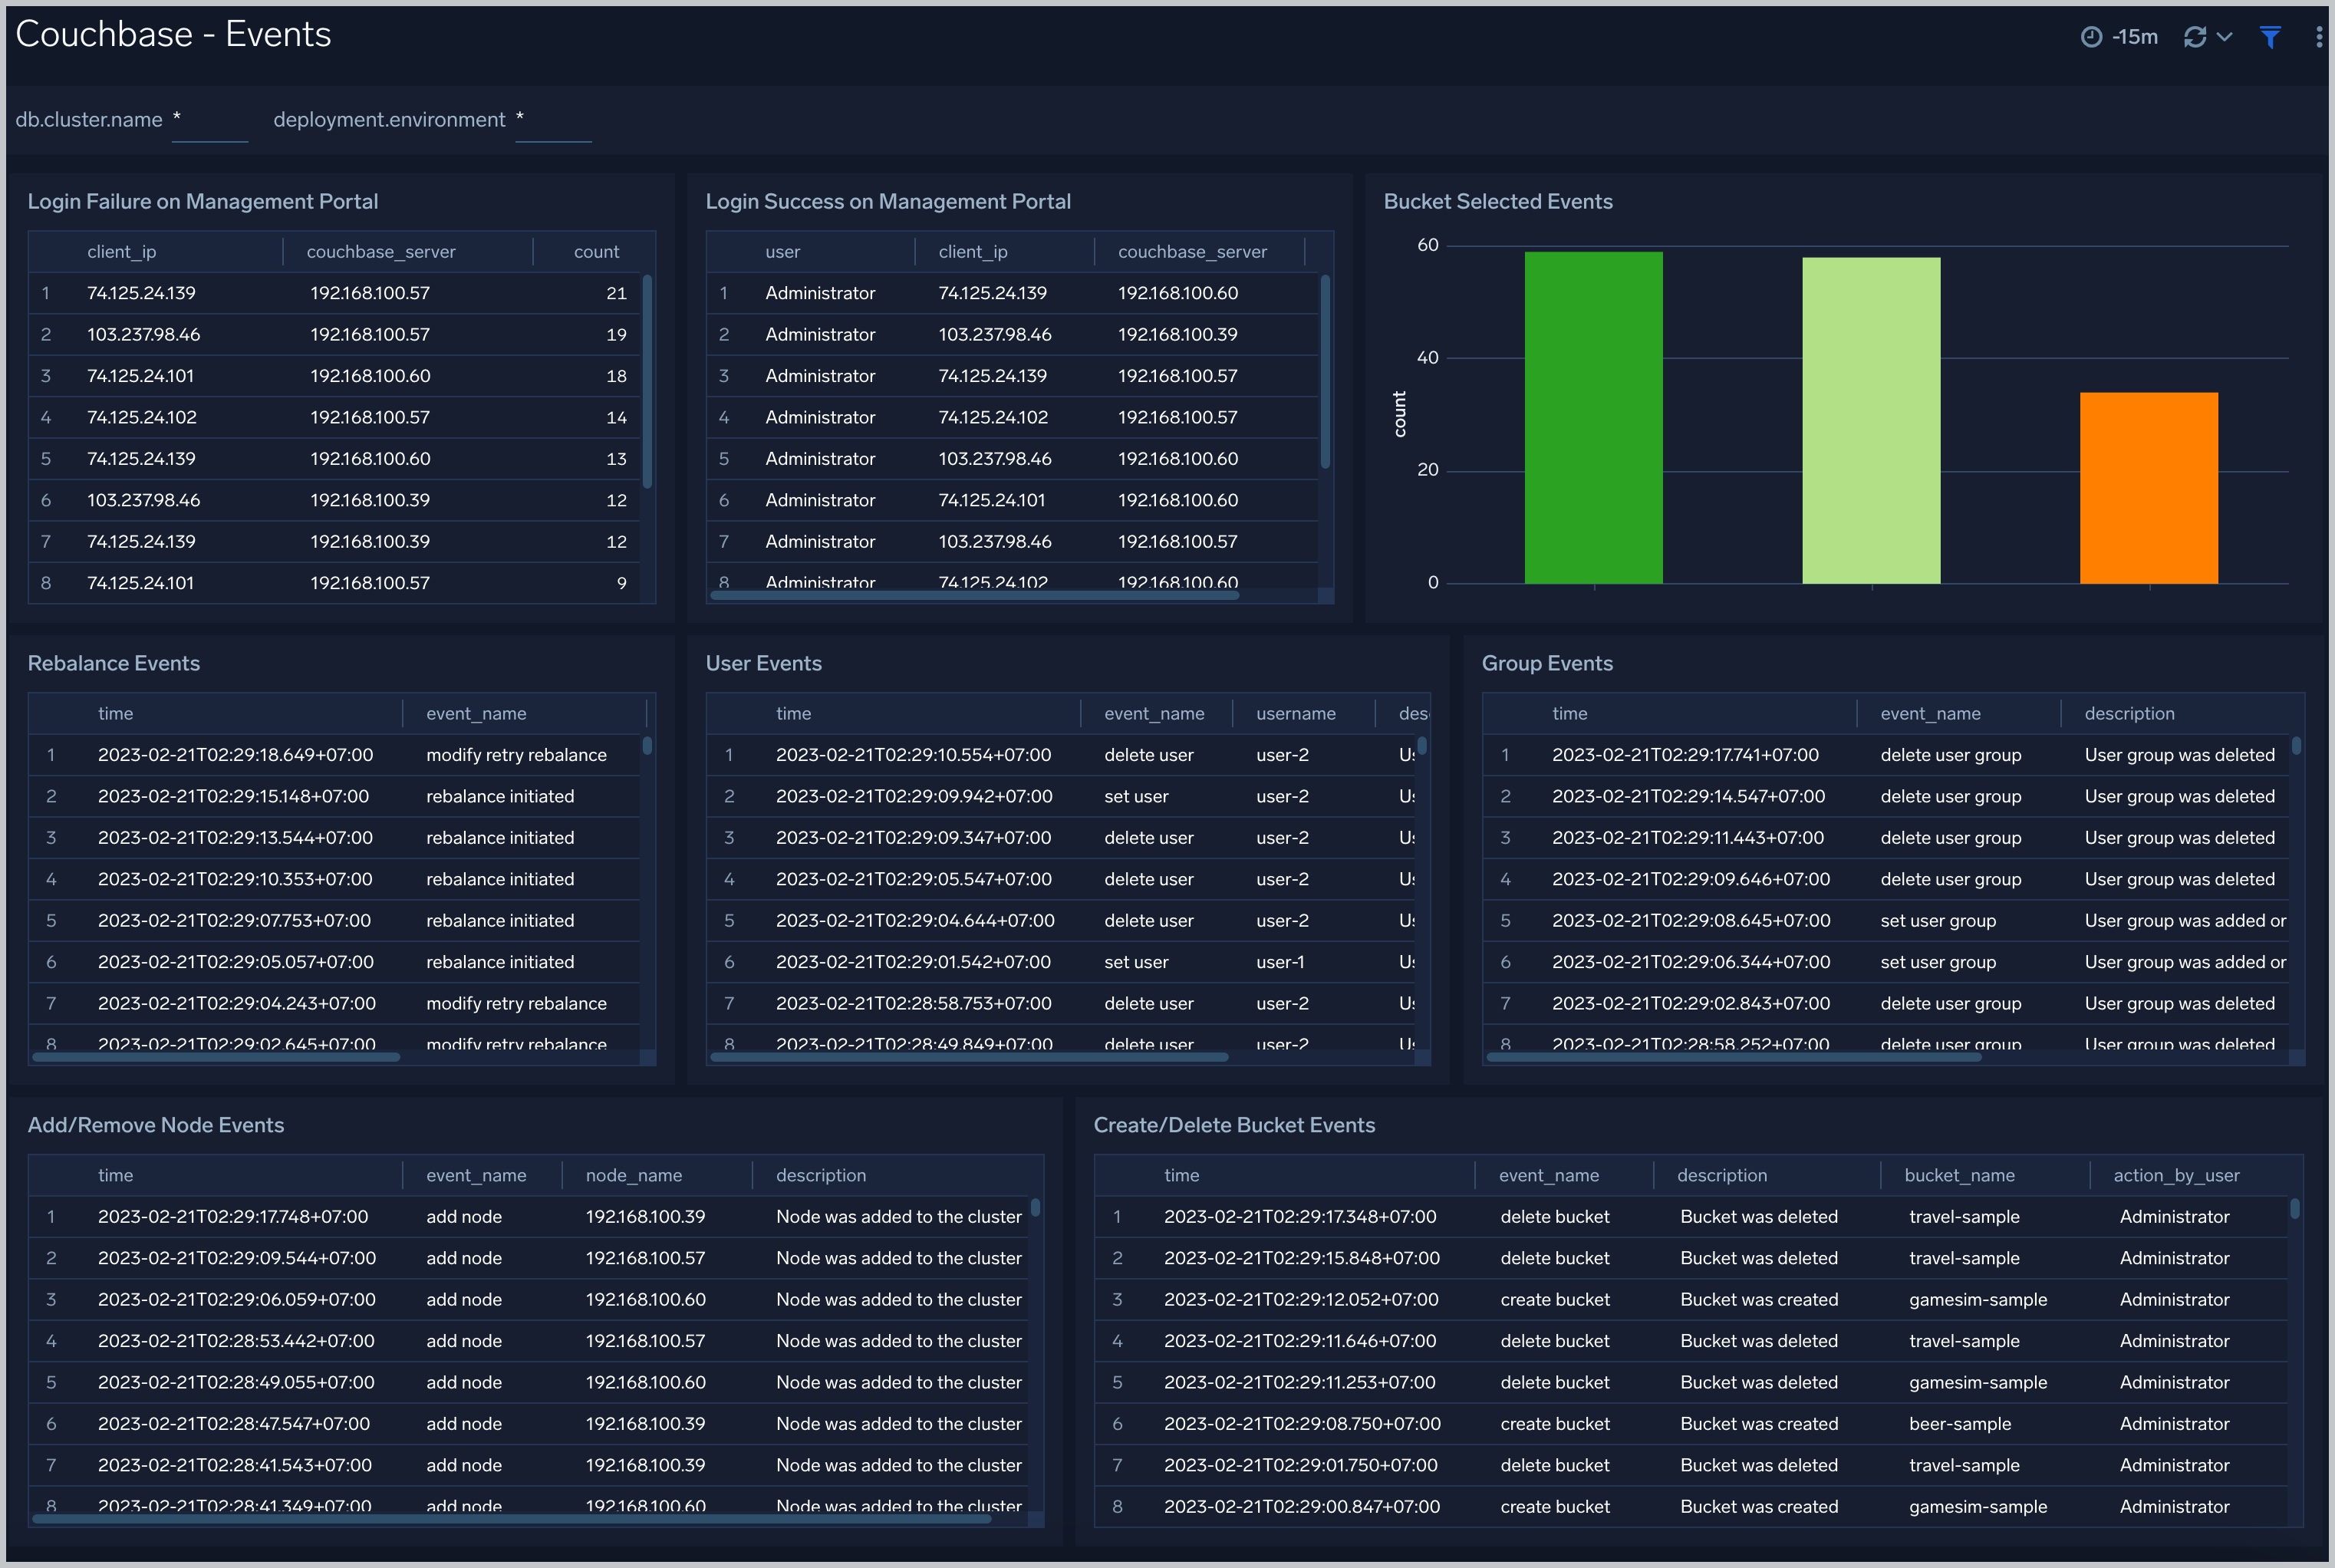
Events
The Couchbase - Events dashboard provides insights into events from couchbase servers and couchbase clusters: the number of login failure, login success from clients, add/remove node events, add/remove bucket events, rebalance events.
Use this dashboard to:
- To audit the activities happening in the cluster. This helps to determine what activities have occurred in the system, helping to control system security.
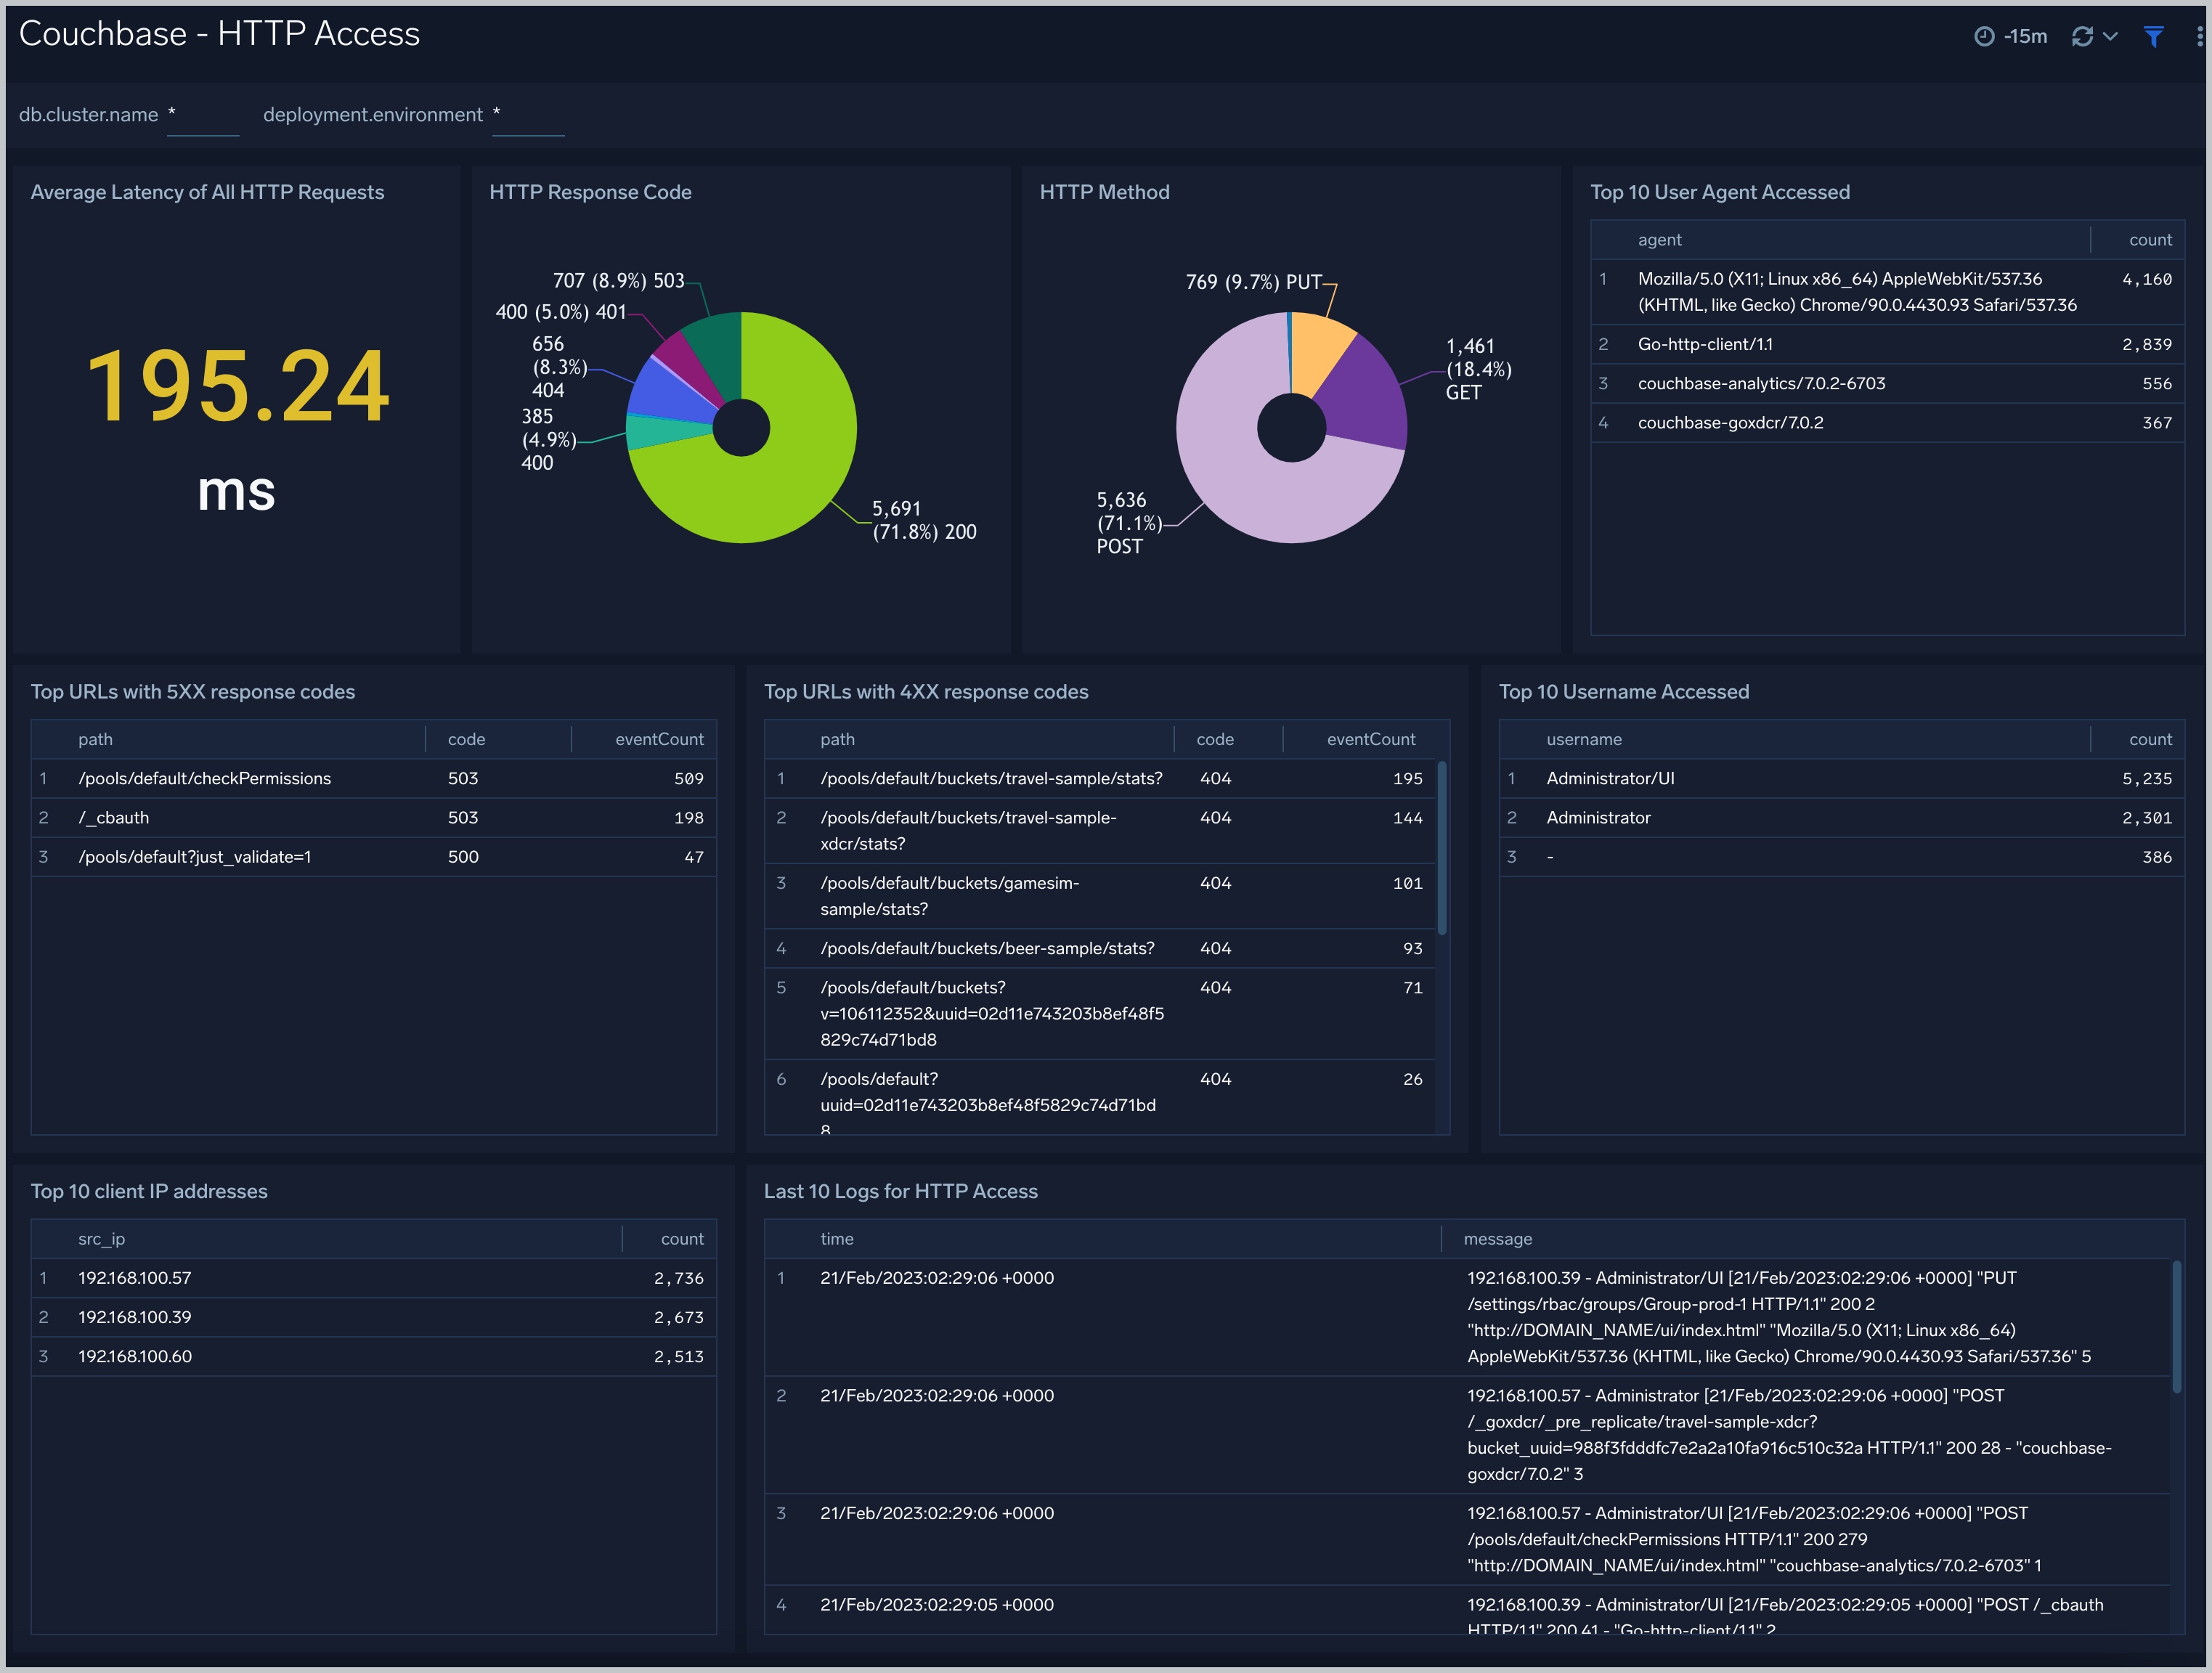
HTTP Access
The Couchbase - HTTP Access dashboard provides insights into HTTP Rest API requests from clients to couchbase servers and couchbase clusters: the latency, HTTP codes, client agents, IP clients, errors with 4XX 5XX response code.
Use this dashboard to:
- To understand user behavior accessing clusters and servers through Rest API.