Jira - OpenTelemetry Collector

The Sumo Logic app for Jira provides insight into Jira usage, request activity, issues, security, sprint events, and user events.
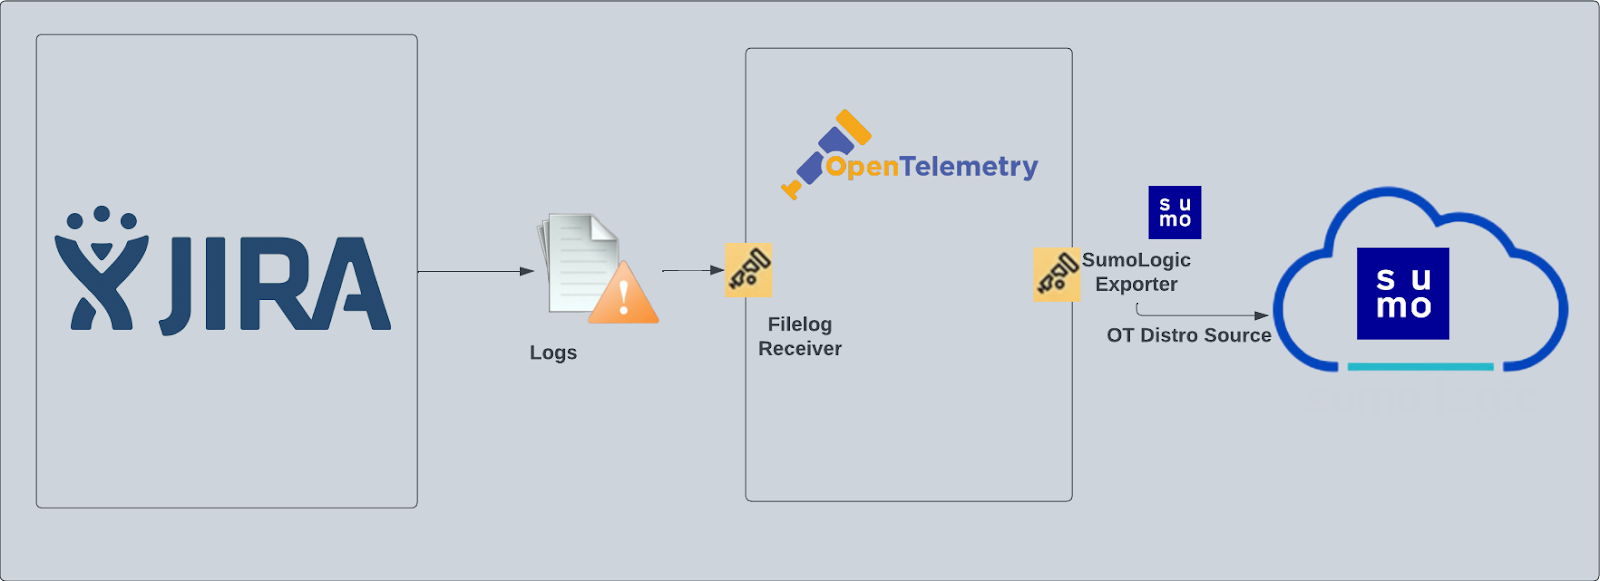
Jira logs are sent to Sumo Logic through OpenTelemetry filelog receiver.
Fields creation in Sumo Logic for Jira
Following are the tags which will be created as part of the Jira App install if not already present.
sumo.datasource. Has fixed value of jira.
Prerequisites
This section provides instructions for configuring log collection for Jira running on a non-Kubernetes environment for the Sumo Logic App for Jira. Sumo Logic supports the collection of logs from Jira server in standalone environments.
Follow the instructions to set up log collection.
The Jira app uses the following log types:
- Jira Access Logs. HTTP server access log files, in
logs/access_logs, in your Jira Installation Directory. - Jira Security Logs. Security-related information, such as logins, logouts, session creation/destruction, and security denials from
atlassian-jira-security.log. - Jira Catalina Logs. The application catalina log file,
logs/catalina.out, in your Jira Installation Directory. - Jira Webhooks. Webhook events of types:
- Issue
- User
- Sprint
For Linux systems with ACL Support, the otelcol install process should have created the ACL grants necessary for the otelcol system user to access default log locations. You can verify the active ACL grants using the getfacl command. Install the ACL in your Linux environment, if not installed.
The required ACL may not be supported for some rare cases, for example, Linux OS Distro, which is officially not supported by Sumo Logic. In this case, you can run the following command to explicitly grant the permissions.
sudo setfacl -R -m d:u:otelcol-sumo:r-x,d:g:otelcol-sumo:r-x,u:otelcol-sumo:r-x,g:otelcol-sumo:r-x <PATH_TO_LOG_FILE>
Run the above command for all the log files in the directory that need to be ingested, which are not residing in the default location.
If Linux ACL Support is not available, traditional Unix-styled user and group permission must be modified. It should be sufficient to add the otelcol system user to the specific group that has access to the log files.
For Windows systems, log files which are collected should be accessible by the SYSTEM group. Use the following set of PowerShell commands if the SYSTEM group does not have access.
$NewAcl = Get-Acl -Path "<PATH_TO_LOG_FILE>"
# Set properties
$identity = "NT AUTHORITY\SYSTEM"
$fileSystemRights = "ReadAndExecute"
$type = "Allow"
# Create new rule
$fileSystemAccessRuleArgumentList = $identity, $fileSystemRights, $type
$fileSystemAccessRule = New-Object -TypeName System.Security.AccessControl.FileSystemAccessRule -ArgumentList $fileSystemAccessRuleArgumentList
# Apply new rule
$NewAcl.SetAccessRule($fileSystemAccessRule)
Set-Acl -Path "<PATH_TO_LOG_FILE>" -AclObject $NewAcl
Configure hosted collector to receive Webhooks
In this step, you create a host collector to receive webhooks from Jira and set up an HTTP source on it.
- Configure a hosted collector, or select an existing hosted collector for the HTTP source.
- Configure an HTTP source on the hosted collector.
- For Source Category, specify Atlassian/Jira/Events
- Add
sumo.datasourceas File to this source and assign the value jira for it.

- Make a note of the HTTP address for the source. You will supply it when you configure a Jira webhook in the next step.
Register webhook in Jira
Follow the instructions on Webhooks in Jira help to register a webhook for the following events:
- Issue related:
- created (jira:issue_created)
- updated (jira:issue_updated)
- deleted (jira:issue_deleted)
- worklog changed (jira:worklog_updated)
- User related:
- created (user_created)
- updated (user_updated)
- deleted (user_deleted)
- Sprint related:
- created (sprint_created)
- deleted (sprint_deleted)
- updated (sprint_updated)
- started (sprint_started)
- closed (sprint_closed)
When you configure the webhook, enter the URL for the HTTP source you created as the endpoint for the webhook.
Collection configuration and app installation
As part of data collection setup and app installation, you can select the App from App Catalog and click on Install App. Follow the steps below.
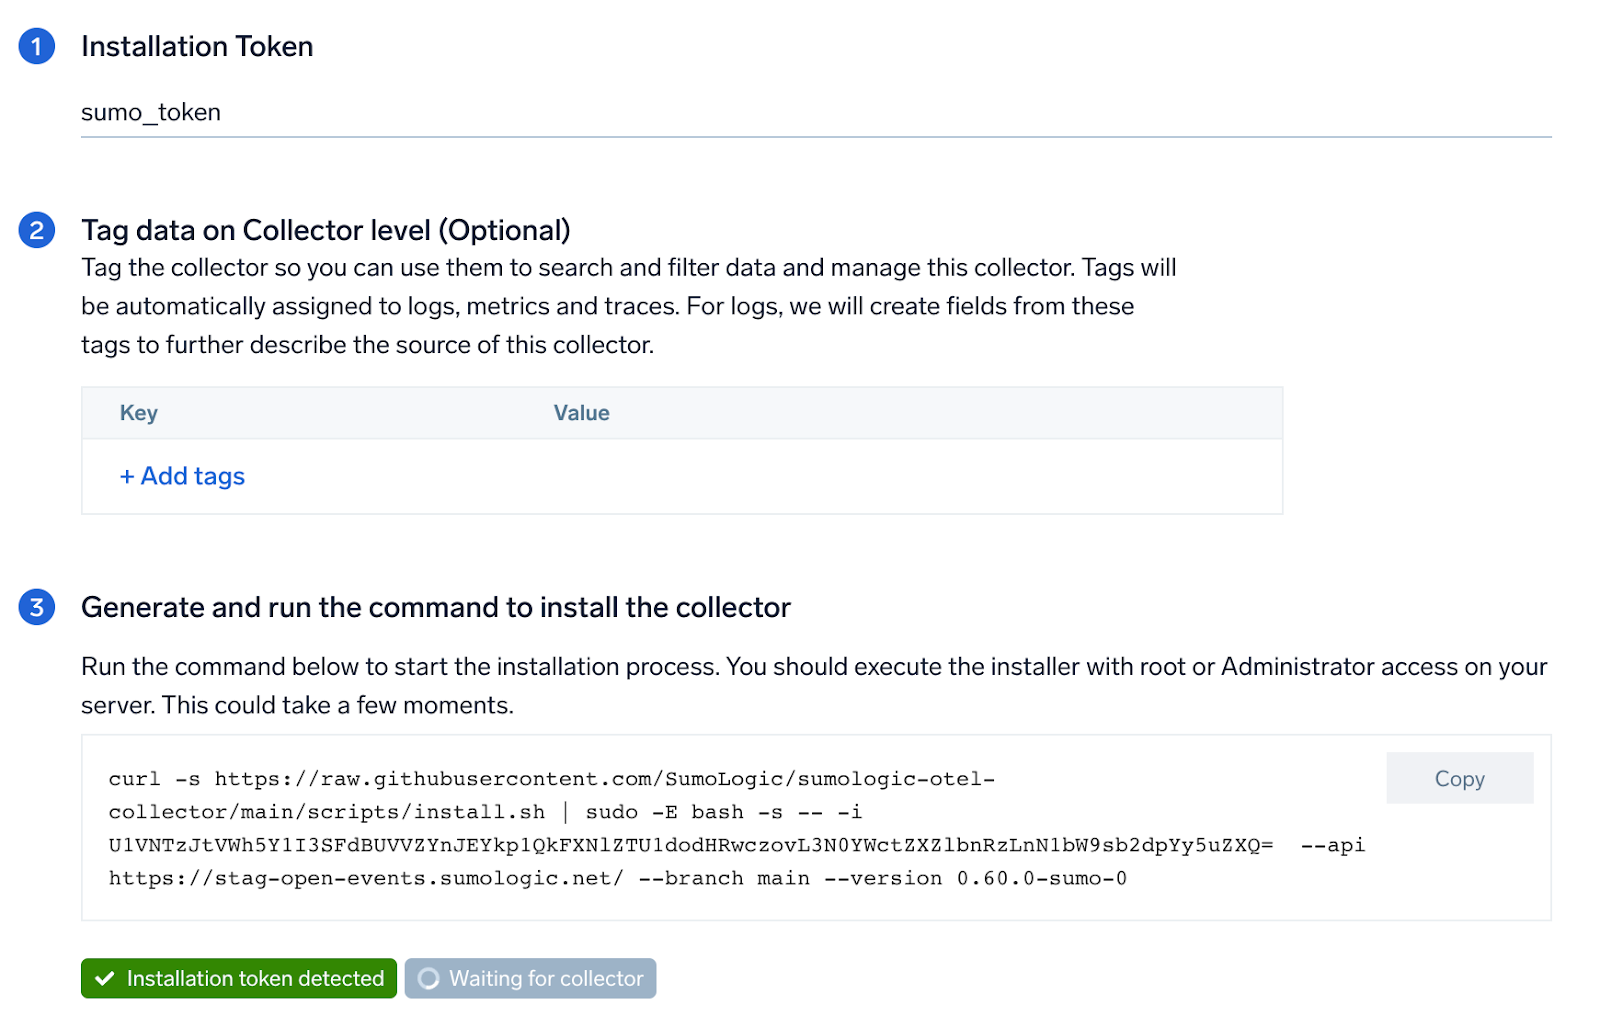
Step 1: Set up Collector
If you want to use an existing OpenTelemetry Collector, you can skip this step by selecting the Use an existing Collector option.
To create a new Collector:
- Select the Add a new Collector option.
- Select the platform where you want to install the Sumo Logic OpenTelemetry Collector.
This will generate a command that you can execute in the machine environment you need to monitor. Once executed, it will install the Sumo Logic OpenTelemetry Collector.
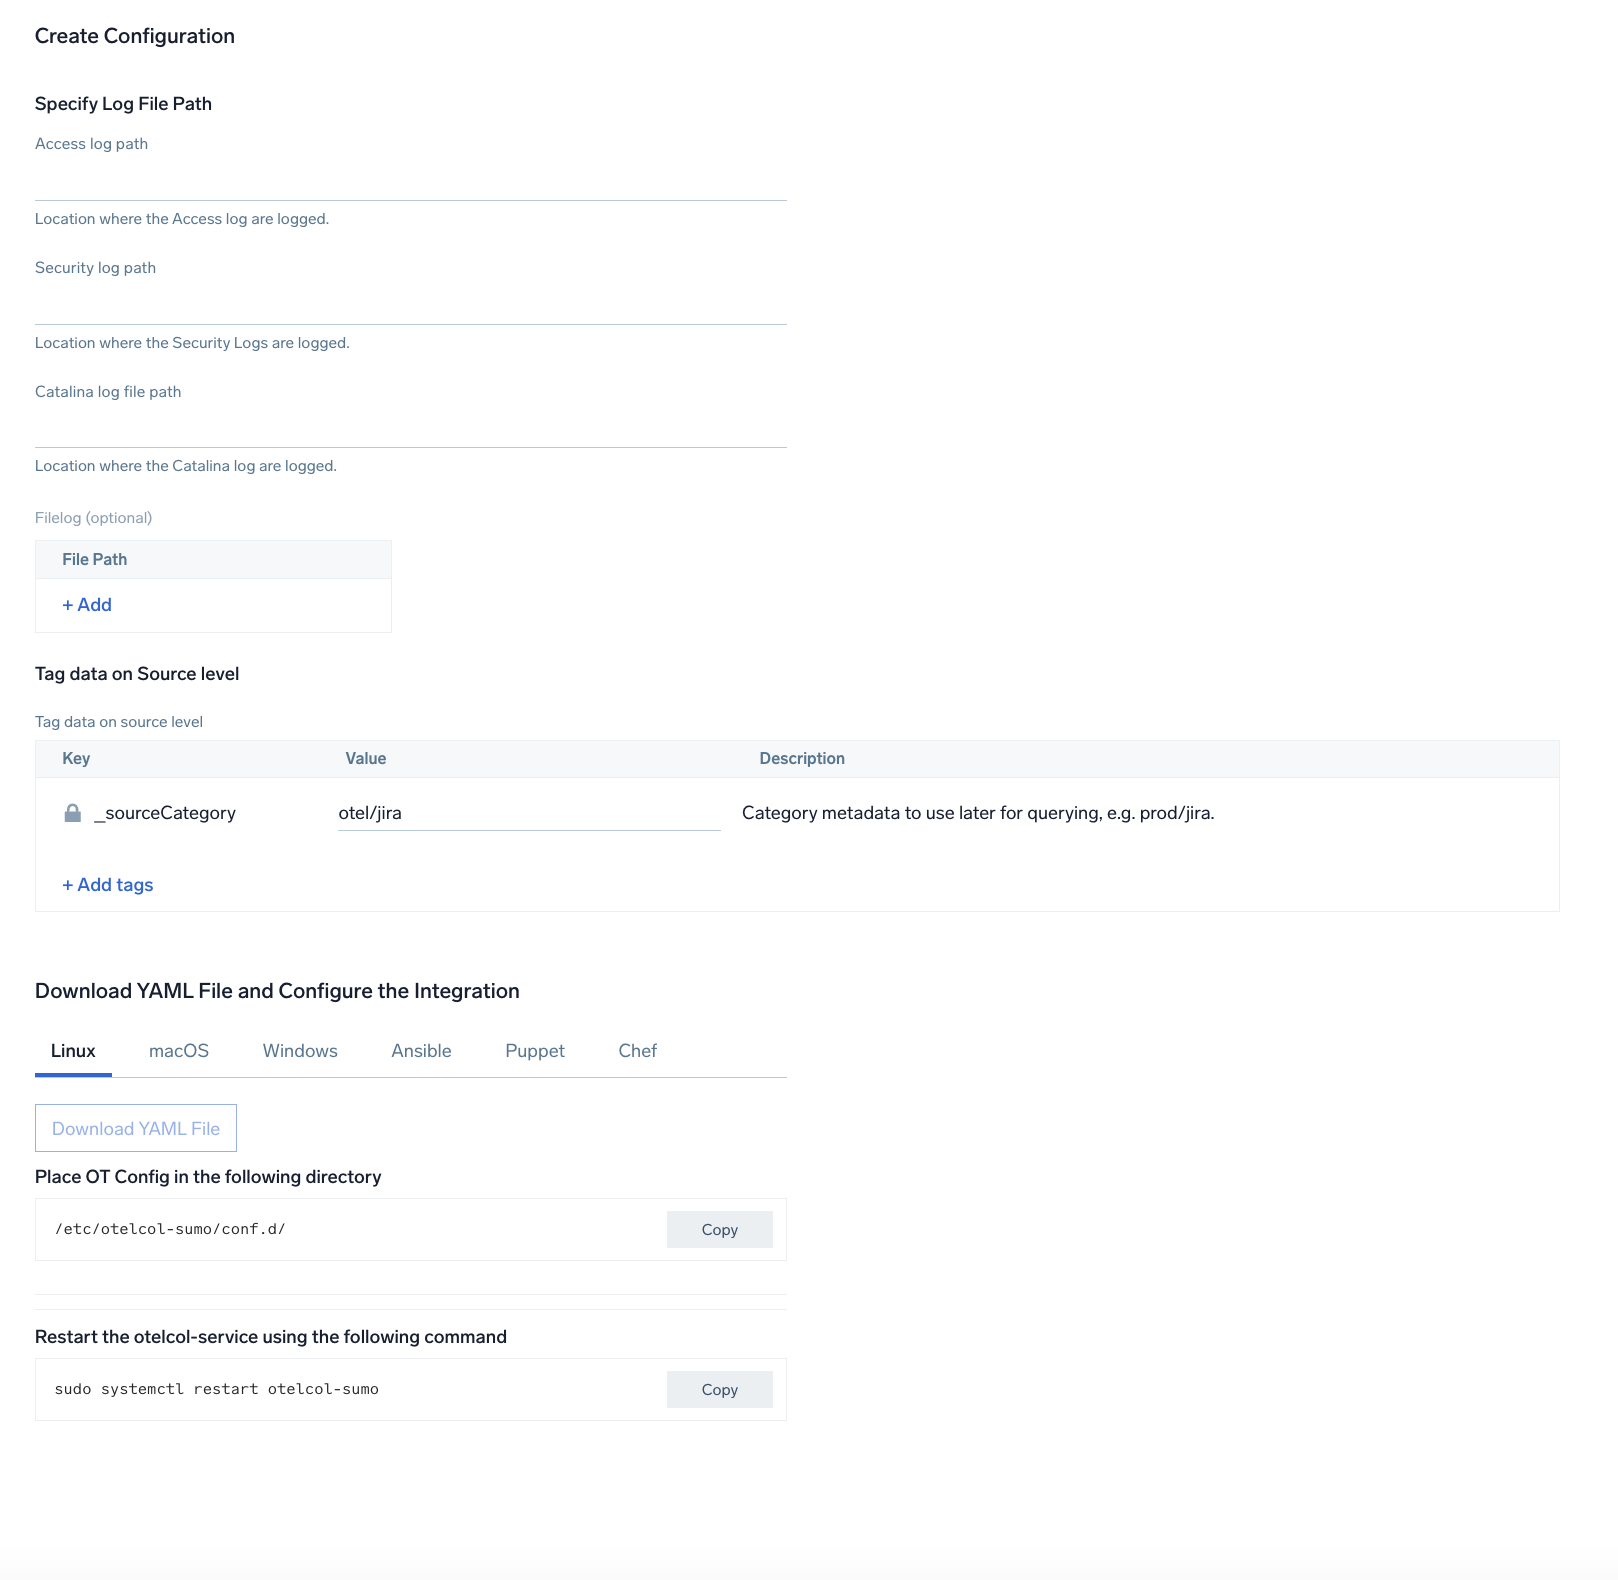
Step 2: Configure integration
In this step, you will configure the yaml file required for Jira Collection.
Path of the different log file configured to capture Jira logs is needed to be given here:
- Jira Access Logs. Apache HTTP server log files. Default path
/var/log/apache2/*.log. - Jira Security Logs. Security-related information. Default path
/home/jira/atlassian/application-data/jira/log/atlassian-jira-security.log. - Jira Catalina Logs. The application server log file. Default path
/home/jira/atlassian/application-data/jira/log/*.log.
Click on the Download YAML File button to get the yaml file.
Step 3: Send logs to Sumo Logic
Once you have downloaded the yaml file as described in the previous step, follow the below steps based on your platform.
- Linux
- Windows
- macOS
- Chef
- Ansible
- Puppet
- Copy the yaml file to
/etc/otelcol-sumo/conf.d/folder in the Jira instance that needs to be monitored. - Place Env file in the following directory:
/etc/otelcol-sumo/env/
- Restart the collector using:
sudo systemctl restart otelcol-sumo
- Copy the yaml file to
C:\ProgramData\Sumo Logic\OpenTelemetry Collector\config\conf.dfolder in the machine that needs to be monitored. - Restart the collector using:
Restart-Service -Name OtelcolSumo
- Copy the yaml file to
/etc/otelcol-sumo/conf.d/folder in the Jira instance that needs to be monitored. - Restart the otelcol-sumo process using:
otelcol-sumo --config /etc/otelcol-sumo/sumologic.yaml --config "glob:/etc/otelcol-sumo/conf.d/*.yaml"
- Copy the yaml file into your Chef cookbook files directory
files/<downloaded_yaml_file>. - Use a Chef file resource in a recipe to manage it.
cookbook_file '/etc/otelcol-sumo/conf.d/<downloaded_yaml_file>' do mode 0644 notifies :restart, 'service[otelcol-sumo]', :delayed end - Add the recipe to your collector setup to start collecting the data. Every team typically has their established way of applying the Chef recipe. The resulting Chef recipe should look something like:
cookbook_file '/etc/otelcol-sumo/conf.d/<downloaded_yaml_file>' do
mode 0644
notifies :restart, 'service[otelcol-sumo]', :delayed
end
- Place the file into your Ansible playbook files directory.
- Run the Ansible playbook.
ansible-playbook -i inventory install_sumologic_otel_collector.yaml
-e '{"installation_token": "<YOUR_TOKEN>", "collector_tags": {<YOUR_TAGS>}, "src_config_path": "files/conf.d"}'
- Place the file into your Puppet module files directory
modules/install_otel_collector/files/<downloaded_yaml>. - Use a Puppet file resource to manage it.
file { '/etc/otelcol-sumo/conf.d/<downloaded_yaml_file>':
    ensure => present,
    source => 'puppet:///modules/install_otel_collector/<downloaded_yaml_file>',
    mode => '0644',
    notify => Service[otelcol-sumo],
} - Apply the Puppet manifest. Every team typically has their established way of applying the Puppet manifest. The resulting Puppet manifest should look something like:
node 'default' {
    class { 'install_otel_collector'
      installation_token => '<YOUR_TOKEN>',
      collector_tags => { <YOUR_TAGS> },
    }

    service { 'otelcol-sumo':
      provider => 'systemd',
      ensure => running,
      enable => true,
      require => Class['install_otel_collector'],
    }

    file { '/etc/otelcol-sumo/conf.d/<downloaded_yaml_file>':
      ensure => present,
      source => 'puppet:///modules/install_otel_collector/<downloaded_yaml_file>',
      mode => '0644',
      notify => Service[otelcol-sumo],
    }
  }
After successfully executing the above command, Sumo Logic will start receiving data from your host machine.
Click Next. This will install the app (dashboards and monitors) to your Sumo Logic Org.
Dashboard panels will start to fill automatically. It's important to note that each panel fills with data matching the time range query and received since the panel was created. Results won't immediately be available, but within 20 minutes, you'll see full graphs and maps.
Sample log messages
bluechip-office - - 19/01/2023:05:02:10 Z "GET /jira/rest/gadget/1.0/averageage/generate?projectOrFilterId=filter-16392&periodName=monthly&daysprevious=730&width=428&height=285&inline=true&_=1541539601115 HTTP/1.1" 401 8509 "https://jira.kumoroku.com/jira/plugins/servlet/gadgets/ifr?container=atlassian&mid=17024&country=US&lang=en&view=default&view-params=%7B%22writable%22%3A%22true%22%7D&st=atlassian%3A7udmdg9B2kTj%2FIang%2FZBXDM3COYkLIHJIzAUYmw9QDAiuHR4StJpZph6bTEtMMfxwx46%2B7cTTIjSGz%2B%2FNBJa4GLMS7e3ijRtWhIEIi4u19i2WXZsBZ8ZP8AekcT1JzwwkH9lGt9IRgXmL05epIw8kYAzDpKI1E%2FdHLFYtwo7m1M%2FRSsPMdoYGmwUfuIHM6%2FKGMsCDzToTKRzay85Sw9O7Db6%2B7A9MkQm0BxSmX3hMpV%2BPWgw%2BKDuNwPC0HCzrkMb4V2M3pJE0qBbvJqM2O6ezII938KZBz0%2B1zKnC9Rw2ePrbrm7TjCWGiR77NxKFtowNo3Xfg%3D%3D&up_isConfigured=true&up_isPopup=false&up_refresh=15&up_projectOrFilterId=filter-
Sample queries
This sample query is from the Jira - Overview dashboard > Catalina Requests panel.
"%"sumo.datasource"=jira
| parse "URI *," as URI
| parse regex "\d{2}-\w{3}-\d{4}\s\d{2}:\d{2}:\d{2}.\d{3}\s(?<log_level>\w+)\s\[(?<thread>[^\]]+)\]\s(?<component>\S+)\s(?<message>.*)"
| timeslice 5m
| count _timeslice, log_level
| compare with timeshift 1d
| _count as count
| _count_1d as count1d
| fields - _count, _count_1d
| transpose row _timeslice column log_level
"
Viewing Jira Dashboards
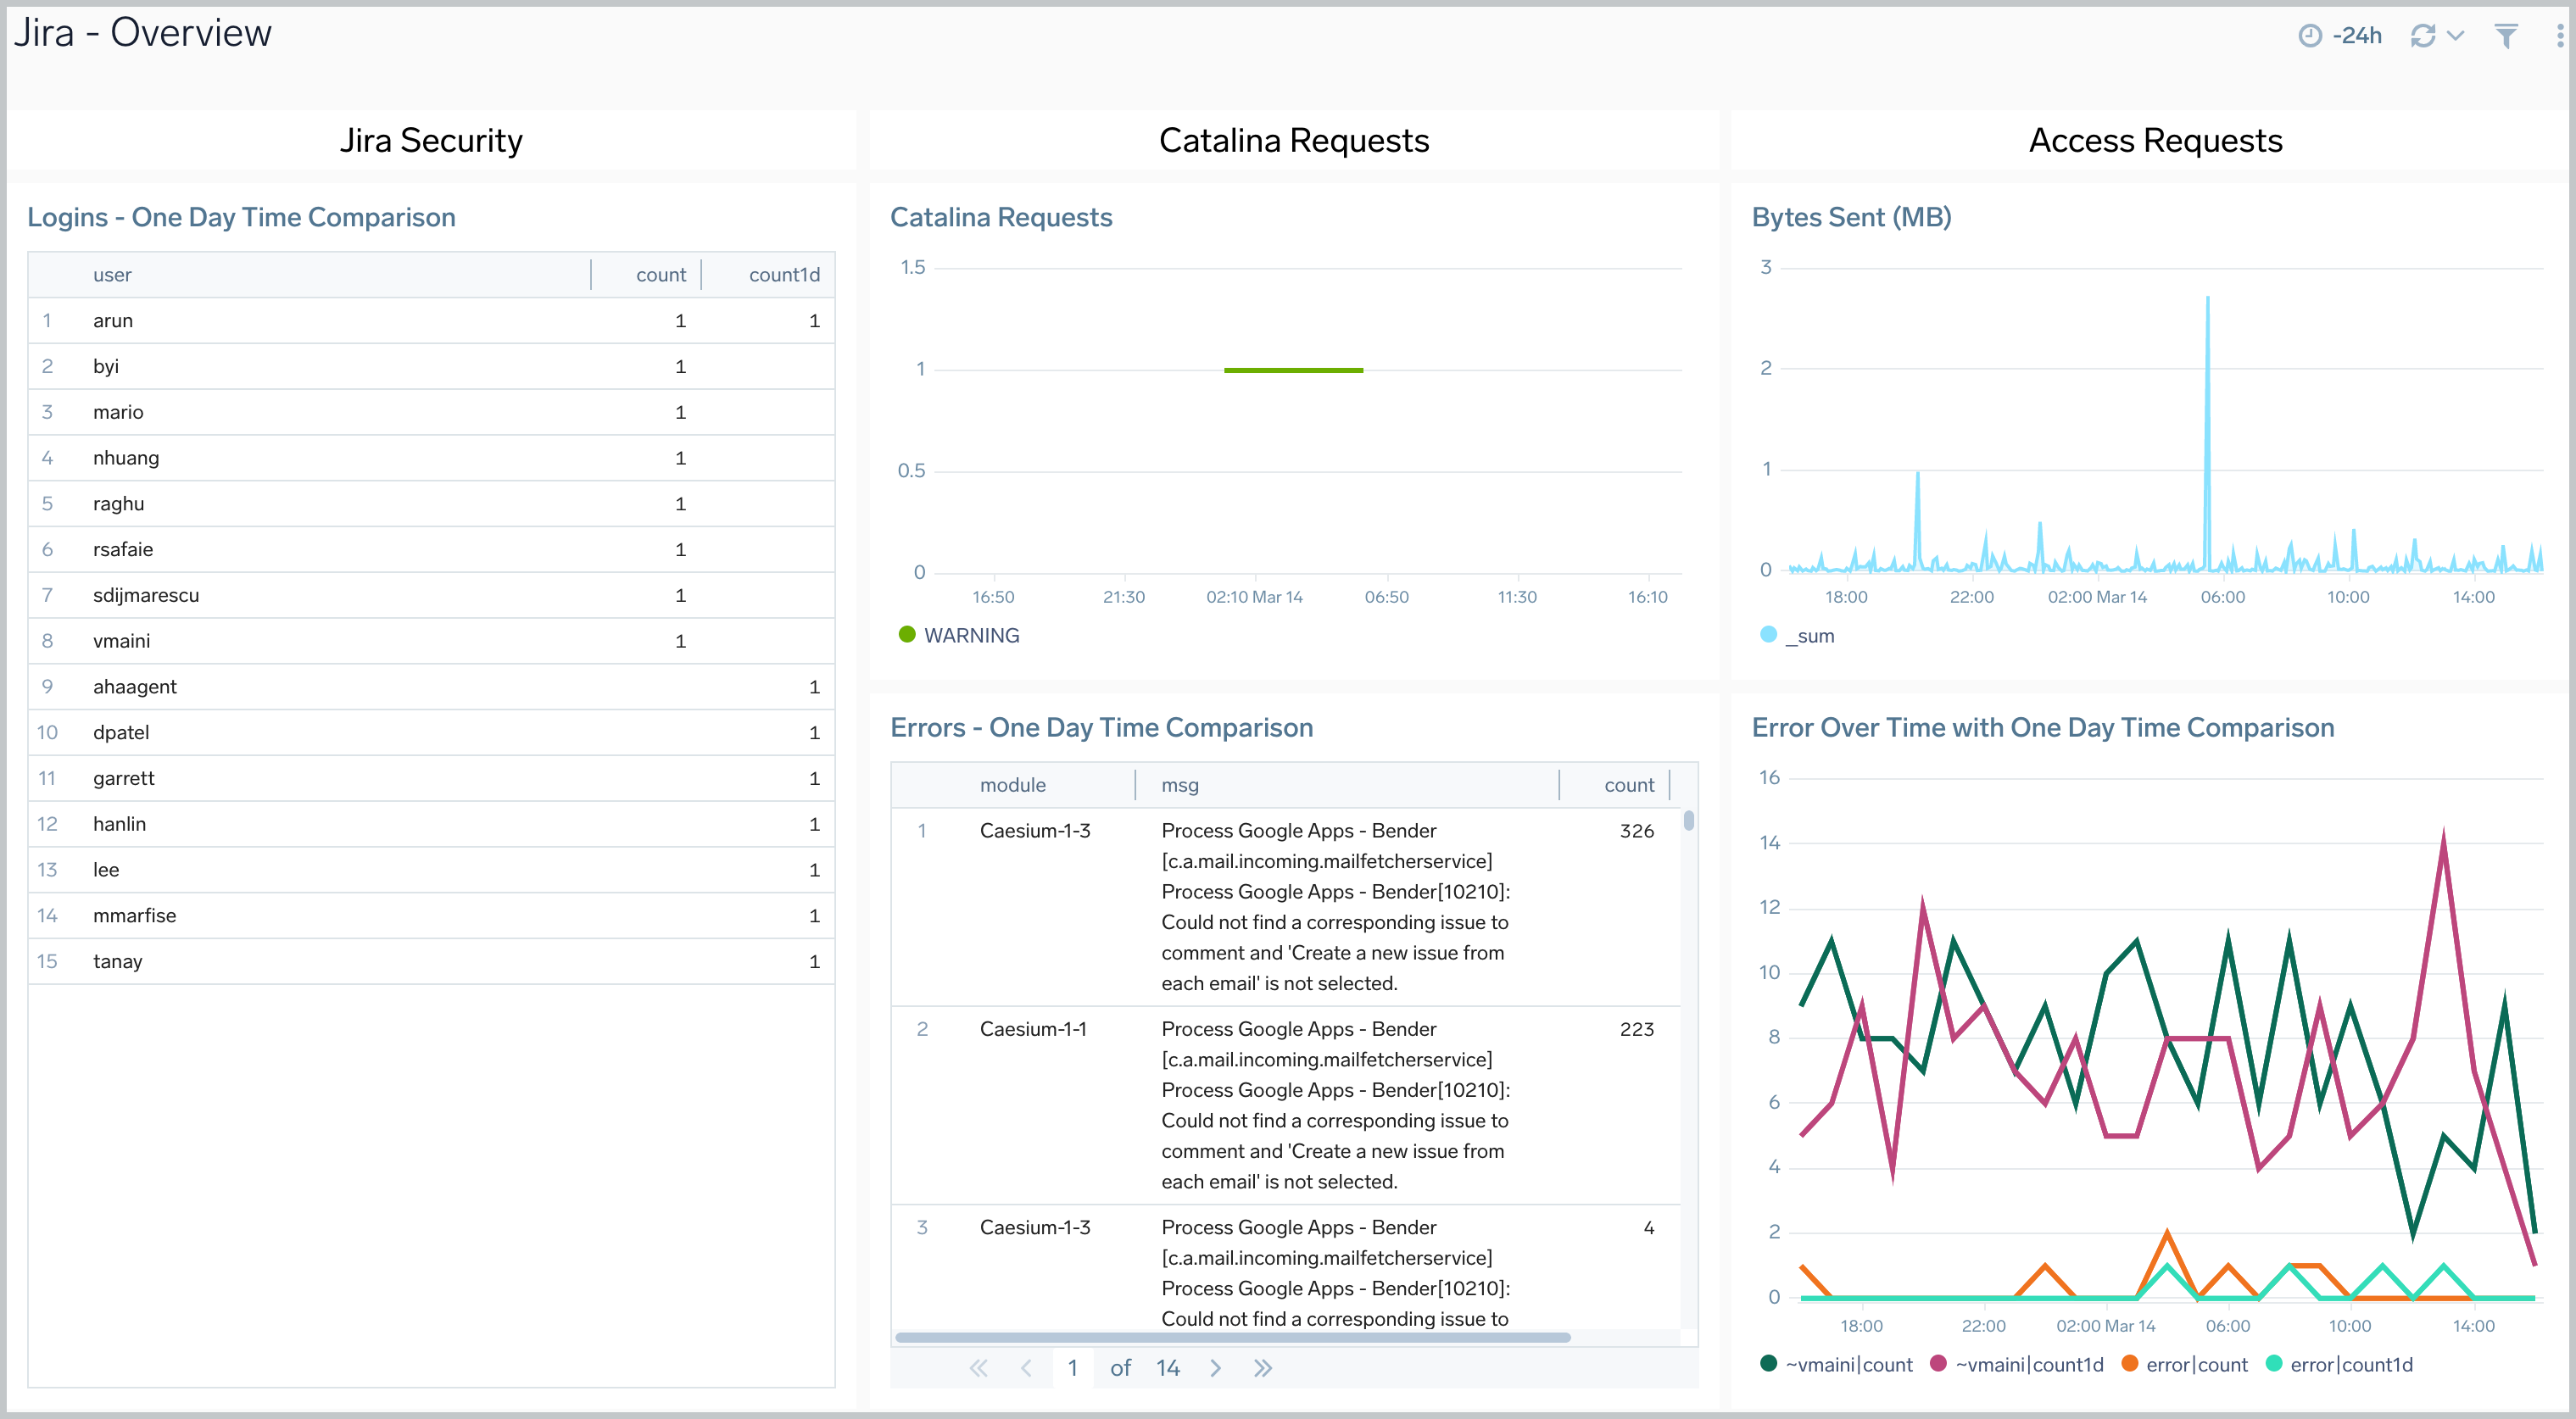
Overview
The Jira - Overview dashboard provides a high-level view of Jira activities, including the location of event authentications, login comparisons, Jira requests, errors and error trends, and data usage.
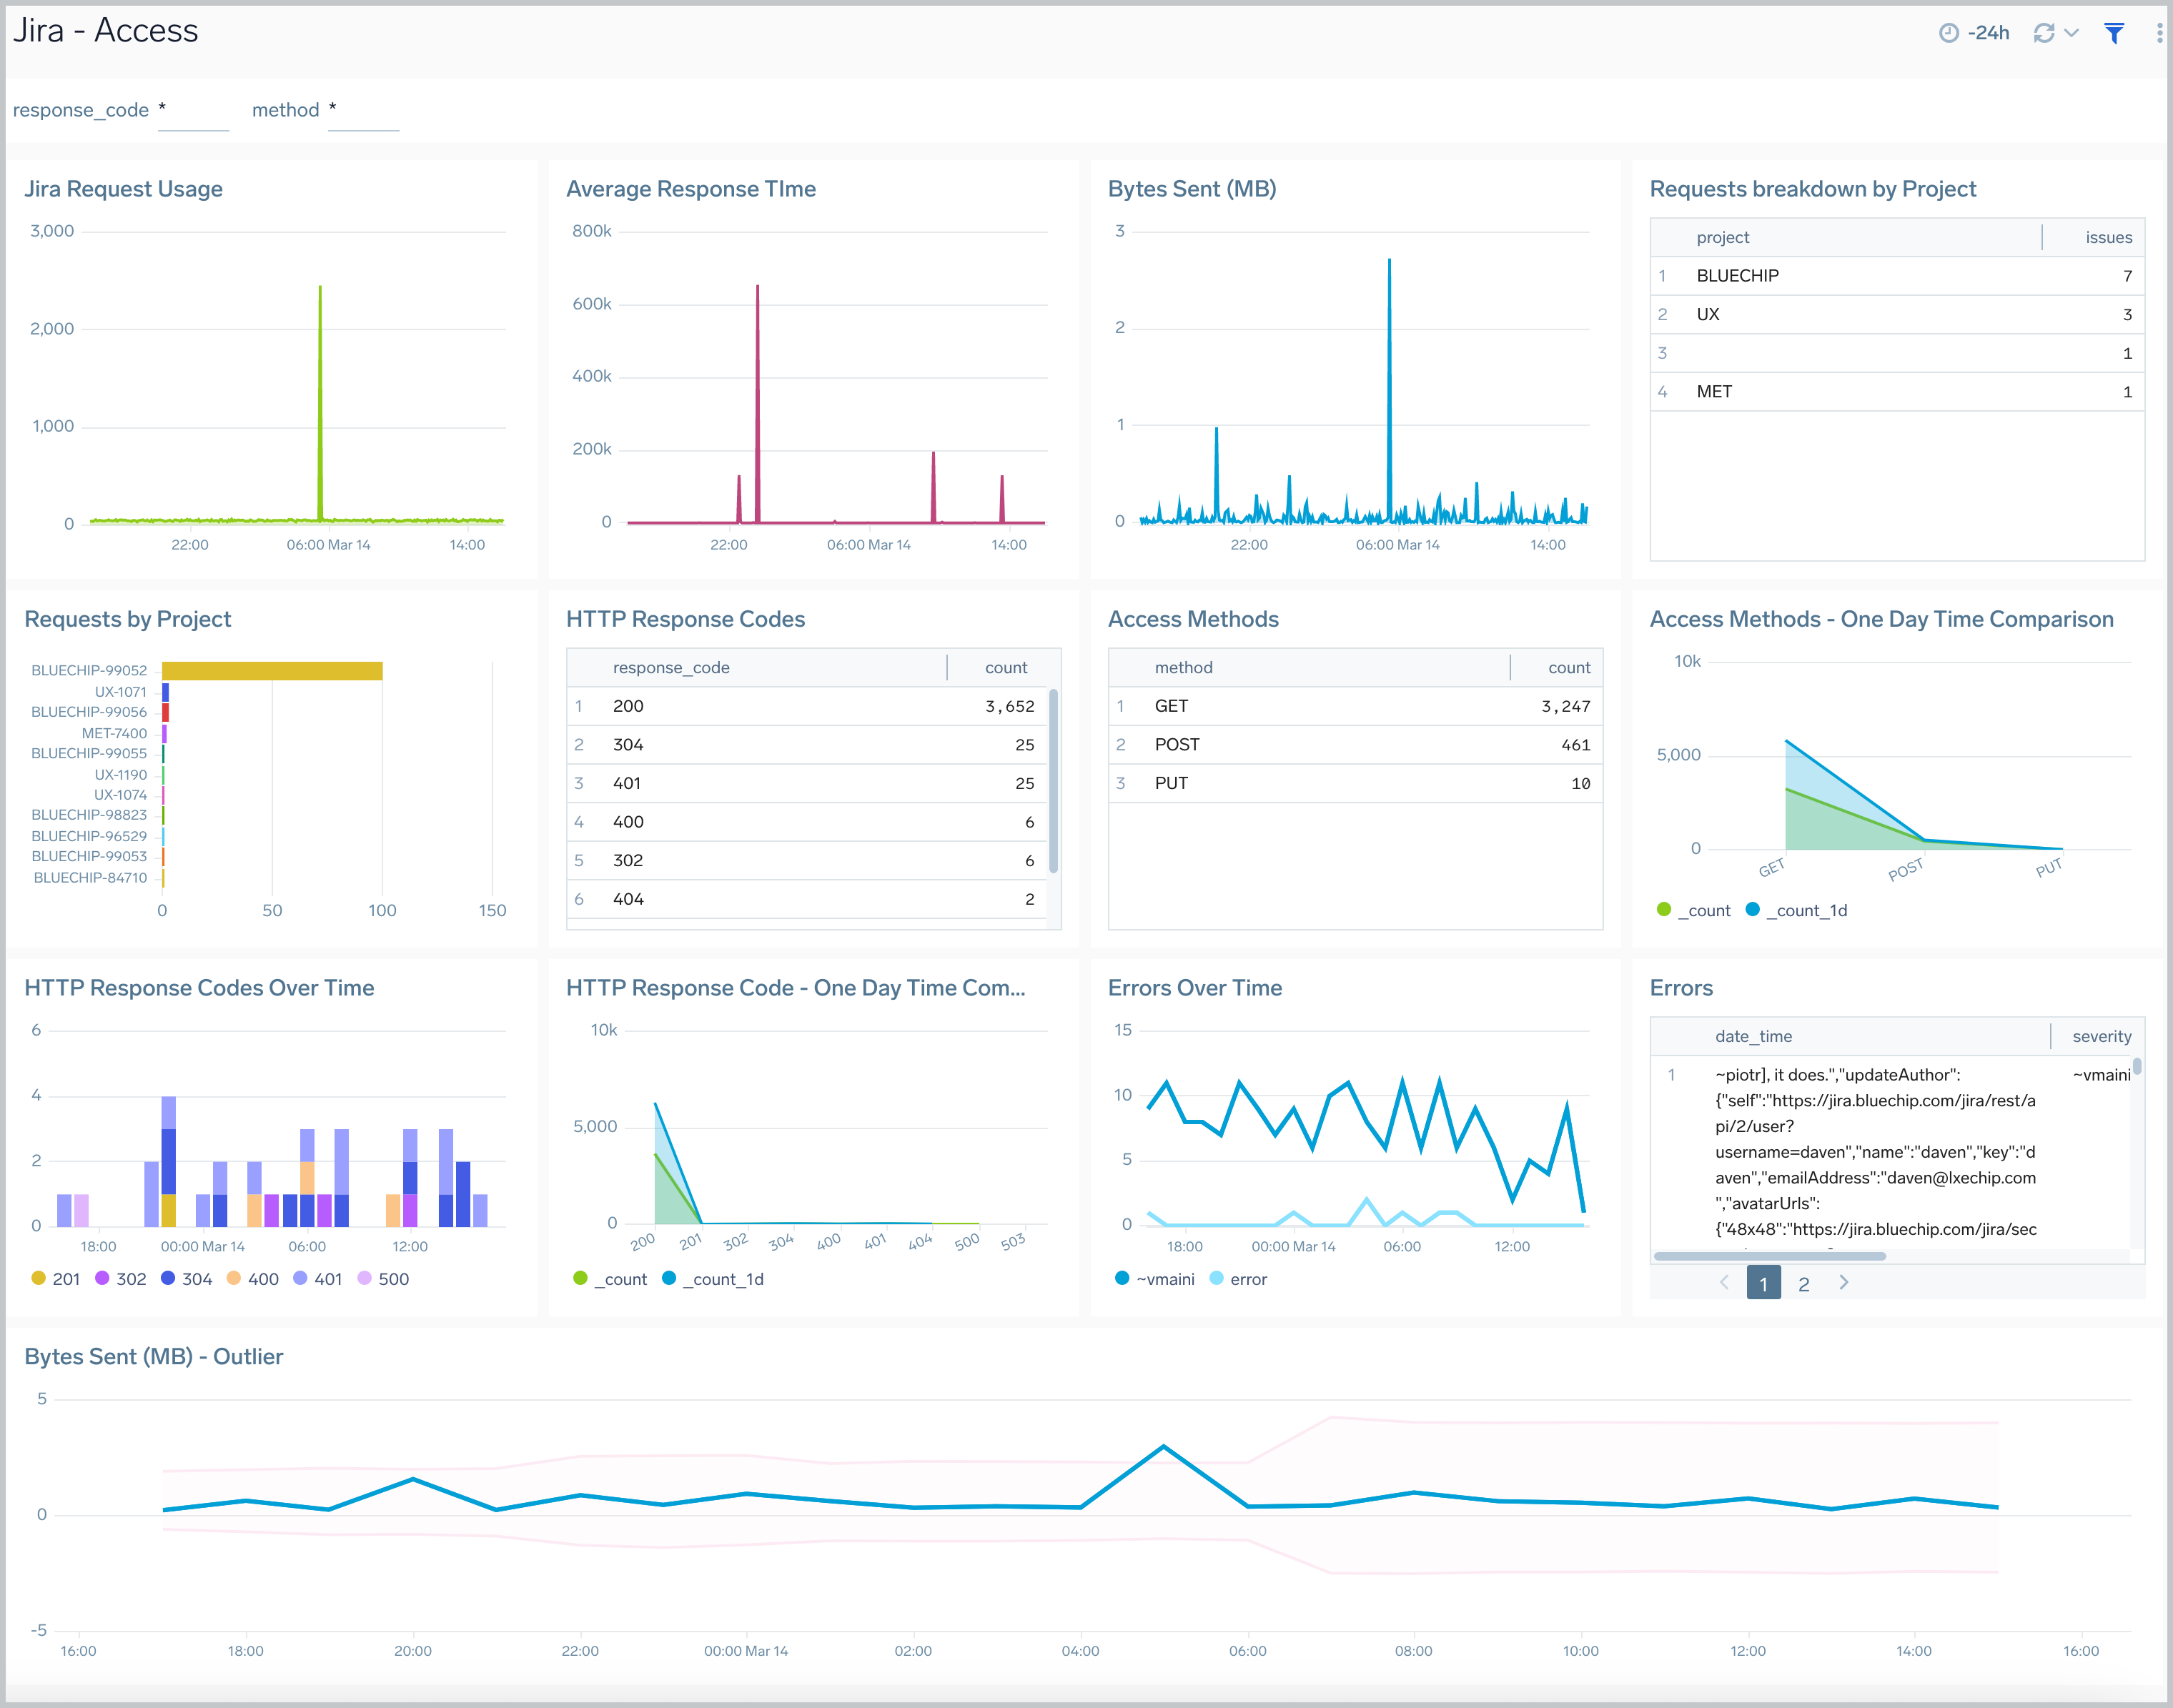
Access
The Jira - Access dashboard provides information about Jira user access, including request trends, average response times, issues by project, response codes, and errors.
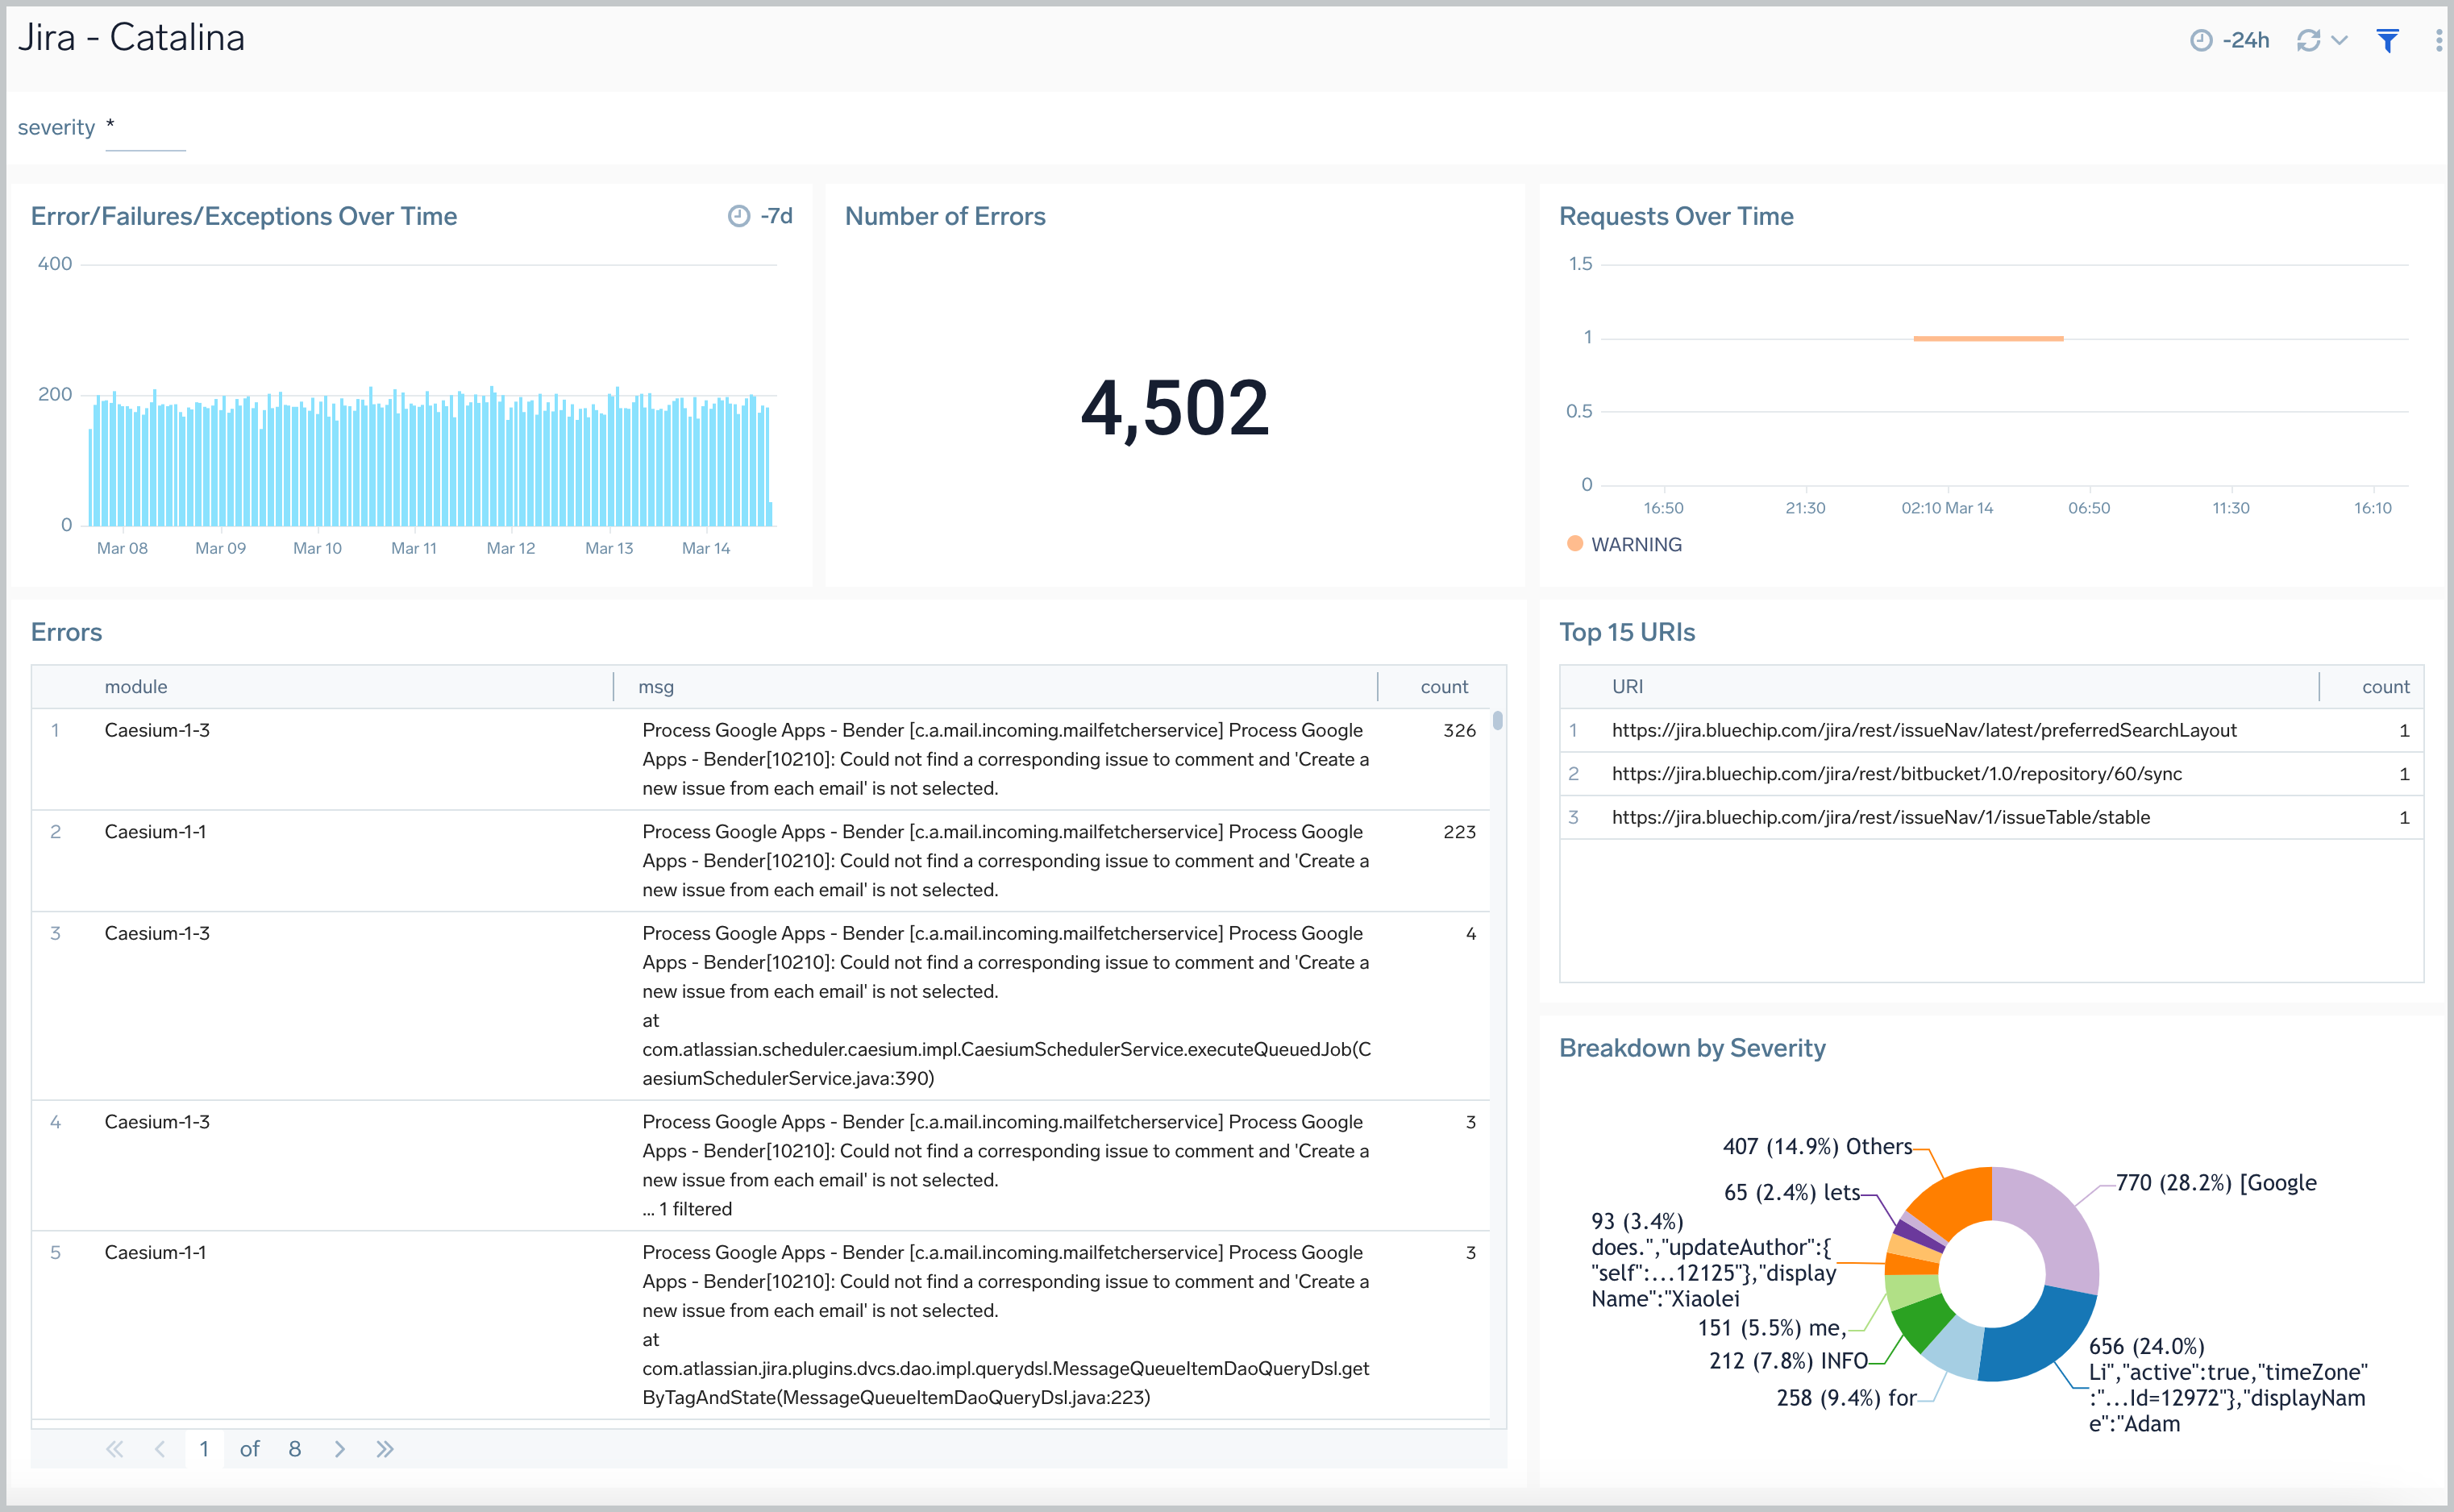
Catalina
The Jira - Catalina dashboard provides information on the Jira internal web server. Panels display analytics for errors, failures, exceptions, request trends, and top ranked URLs
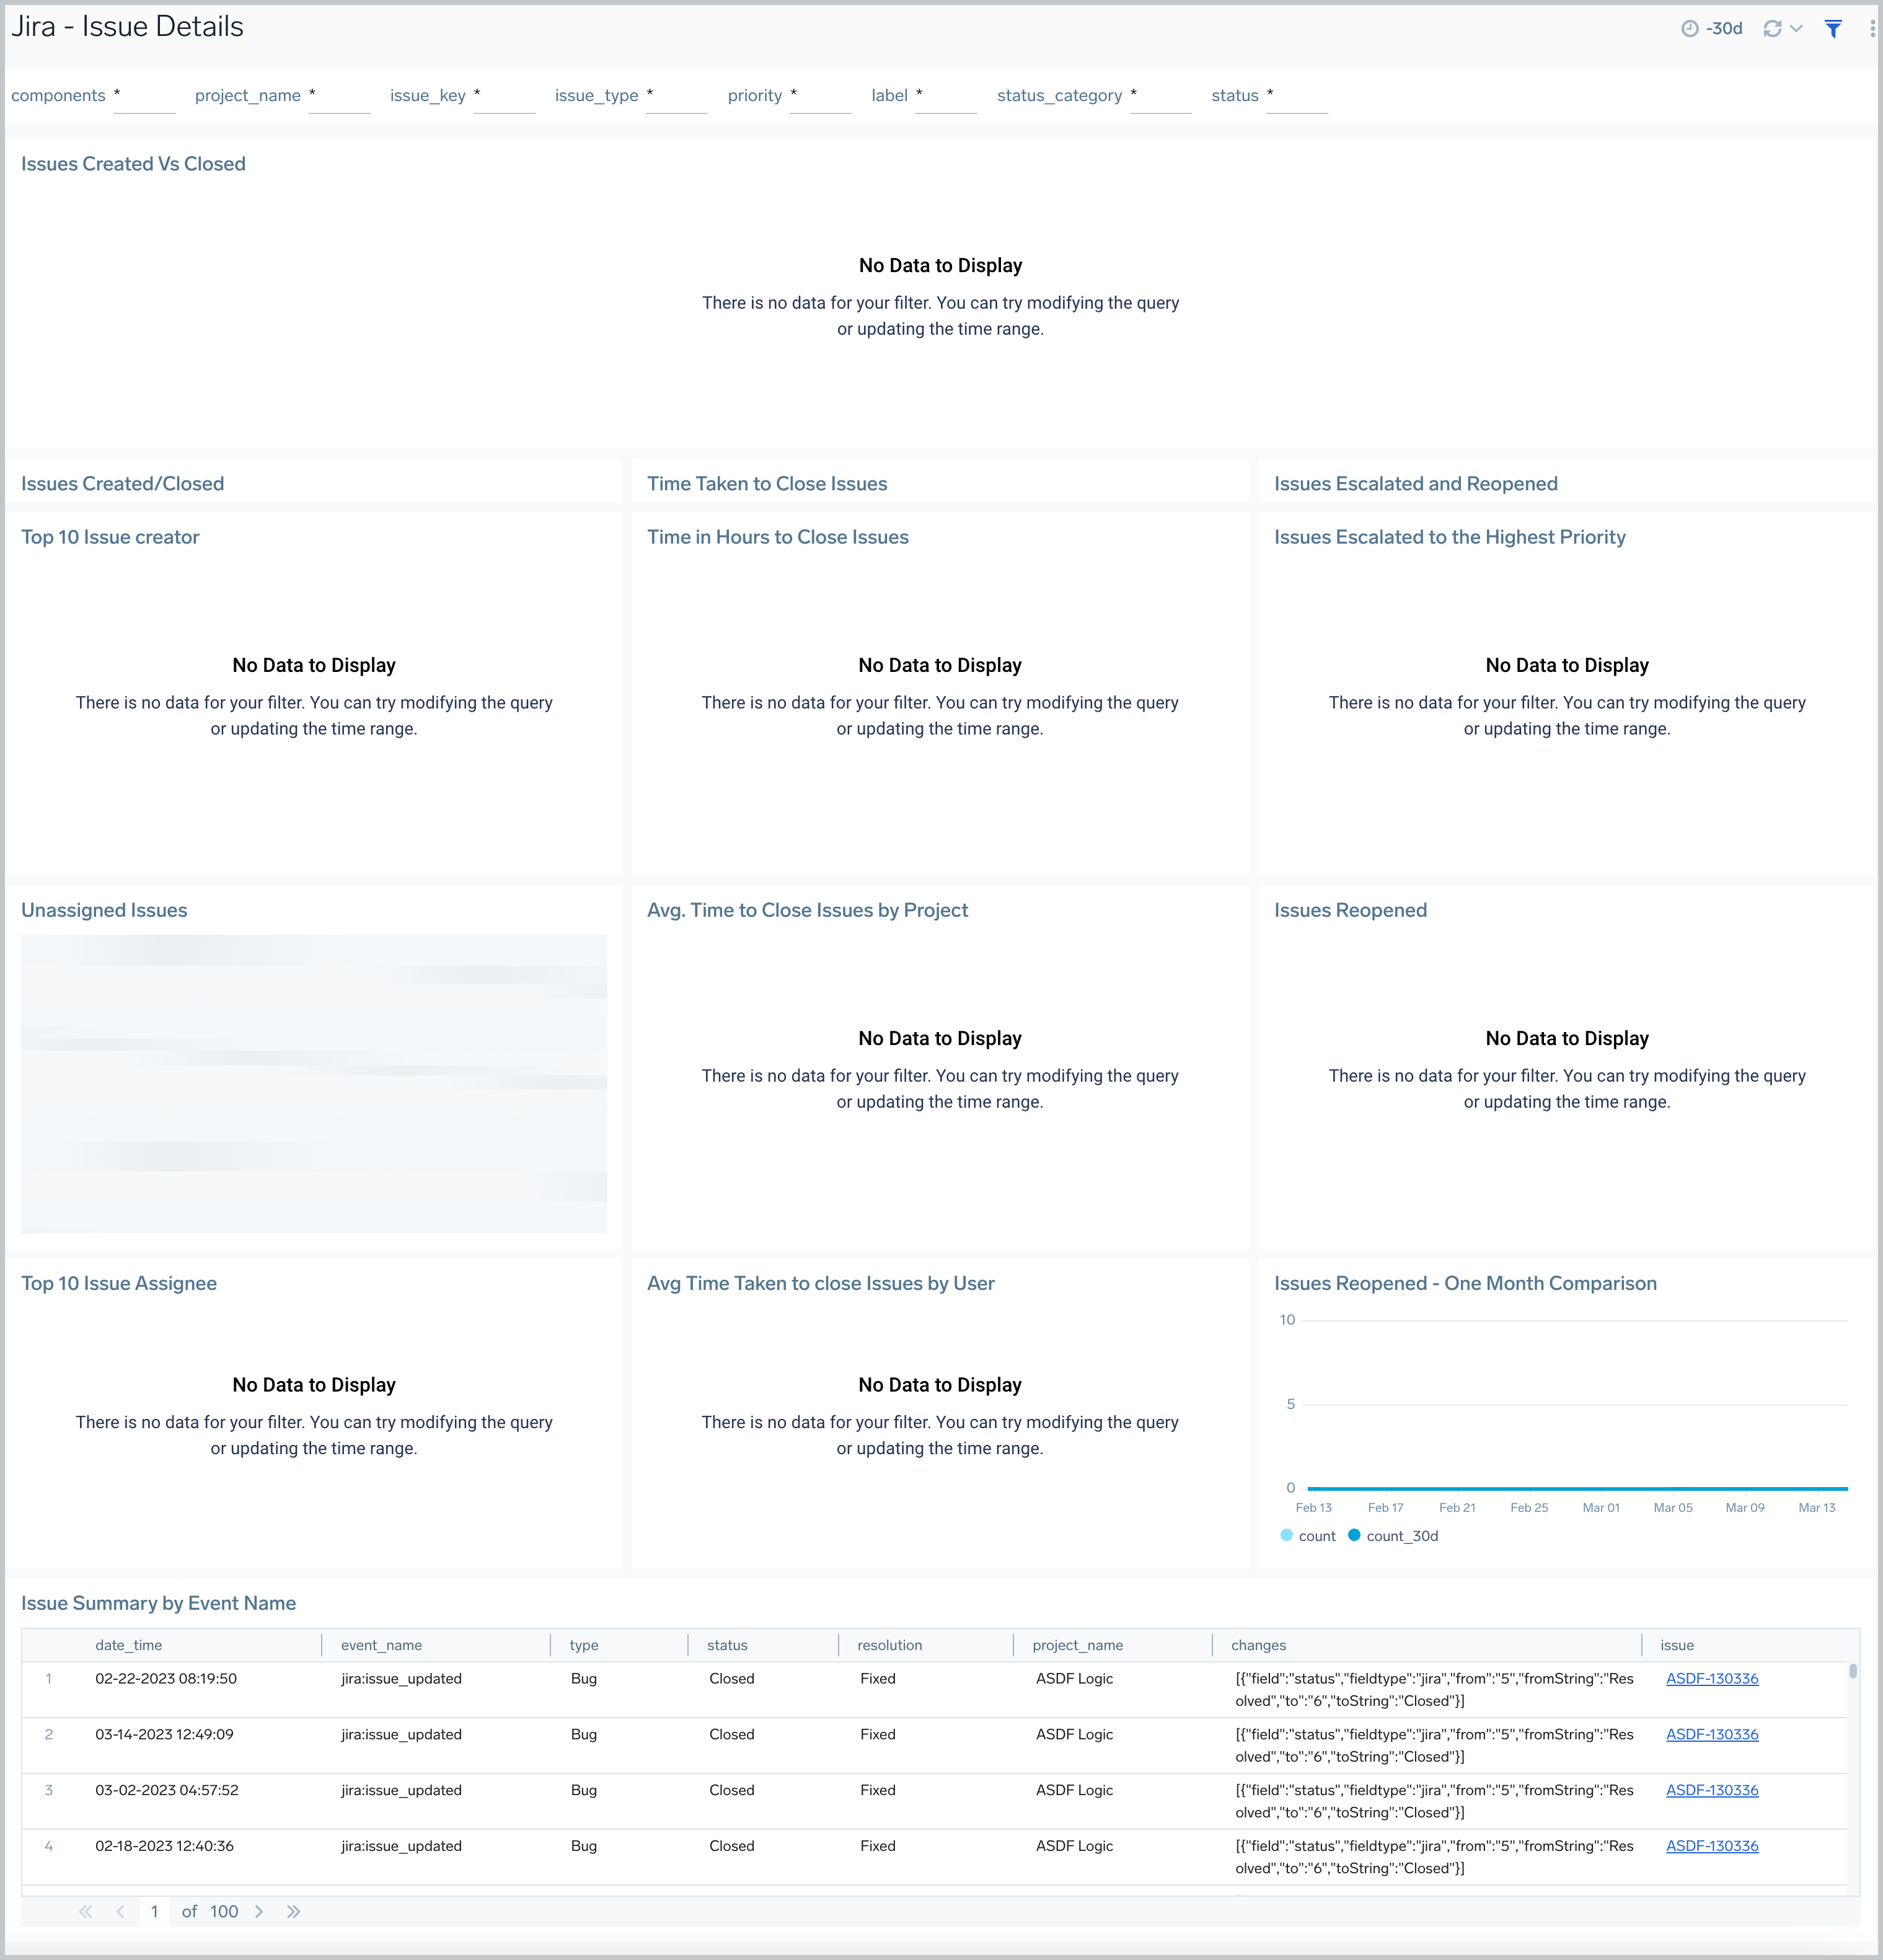
Issue Details
The Jira - Issues Details dashboard provides insights into Jira issues, showing analytics on open, closed, and reopened issues. Panels also display details on issue assignments and escalations and the average time to close issues, allowing you to prioritize and strategize issue management.
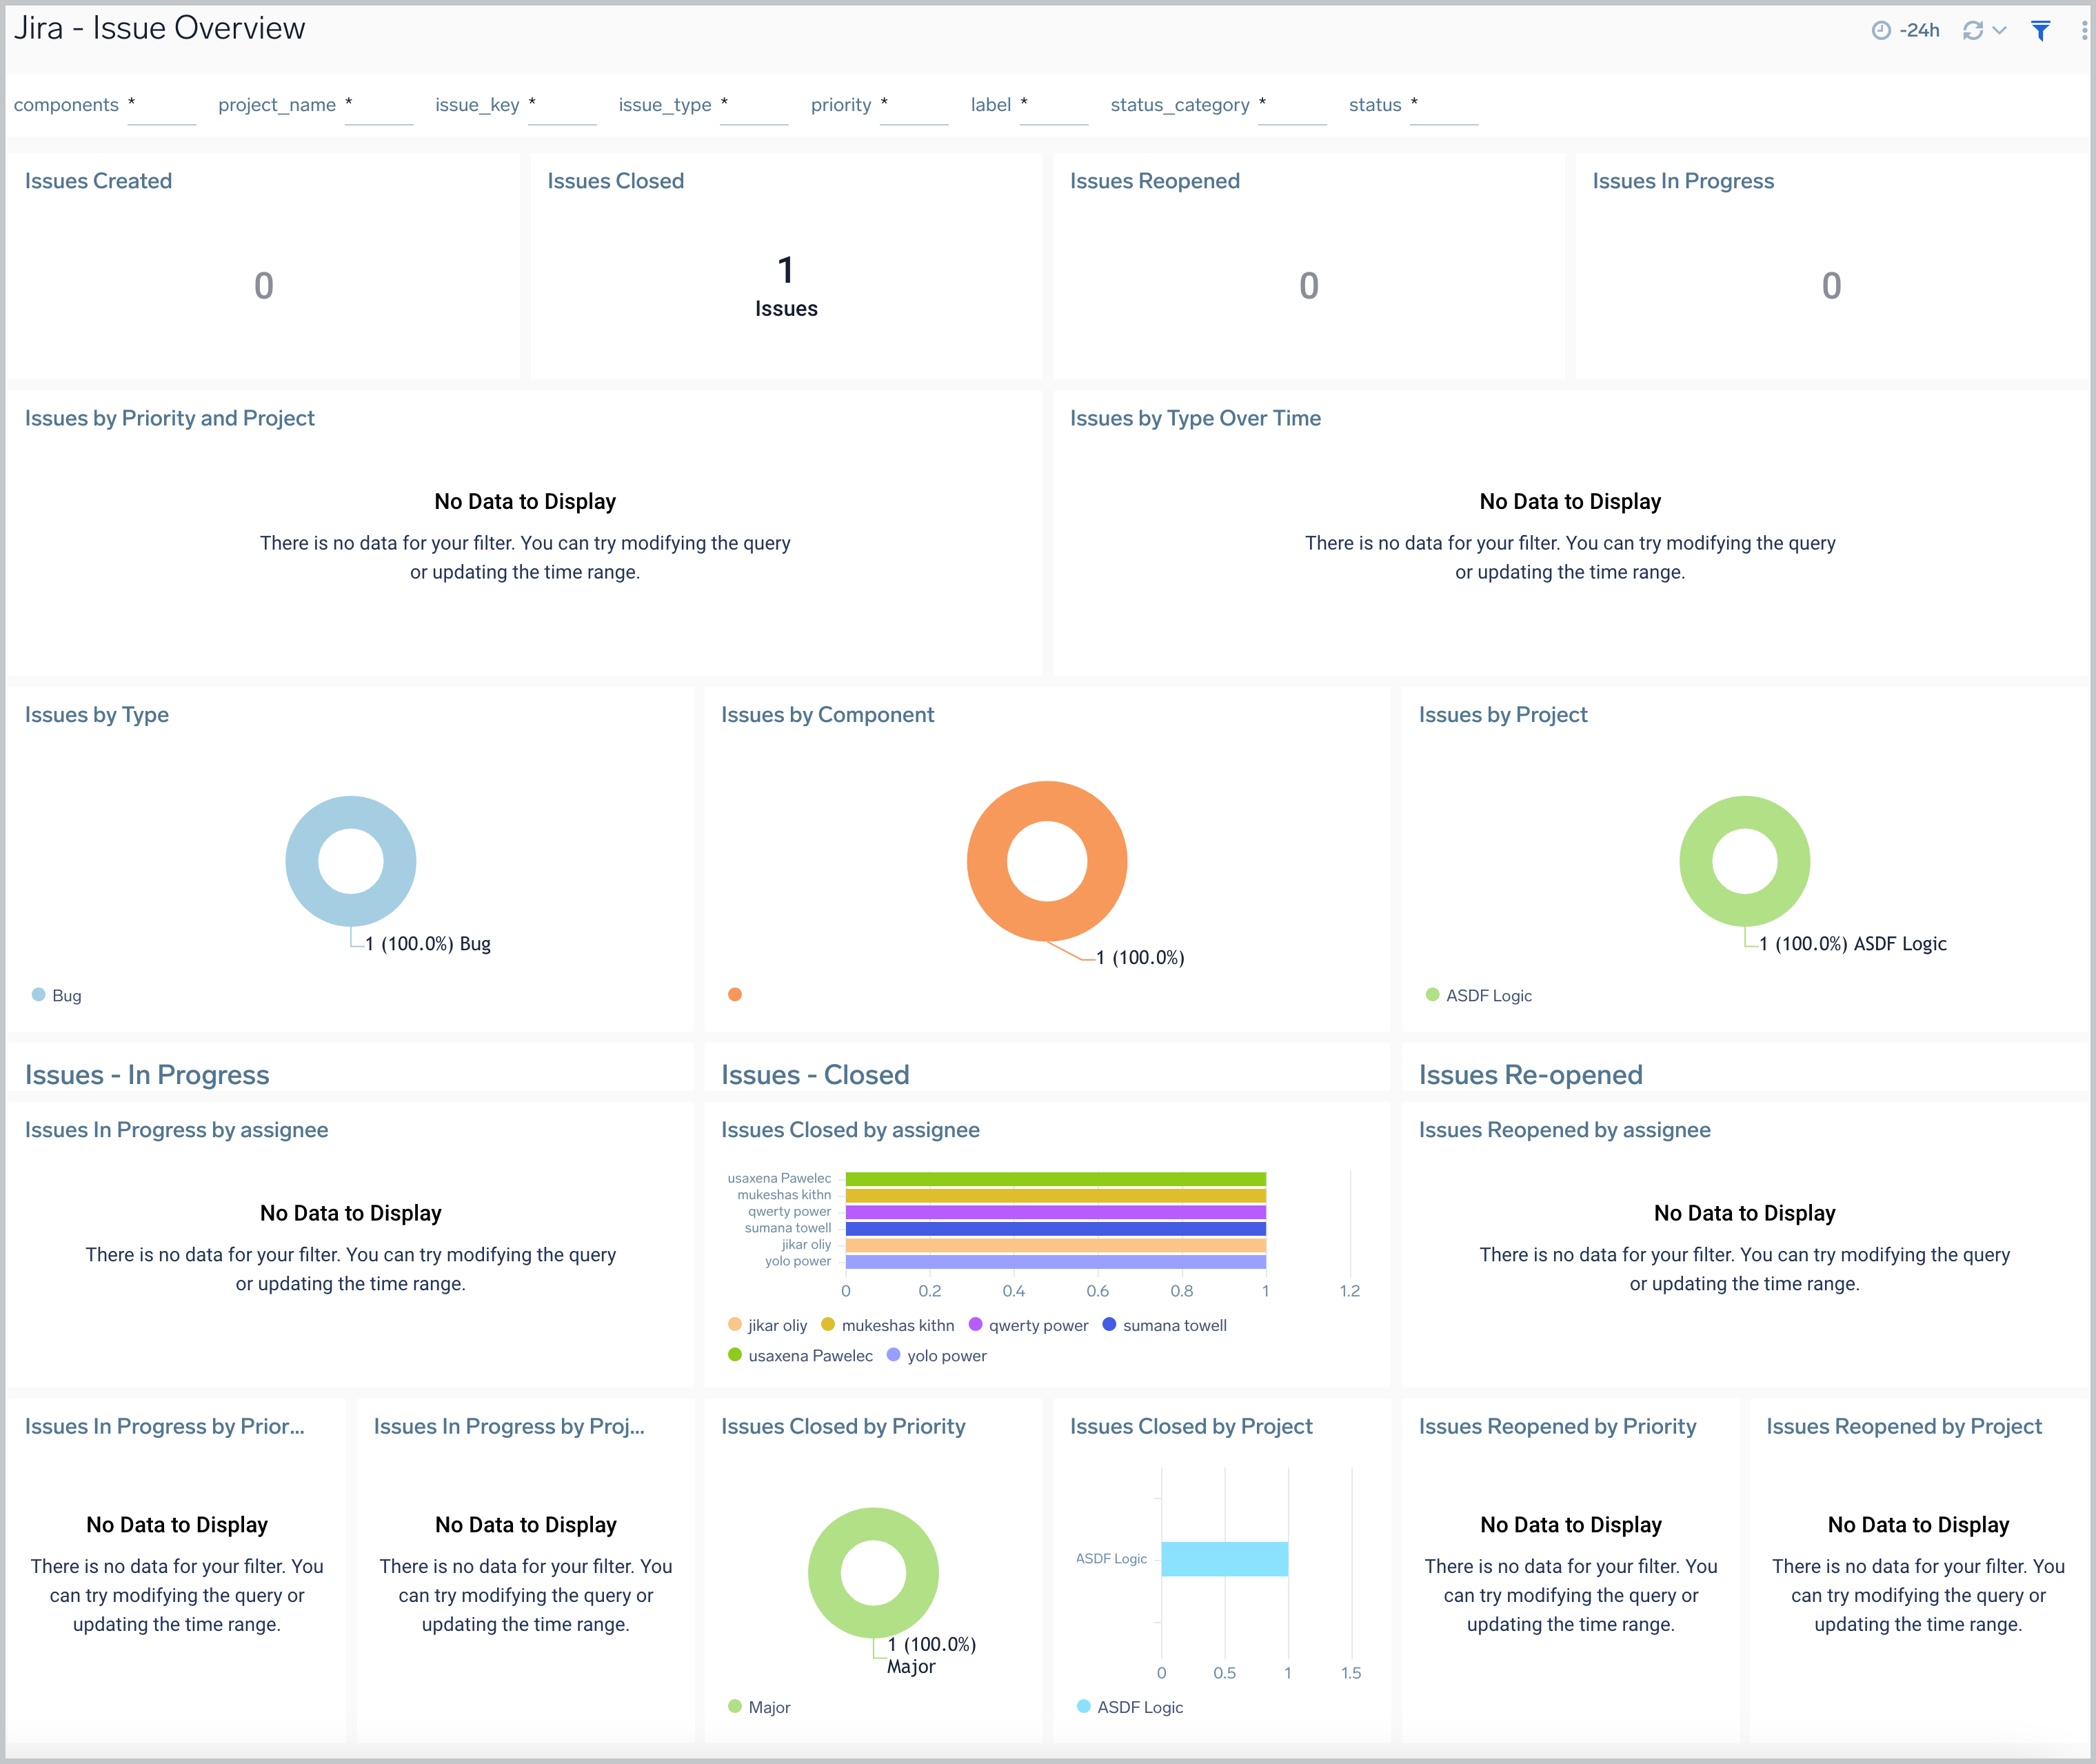
Issue Overview
The Jira - Issue Overview dashboard provides a high-level view of Jira issue activities, so you can monitor work from creation to completion. The panels display analytics for issues that have been created, closed, reopened, and still in progress.
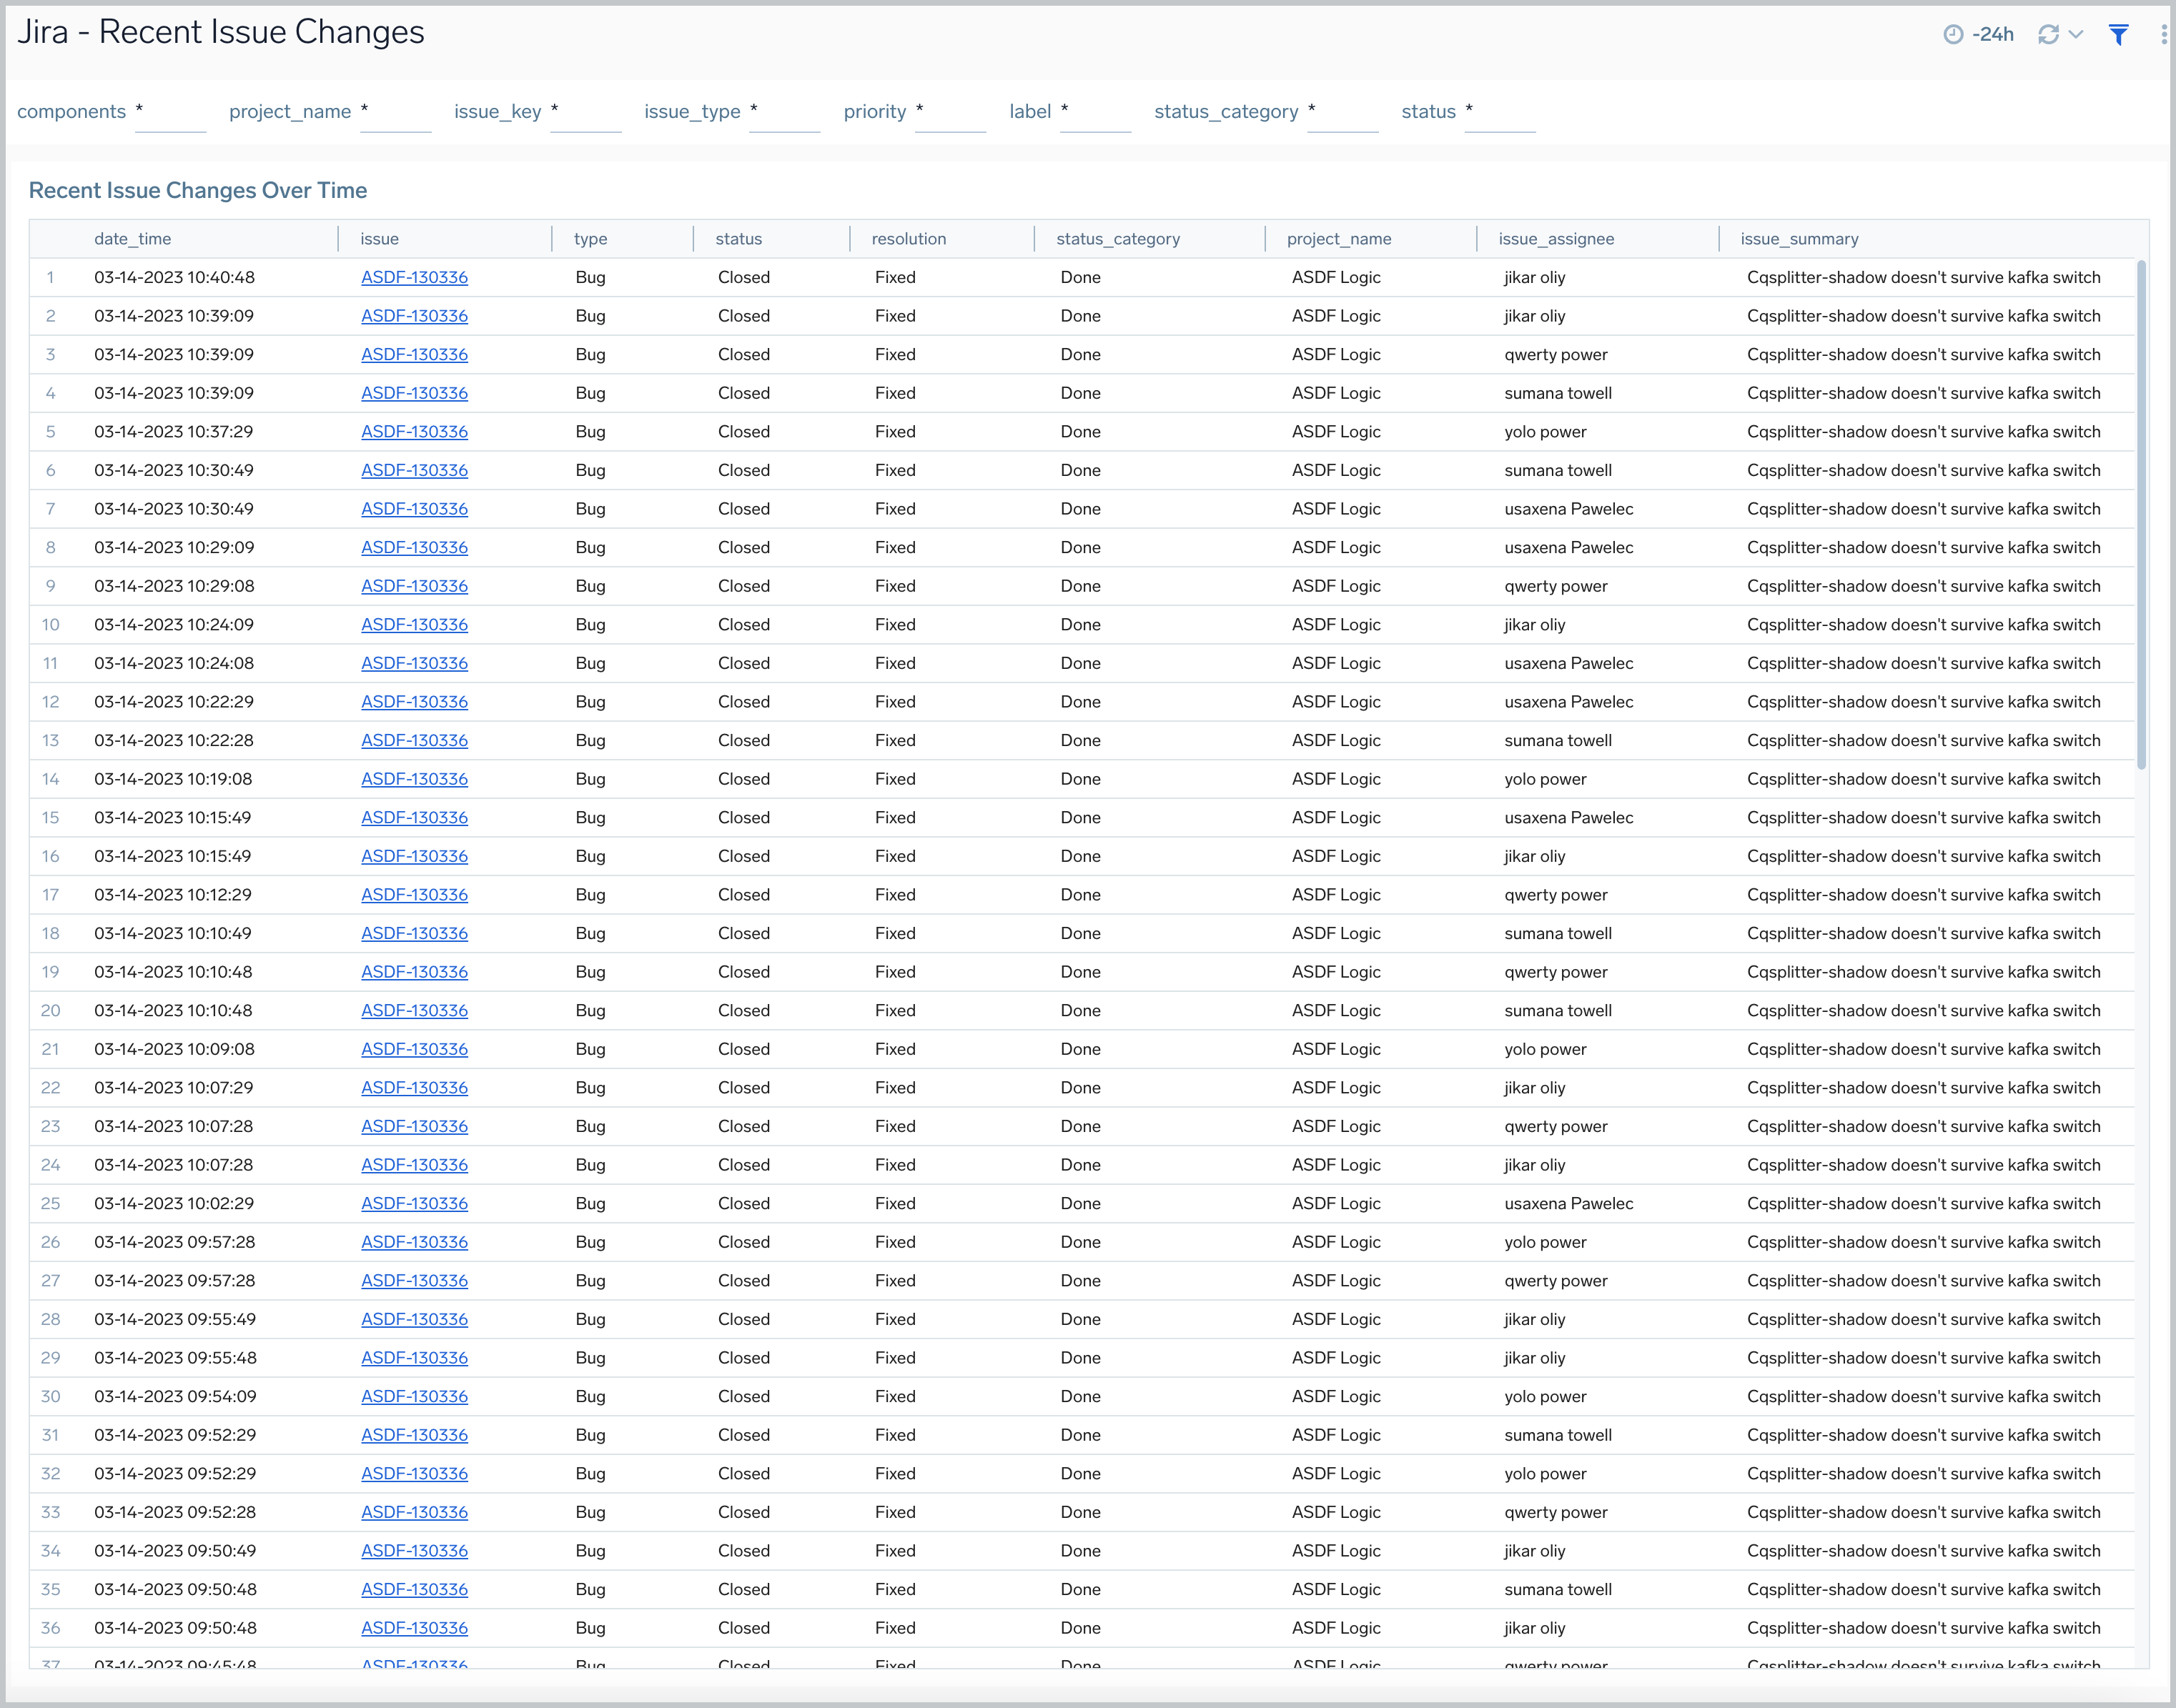
Recent Issue Changes
The Jira - Recent Issue Changes dashboard tracks recent progress of Jira issues. You can view detailed information on the type of issue, including when it was created, its status, assignee, and a summary of the issue.
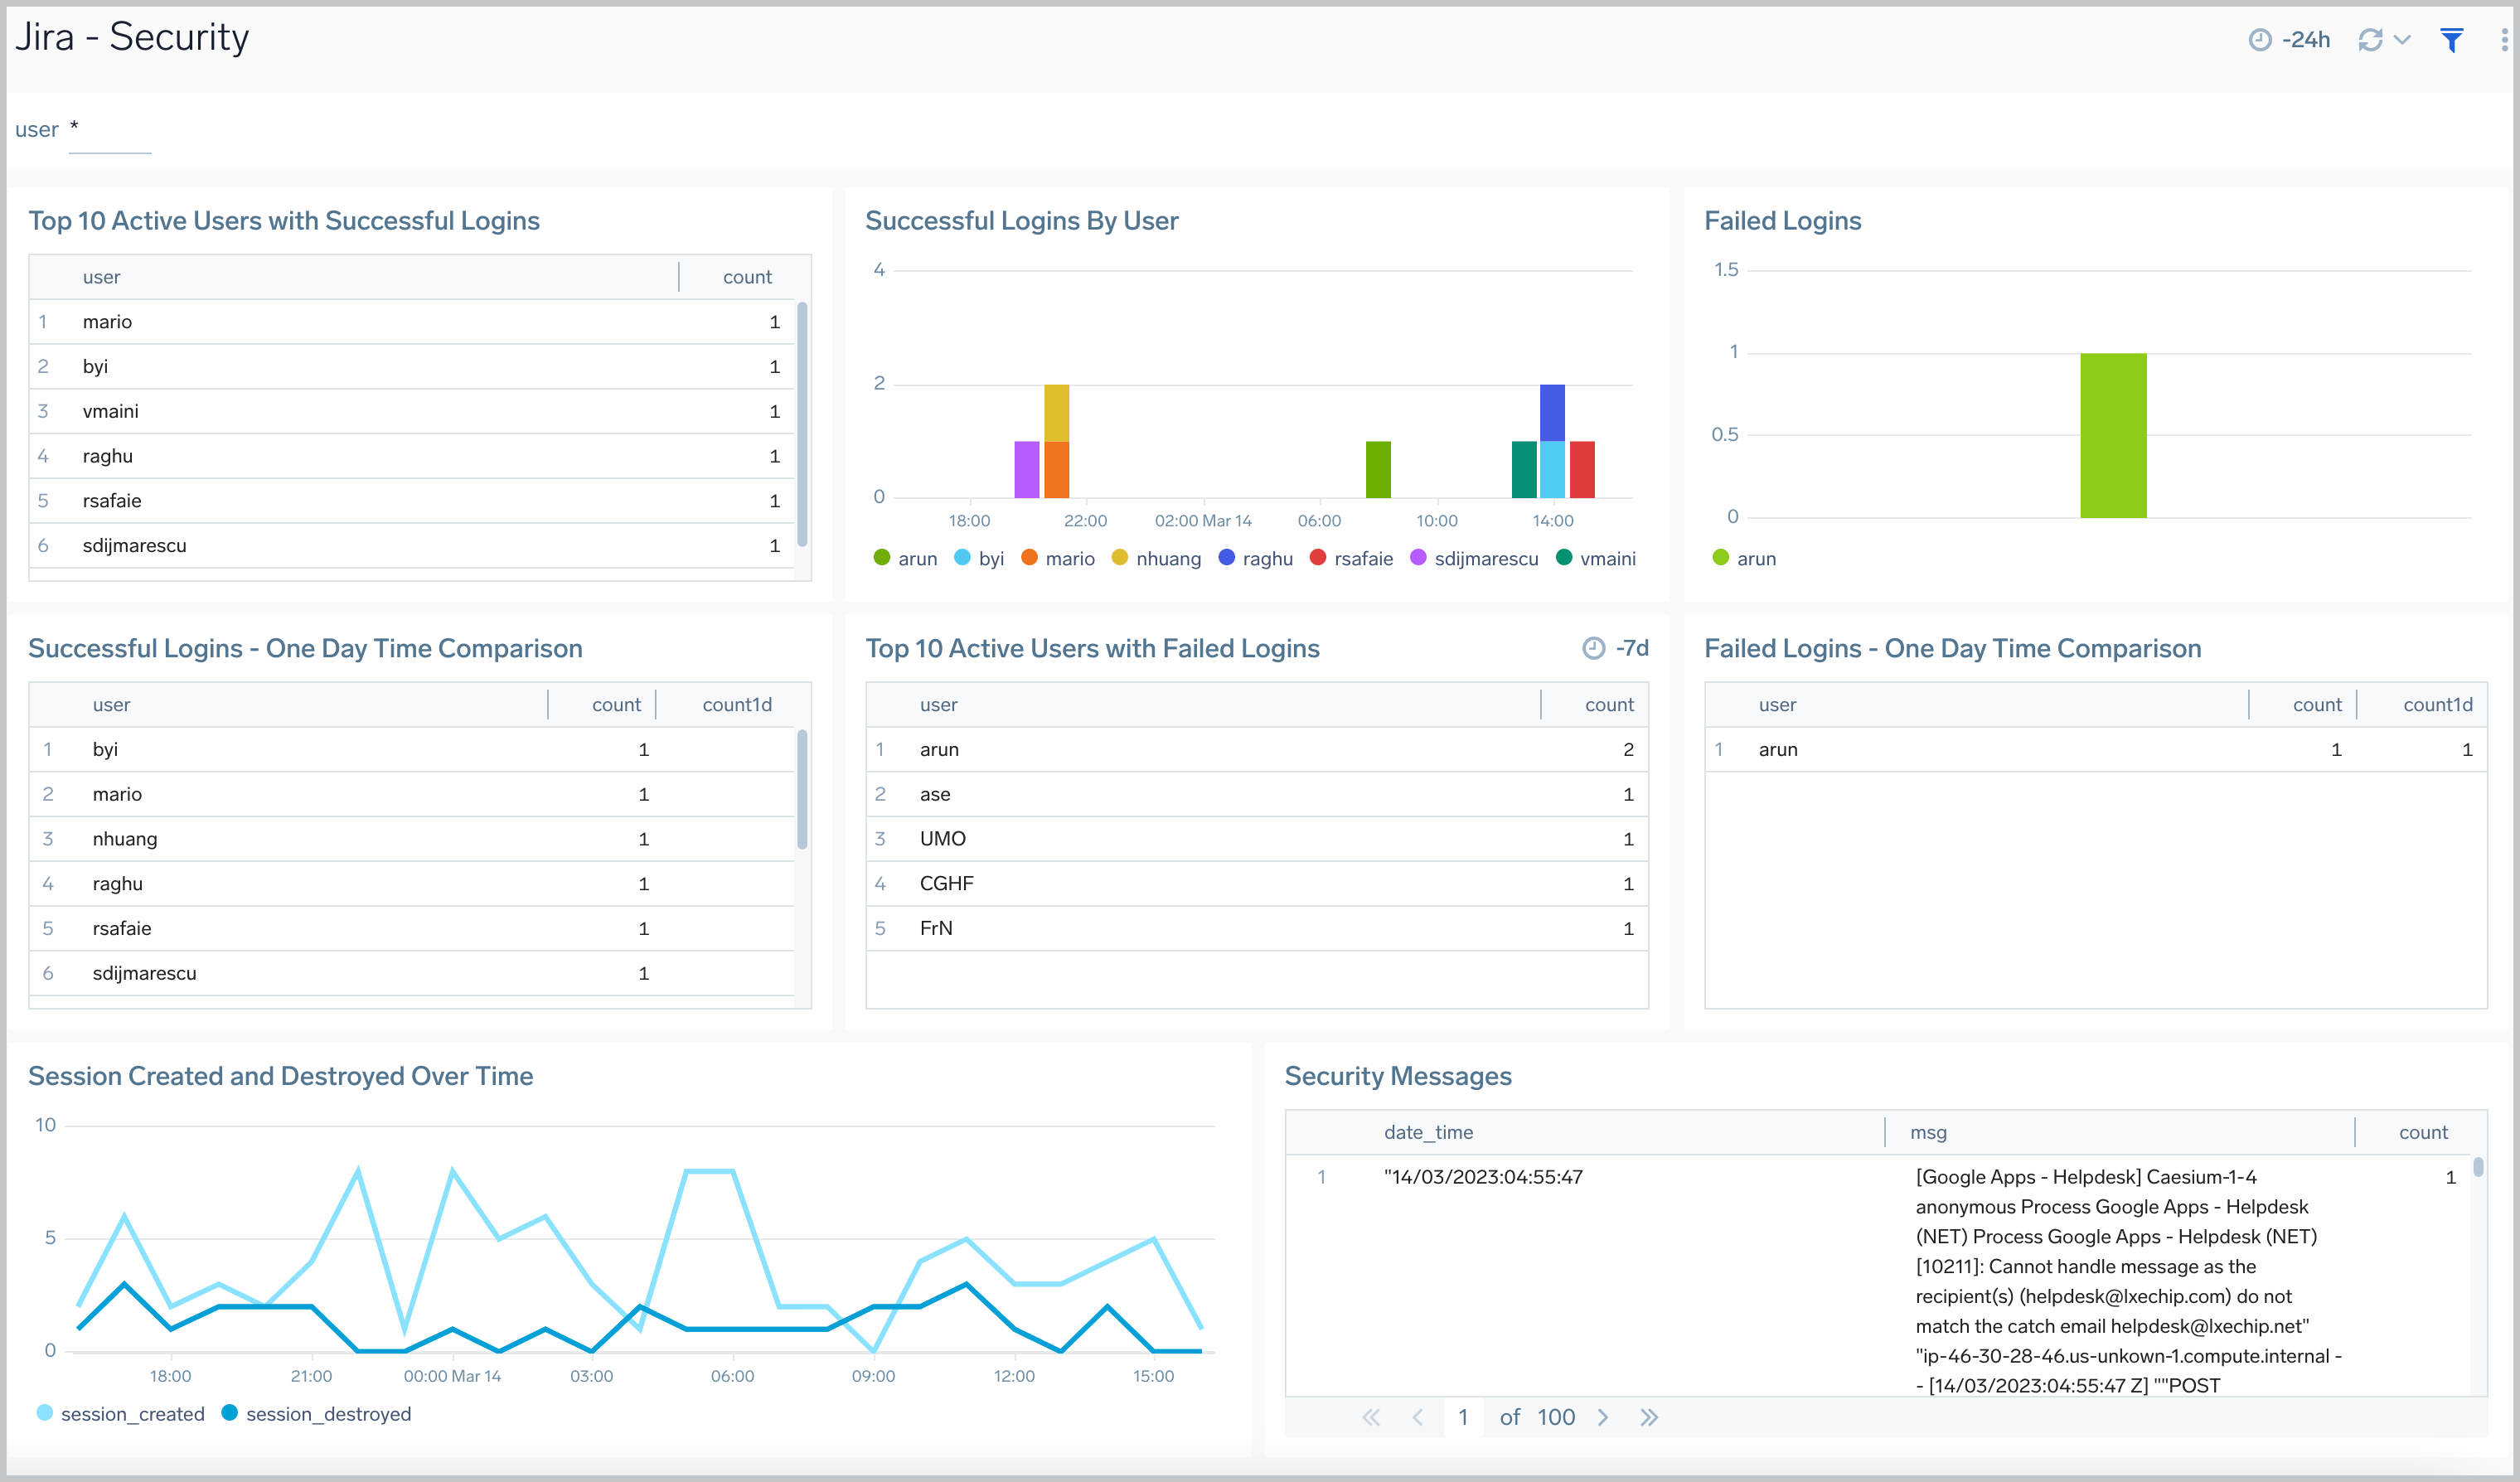
Security
The Jira - Security dashboard provides information on security in Jira. The panels show analytics for the location of successful and failed logins, successful and failed logins for active users, comparisons of successful and failed logins, and session trends.
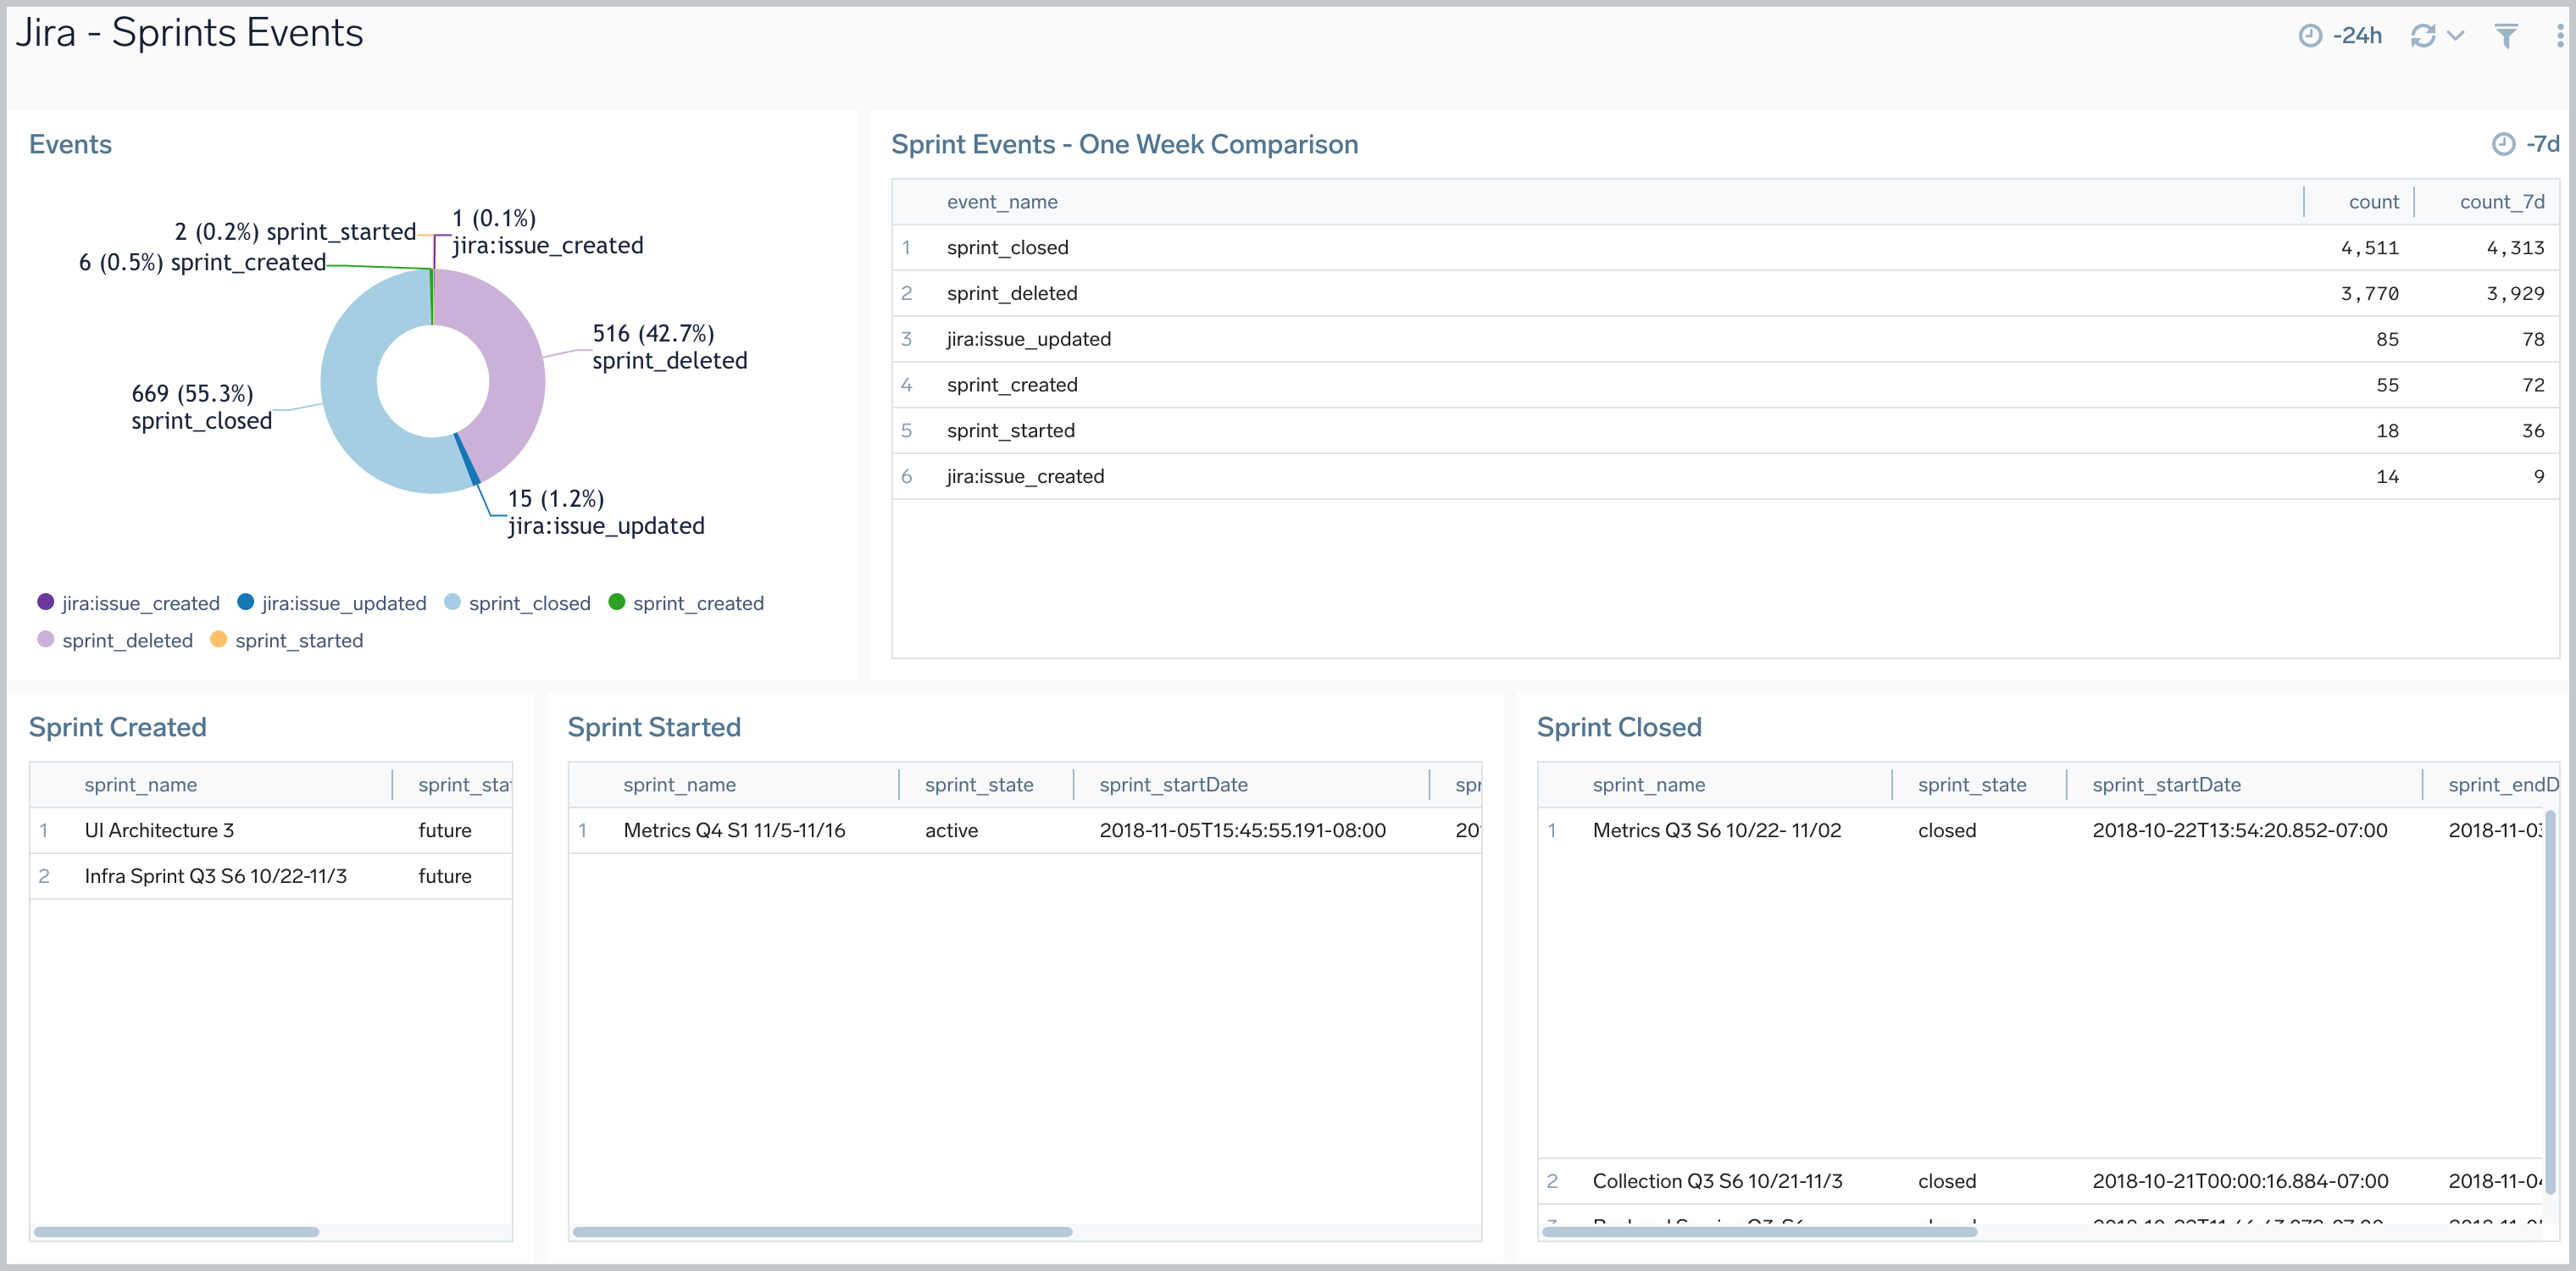
Sprints Events
The Jira - Sprints Events dashboard provides insights on sprint events in Jira, including the number of sprint events, event trends, and sprints closed and created.
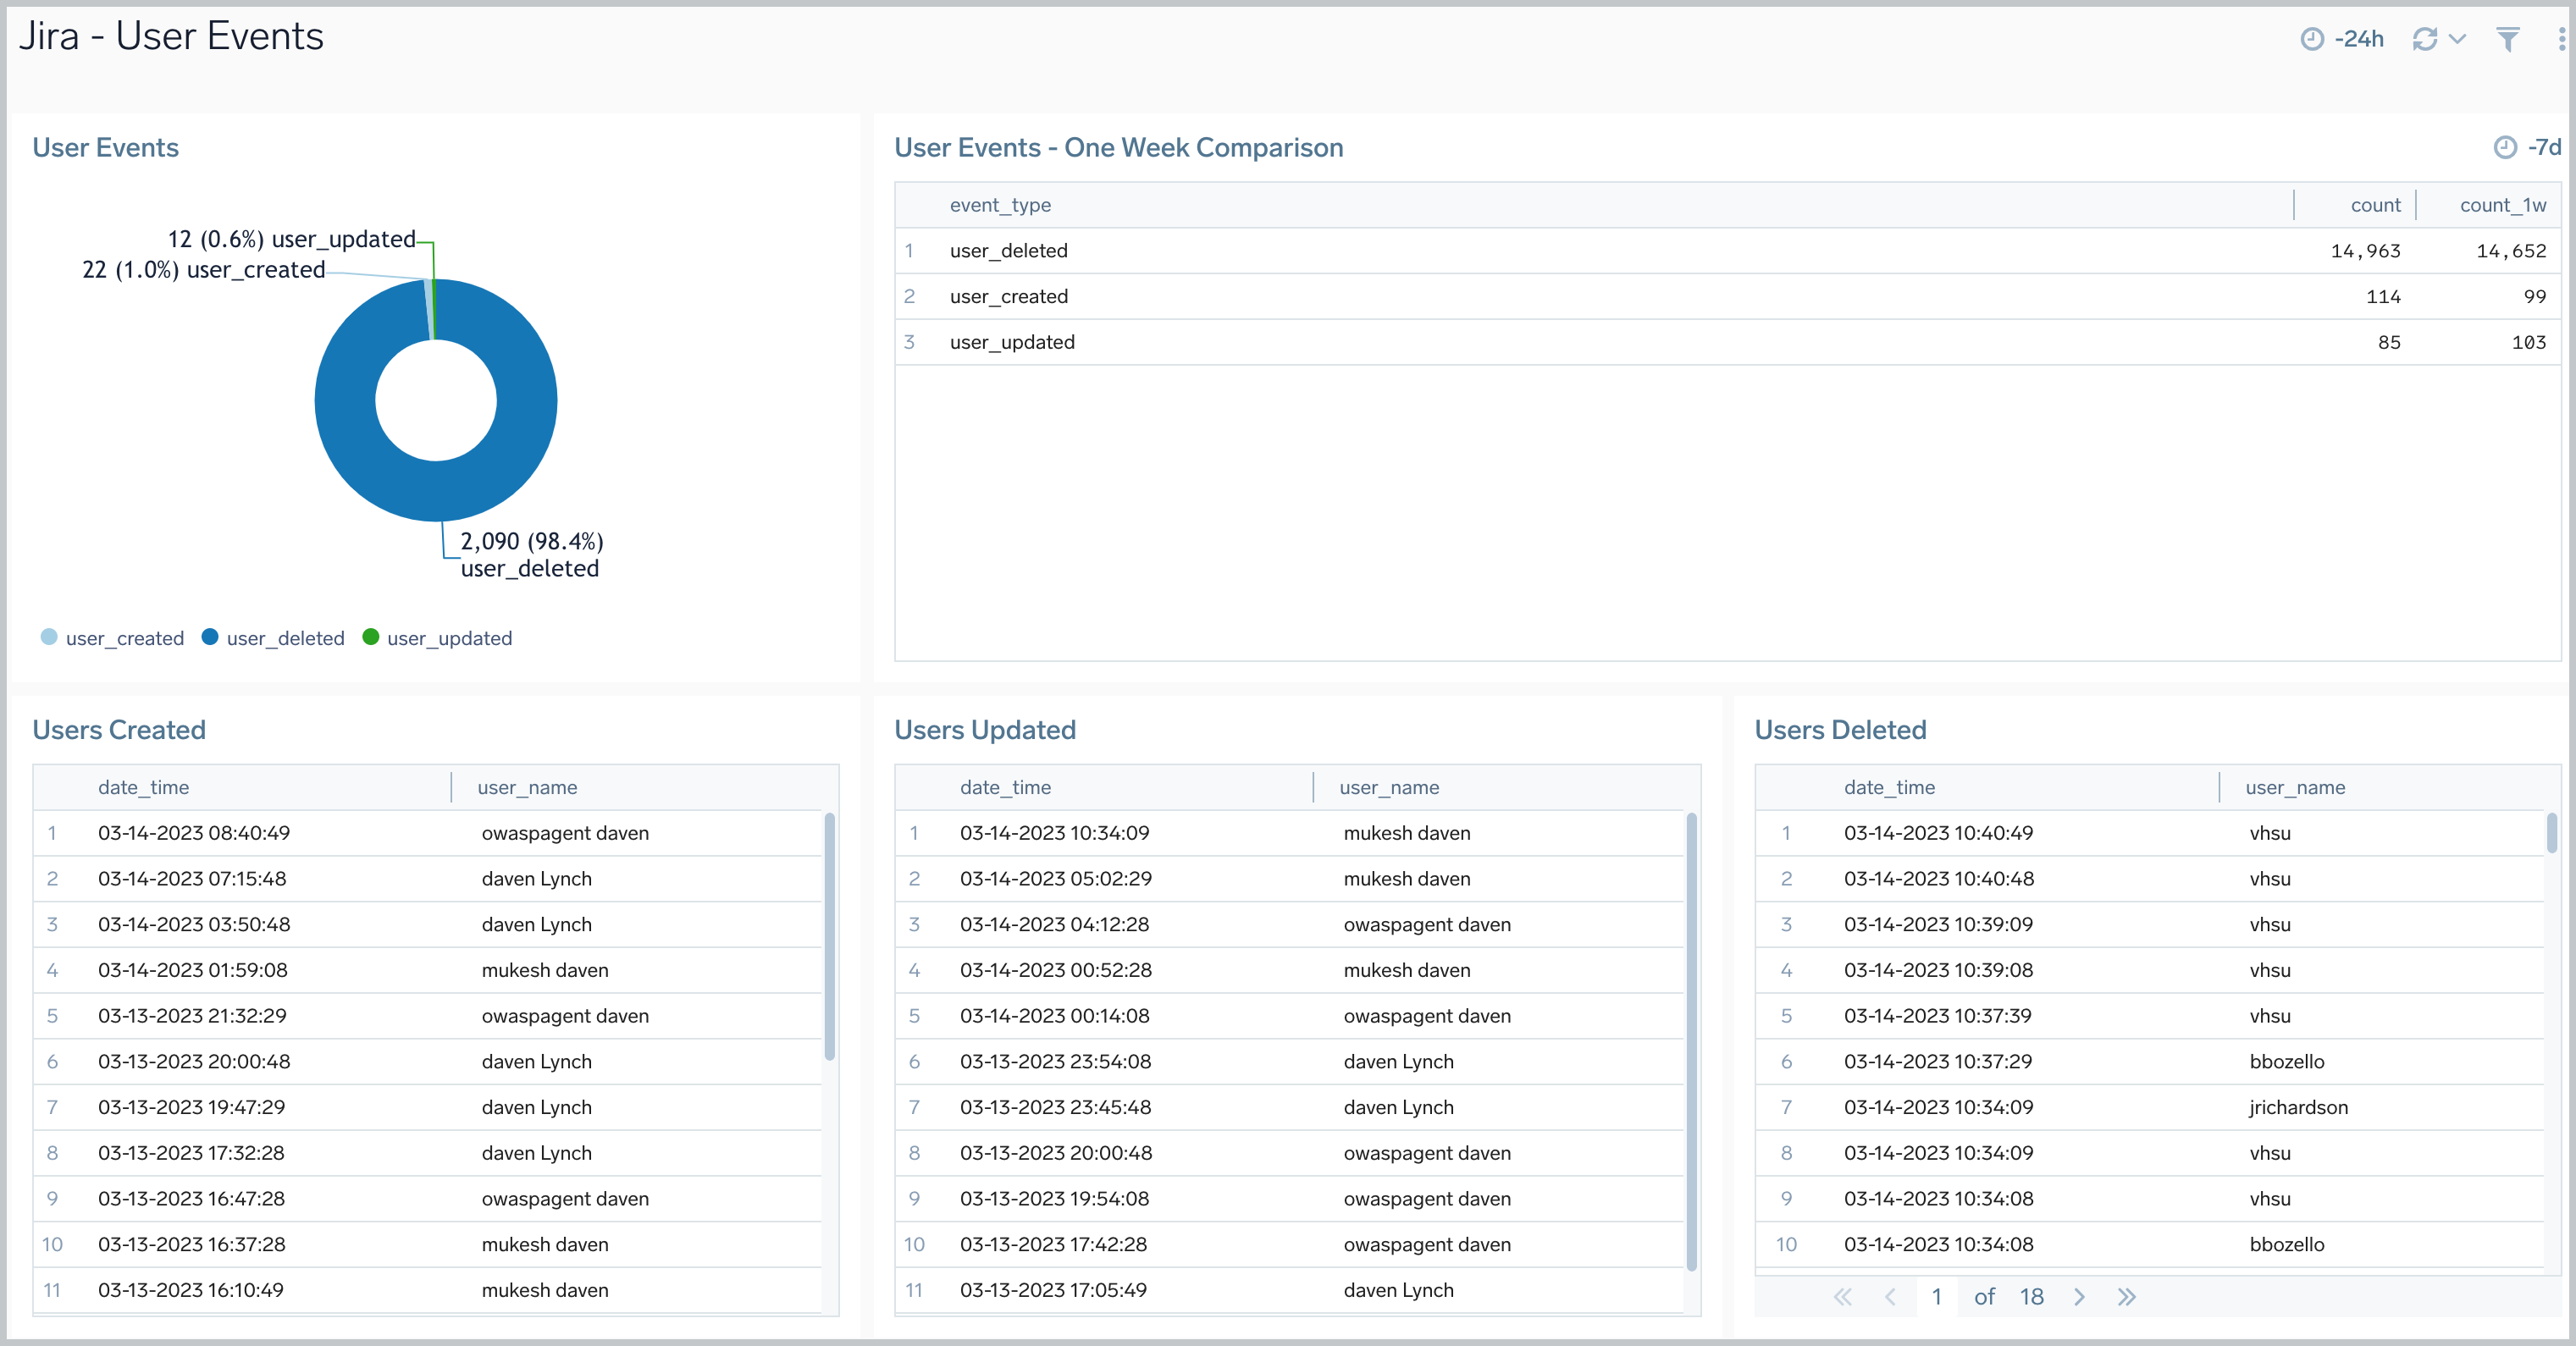
User Events
The Jira - User Events dashboard provides information about user events in Jira, including the number of user events, trends, and users that have been updated, created, and deleted.