Nginx Ingress

The Nginx Ingress app is a unified logs and metrics app that helps you monitor the availability, performance, health, and resource utilization of your Nginx Ingress web servers. Preconfigured dashboards and searches provide insight into connections, requests, ingress controller metrics, visitor locations, visitor access types, traffic patterns, errors, web server operations, and access from known malicious sources.
This app is tested with the following Nginx Ingress versions:
- For Kubernetes environments: Nginx version 1.21.3
Log and Metrics Types
The Sumo Logic app for Nginx Ingress assumes the NCSA extended/combined log file format for Access logs and the default Nginx error log file format for error logs.
All Dashboards (except the Error logs Analysis dashboard) assume the Access log format. The Error logs Analysis Dashboard assumes both Access and Error log formats, so as to correlate information between the two.
For more details on Nginx logs, see Module ngx_http_log_module.
The Sumo Logic app for Nginx Ingress assumes Prometheus format Metrics for Requests, Connections, and Ingress controller.
For more details on Nginx Ingress Metrics, see Prometheus.
Collecting logs and metrics for Nginx Ingress
This section provides instructions for configuring log and metric collection for the Sumo Logic app for Nginx Ingress.
In a Kubernetes environment, we use our Sumo Logic Kubernetes collection. You can learn more about this here.
Configuring log and metric collection for the Nginx Ingress app includes the following tasks:
Step 1: Configure Fields in Sumo Logic
Create the following Fields in Sumo Logic prior to configuring the collection. This ensures that your logs and metrics are tagged with relevant metadata, which is required by the app dashboards. For information on setting up fields, see Sumo Logic Fields.
If you're using Nginx Ingress in a Kubernetes environment, create the fields:
pod_labels_componentpod_labels_environmentpod_labels_webserver_systempod_labels_webserver_farm
Step 2: Configure Nginx Ingress Logs and Metrics Collection
Sumo Logic supports the collection of logs and metrics data from Nginx Ingress in Kubernetes environments.
It’s assumed that you are using the latest helm chart version if not please upgrade using the instructions here.
- Before you can configure Sumo Logic to ingest metrics, you must enable the Prometheus metrics in the Nginx Ingress controller and annotate the Nginx Ingress pods, so Prometheus can find the Nginx Ingress metrics. For instructions on Nginx Open Source, refer to this documentation.
- Ensure you have deployed the Sumologic-Kubernetes-Collection, to send the logs and metrics to Sumologic. For more information on deploying Sumologic-Kubernetes-Collection, visit here. Once deployed, logs will automatically be picked up and sent by default. Prometheus will scrape the Nginx Ingress pods, based on the annotations set in Step 1, for the metrics. Logs and Metrics will automatically be sent to the respective Sumo Logic Distribution for OpenTelemetry Collector instances, which consistently tag your logs and metrics, then forward them to your Sumo Logic org.
- Apply following labels to the Nginx Ingress pod.
environment="prod_CHANGEME"
component="webserver"
  webserver_system="nginx_ingress"
  webserver_farm="<farm_CHANGEME>"
Enter in values for the following parameters (marked in bold and CHANGE_ME above):
environment. This is the deployment environment where the Nginx Ingress farm identified by the value of servers resides. For example:- dev, prod, or QA. While this value is optional we highly recommend setting it.webserver_farm- Enter a name to identify this Nginx Ingress farm. This farm name will be shown in the Sumo Logic dashboards. If you haven’t defined a farm in Nginx Ingress, then enter ‘default’ forwebserver_farm.
Do not modify the following values set by this configuration as it will cause the Sumo Logic app to not function correctly.
component: “webserver”. This value is used by Sumo Logic apps to identify application components.webserver_system: “nginx_ingress”. This value identifies the database system.
- Add an FER to normalize the fields in Kubernetes environments. Labels created in Kubernetes environments automatically are prefixed with
pod_labels. To normalize these for our app to work, we need to create a Field Extraction Rule if not already created for Proxy Application Components. To do so:- In the main Sumo Logic menu, select Manage Data > Logs > Field Extraction Rules.
- Click the + Add button on the top right of the table.
- The Add Field Extraction Rule form will appear. Enter the following options:
- Rule Name. Enter the name as App Observability - Webserver.
- Applied At. Choose Ingest Time.
- Scope. Select Specific Data.
- Scope: Enter the following keyword search expression.
pod_labels_environment=* pod_labels_component=webserver pod_labels_webserver_farm=* pod_labels_webserver_system=*- Parse Expression. Enter the following parse expression.
if (!isEmpty(pod_labels_environment), pod_labels_environment, "") as environment
| pod_labels_component as component
| pod_labels_webserver_system as webserver_system
| pod_labels_webserver_farm as webserver_farm
Installing Nginx Ingress Monitors
After setting up collection, you can proceed to installing the Nginx Ingress monitors, app, and view examples of each of dashboard.
- To install these alerts, you need to have the Manage Monitors role capability.
- Alerts can be installed by either importing a JSON file or a Terraform script.
There are limits to how many alerts can be enabled - for details, see the Alerts FAQ.
Method A: Import a JSON file
- Download the JSON file that describes the monitors.
- The JSON file contains the alerts that are based on Sumo Logic searches that do not have any scope filters and therefore will be applicable to all Nginx Ingress farms, the data for which has been collected via the instructions in the previous sections. However, if you would like to restrict these alerts to specific farms or environments, update the JSON file by replacing the text
webserver_system=nginx_ingresswith<Your Custom Filter>. Custom filter examples:- For alerts applicable only to a specific farm, your custom filter would be:
webserver_farm=nginx-ingress.01 - For alerts applicable to all farms that start with
nginx-ingress, your custom filter would be:webserver_system=nginx-ingress* - For alerts applicable to a specific farm within a production environment, your custom filter would be:
webserver_farm=nginx-ingress-1ANDenvironment=dev(This assumes you have set the optional environment tag while configuring collection)
- For alerts applicable only to a specific farm, your custom filter would be:
- In the main Sumo Logic menu, select Manage Data > Monitoring > Monitors.
- Click Add.
- Click Import and then copy-paste the above JSON to import monitors.
The monitors are disabled by default. Once you have installed the alerts using this method, navigate to the Nginx folder under Monitors to configure them. See this document to enable monitors to send notifications to teams or connections. See the instructions detailed in Step 4 of this document.
Method B: Using a Terraform script
- Generate a Sumo Logic access key and access ID for a user that has the Manage Monitors role capability in Sumo Logic using these instructions. Identify which deployment your Sumo Logic account is in, using this link.
- Download and install Terraform 0.13 or later.
- Download the Sumo Logic Terraform package for Nginx Ingress alerts: The alerts package is available in the Sumo Logic GitHub repository. You can either download it through the “git clone” command or as a zip file.
- Alert Configuration: After the package has been extracted, navigate to the package directory terraform-sumologic-sumo-logic-monitor/monitor_packages/Nginx Ingress.
- Edit the nginx_ingress.auto.tfvars file and add the Sumo Logic Access Key, Access Id and Deployment from Step 1.
The Terraform script installs the alerts without any scope filters, if you would like to restrict the alerts to specific farms or environments, update the variableaccess_id = "<SUMOLOGIC ACCESS ID>"
access_key = "<SUMOLOGIC ACCESS KEY>"
environment = "<SUMOLOGIC DEPLOYMENT>"nginx_ingress_data_source. Custom filter examples:- A specific farm
webserver_farm=nginx.ingress.01. - All farms in an environment
environment=dev. - For alerts applicable to all farms that start with nginx ingress, your custom filter would be:
webserver_farm=nginx-ingress* - For alerts applicable to a specific farm within a production environment, your custom filter would be:
webserver_system=nginx_ingress-1andenvironment=dev(This assumes you have set the optional environment tag while configuring collection)
All monitors are disabled by default on installation, if you would like to enable all the monitors, set the parameter monitors_disabled to false in this file.
By default, the monitors are configured in a monitor folder called “Nginx Ingress”, if you would like to change the name of the folder, update the monitor folder name in “folder” key at nginx_ingress.auto.tfvars file.
- If you would like the alerts to send email or connection notifications, modify the file nginx_ingress_notifications.auto.tfvars and populate
connection_notificationsandemail_notificationsas per below examples.
connection_notifications = [
    {
      connection_type       = "PagerDuty",
      connection_id         = "<CONNECTION_ID>",
      payload_override      = "{\"service_key\": \"your_pagerduty_api_integration_key\",\"event_type\": \"trigger\",\"description\": \"Alert: Triggered {{TriggerType}} for Monitor {{Name}}\",\"client\": \"Sumo Logic\",\"client_url\": \"{{QueryUrl}}\"}",
      run_for_trigger_types = ["Critical", "ResolvedCritical"]
    },
    {
      connection_type       = "Webhook",
      connection_id         = "<CONNECTION_ID>",
      payload_override      = "",
      run_for_trigger_types = ["Critical", "ResolvedCritical"]
    }
  ]
Replace <CONNECTION_ID> with the connection id of the webhook connection. The webhook connection id can be retrieved by calling the Monitors API.
For overriding payload for different connection types, refer to this document.
email_notifications = [
    {
      connection_type       = "Email",
      recipients            = ["abc@example.com"],
      subject               = "Monitor Alert: {{TriggerType}} on {{Name}}",
      time_zone             = "PST",
      message_body          = "Triggered {{TriggerType}} Alert on {{Name}}: {{QueryURL}}",
      run_for_trigger_types = ["Critical", "ResolvedCritical"]
    }
      ]
- Install the Alerts.
- Navigate to the package directory
terraform-sumologic-sumo-logic-monitor/monitor_packages/**Nginx Ingress**/and runterraform init. This will initialize Terraform and will download the required components. - Run
terraform planto view the monitors which will be created/modified by Terraform. - Run
terraform apply.
- Navigate to the package directory
- Post Installation If you haven’t enabled alerts and/or configured notifications through the Terraform procedure outlined above, we highly recommend enabling alerts of interest and configuring each enabled alert to send notifications to other users or services. This is detailed in Step 4 of this document.
Installing the Nginx Ingress app
This section demonstrates how to install the Nginx Ingress app. These instructions assume you have already set up the collection as described above.
To install the app:
Locate and install the app you need from the App Catalog. If you want to see a preview of the dashboards included with the app before installing, click Preview Dashboards.
- From the App Catalog, search for and select the app.
- Select the version of the service you're using and click Add to Library.
- To install the app, complete the following fields.
- App Name. You can retain the existing name, or enter a name of your choice for the app.
- Data Source.
- Choose Enter a Custom Data Filter, and enter a custom Nginx Ingress farm filter. Examples:
- For all Nginx Ingress farms:
webserver_farm=*. - For a specific farm:
webserver_farm=nginx-ingress.dev.01. - Farms within a specific environment:
webserver_farm=nginx-ingress.dev.01andenvironment=prod(This assumes you have set the optional environment tag while configuring collection). - Advanced. Select the Location in Library (the default is the Personal folder in the library), or click New Folder to add a new folder.
- For all Nginx Ingress farms:
- Click Add to Library.
Once an app is installed, it will appear in your Personal folder, or another folder that you specified. From here, you can share it with your organization.
Panels will start to fill automatically. It's important to note that each panel slowly fills with data matching the time range query and received since the panel was created. Results won't immediately be available, but with a bit of time, you'll see full graphs and maps.
Viewing Nginx Ingress dashboards
Template variables provide dynamic dashboards that can rescope data on the fly. As you apply variables to troubleshoot through your dashboard, you view dynamic changes to the data for a quicker resolution to the root cause. You can use template variables to drill down and examine the data on a granular level. For more information, see Filter with template variables.
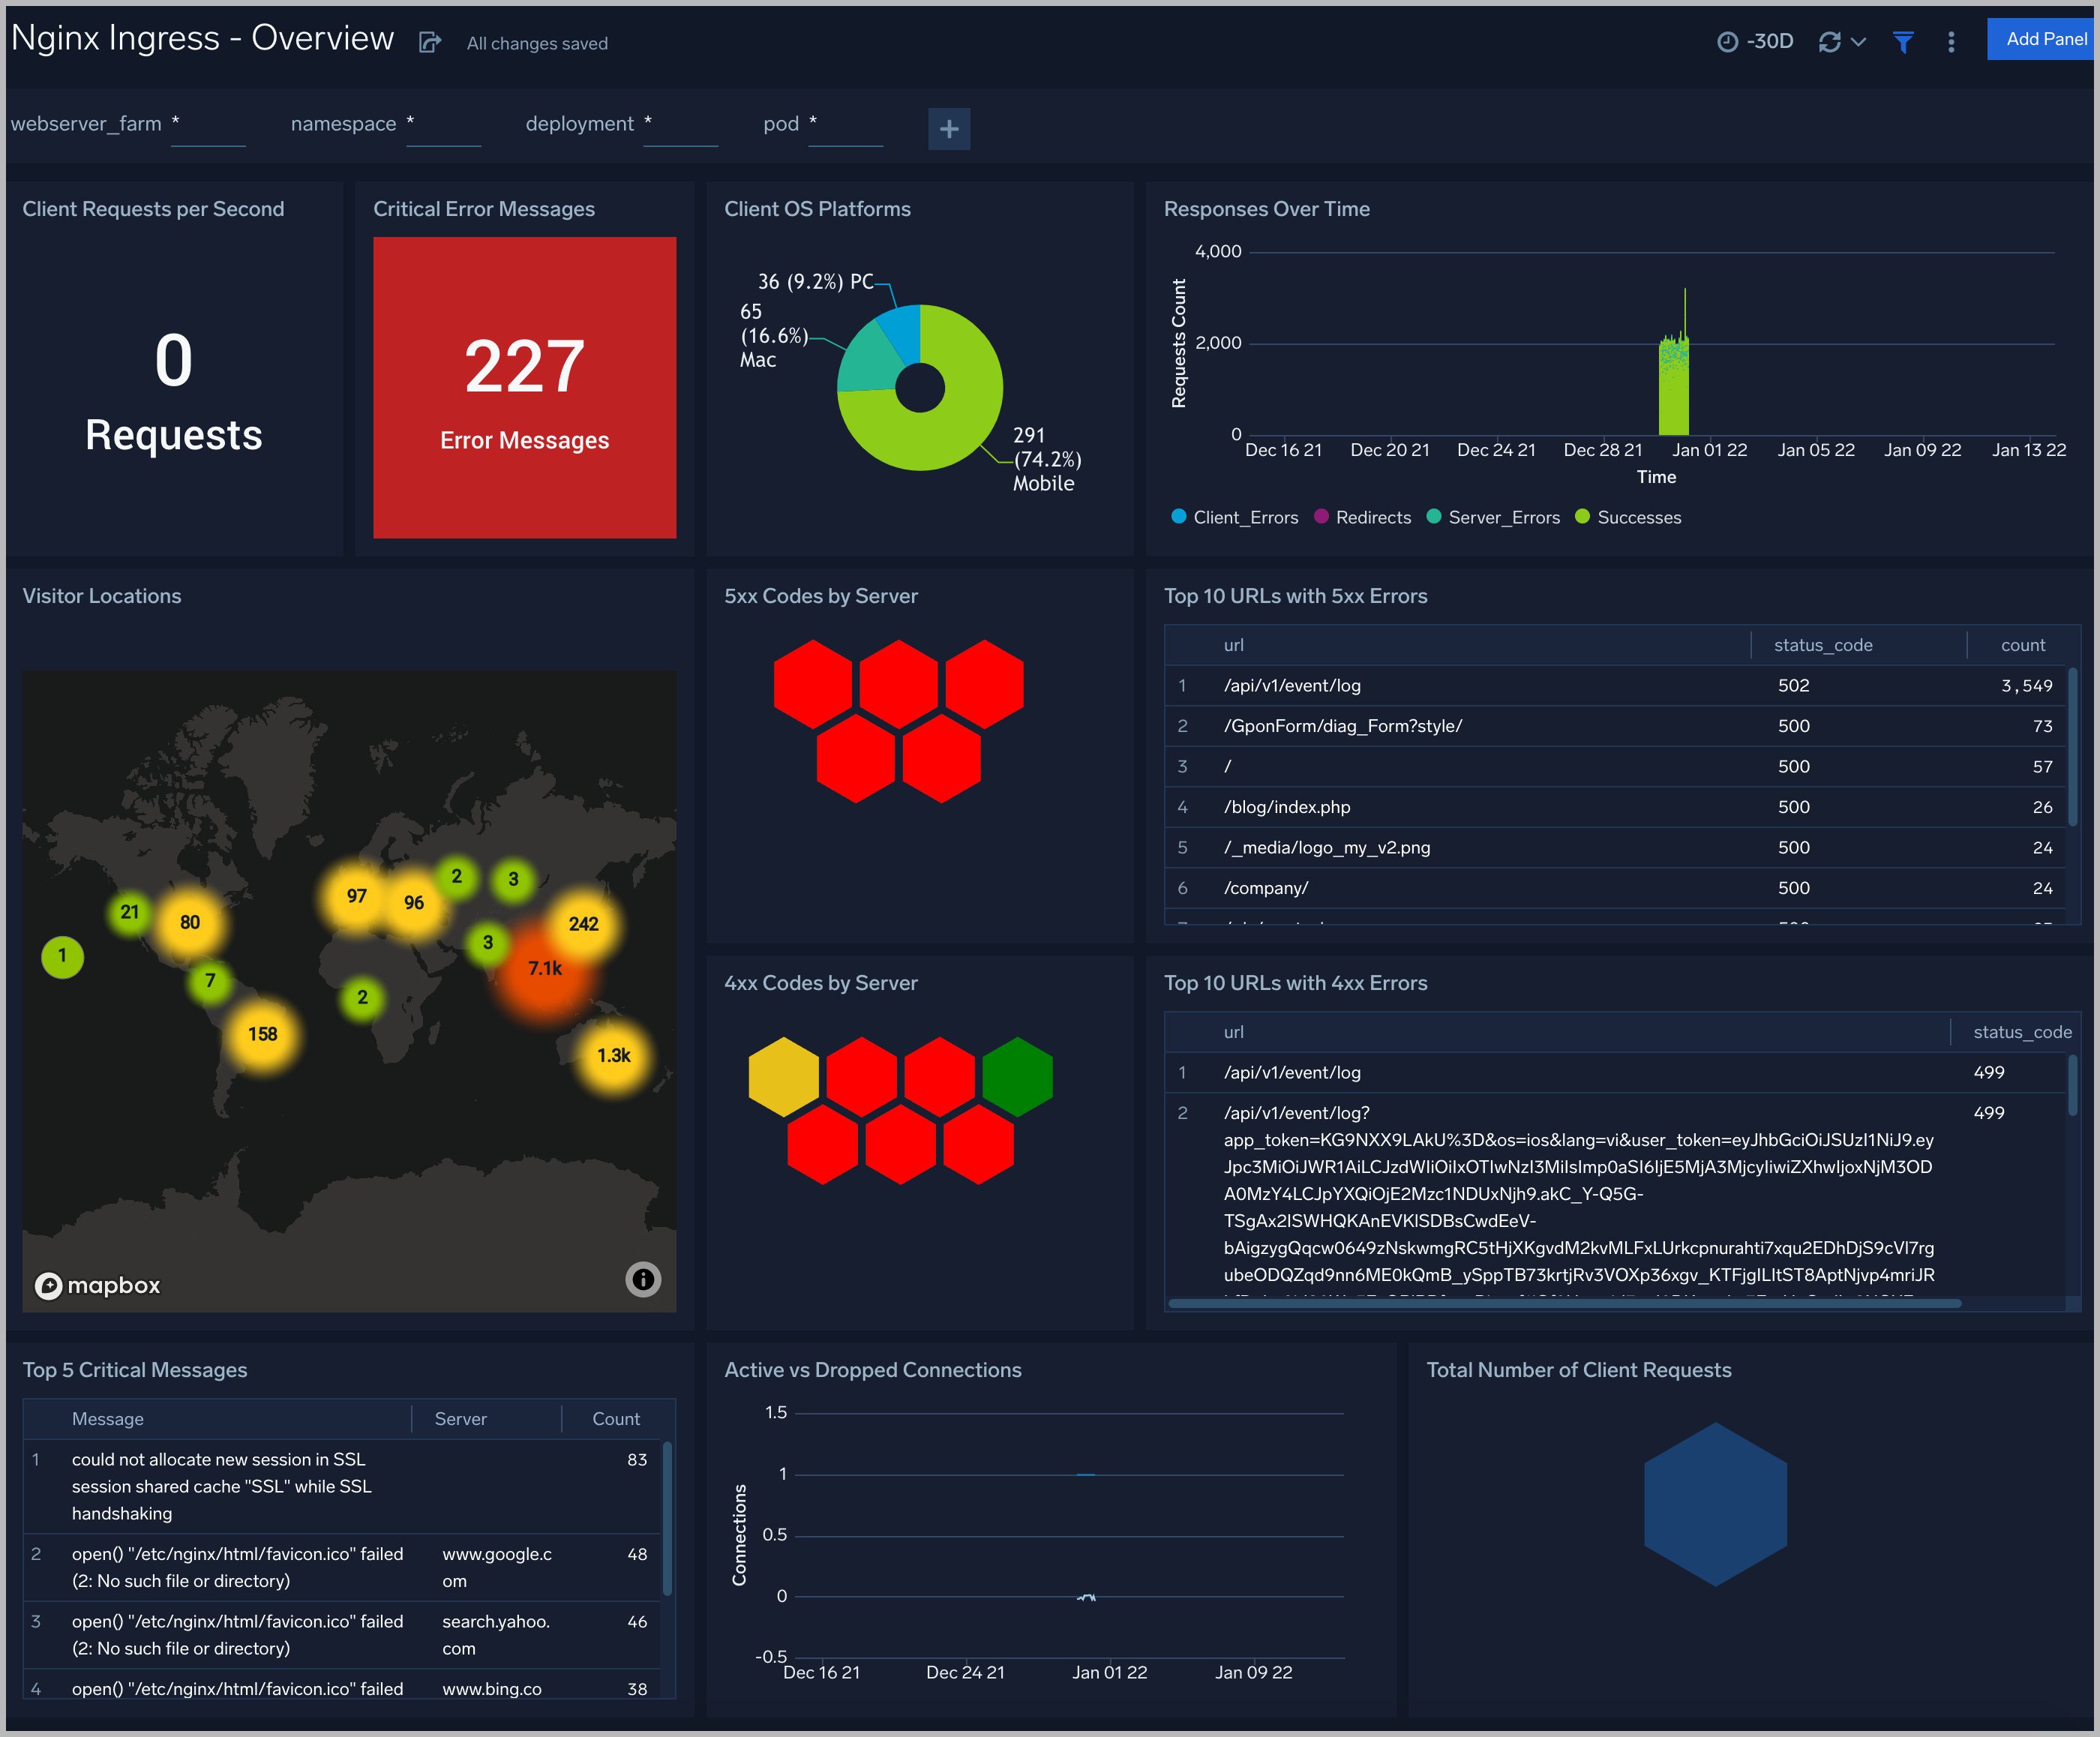
Overview
The Nginx Ingress - Overview dashboard provides an at-a-glance view of the NGINX server access locations, error logs along with connection metrics.
Use this dashboard to:
- Gain insights into originated traffic location by region. This can help you allocate computer resources to different regions according to their needs.
- Gain insights into your Nginx health using Critical Errors and Status of Nginx Server.
- Get insights into Active and dropped connection.
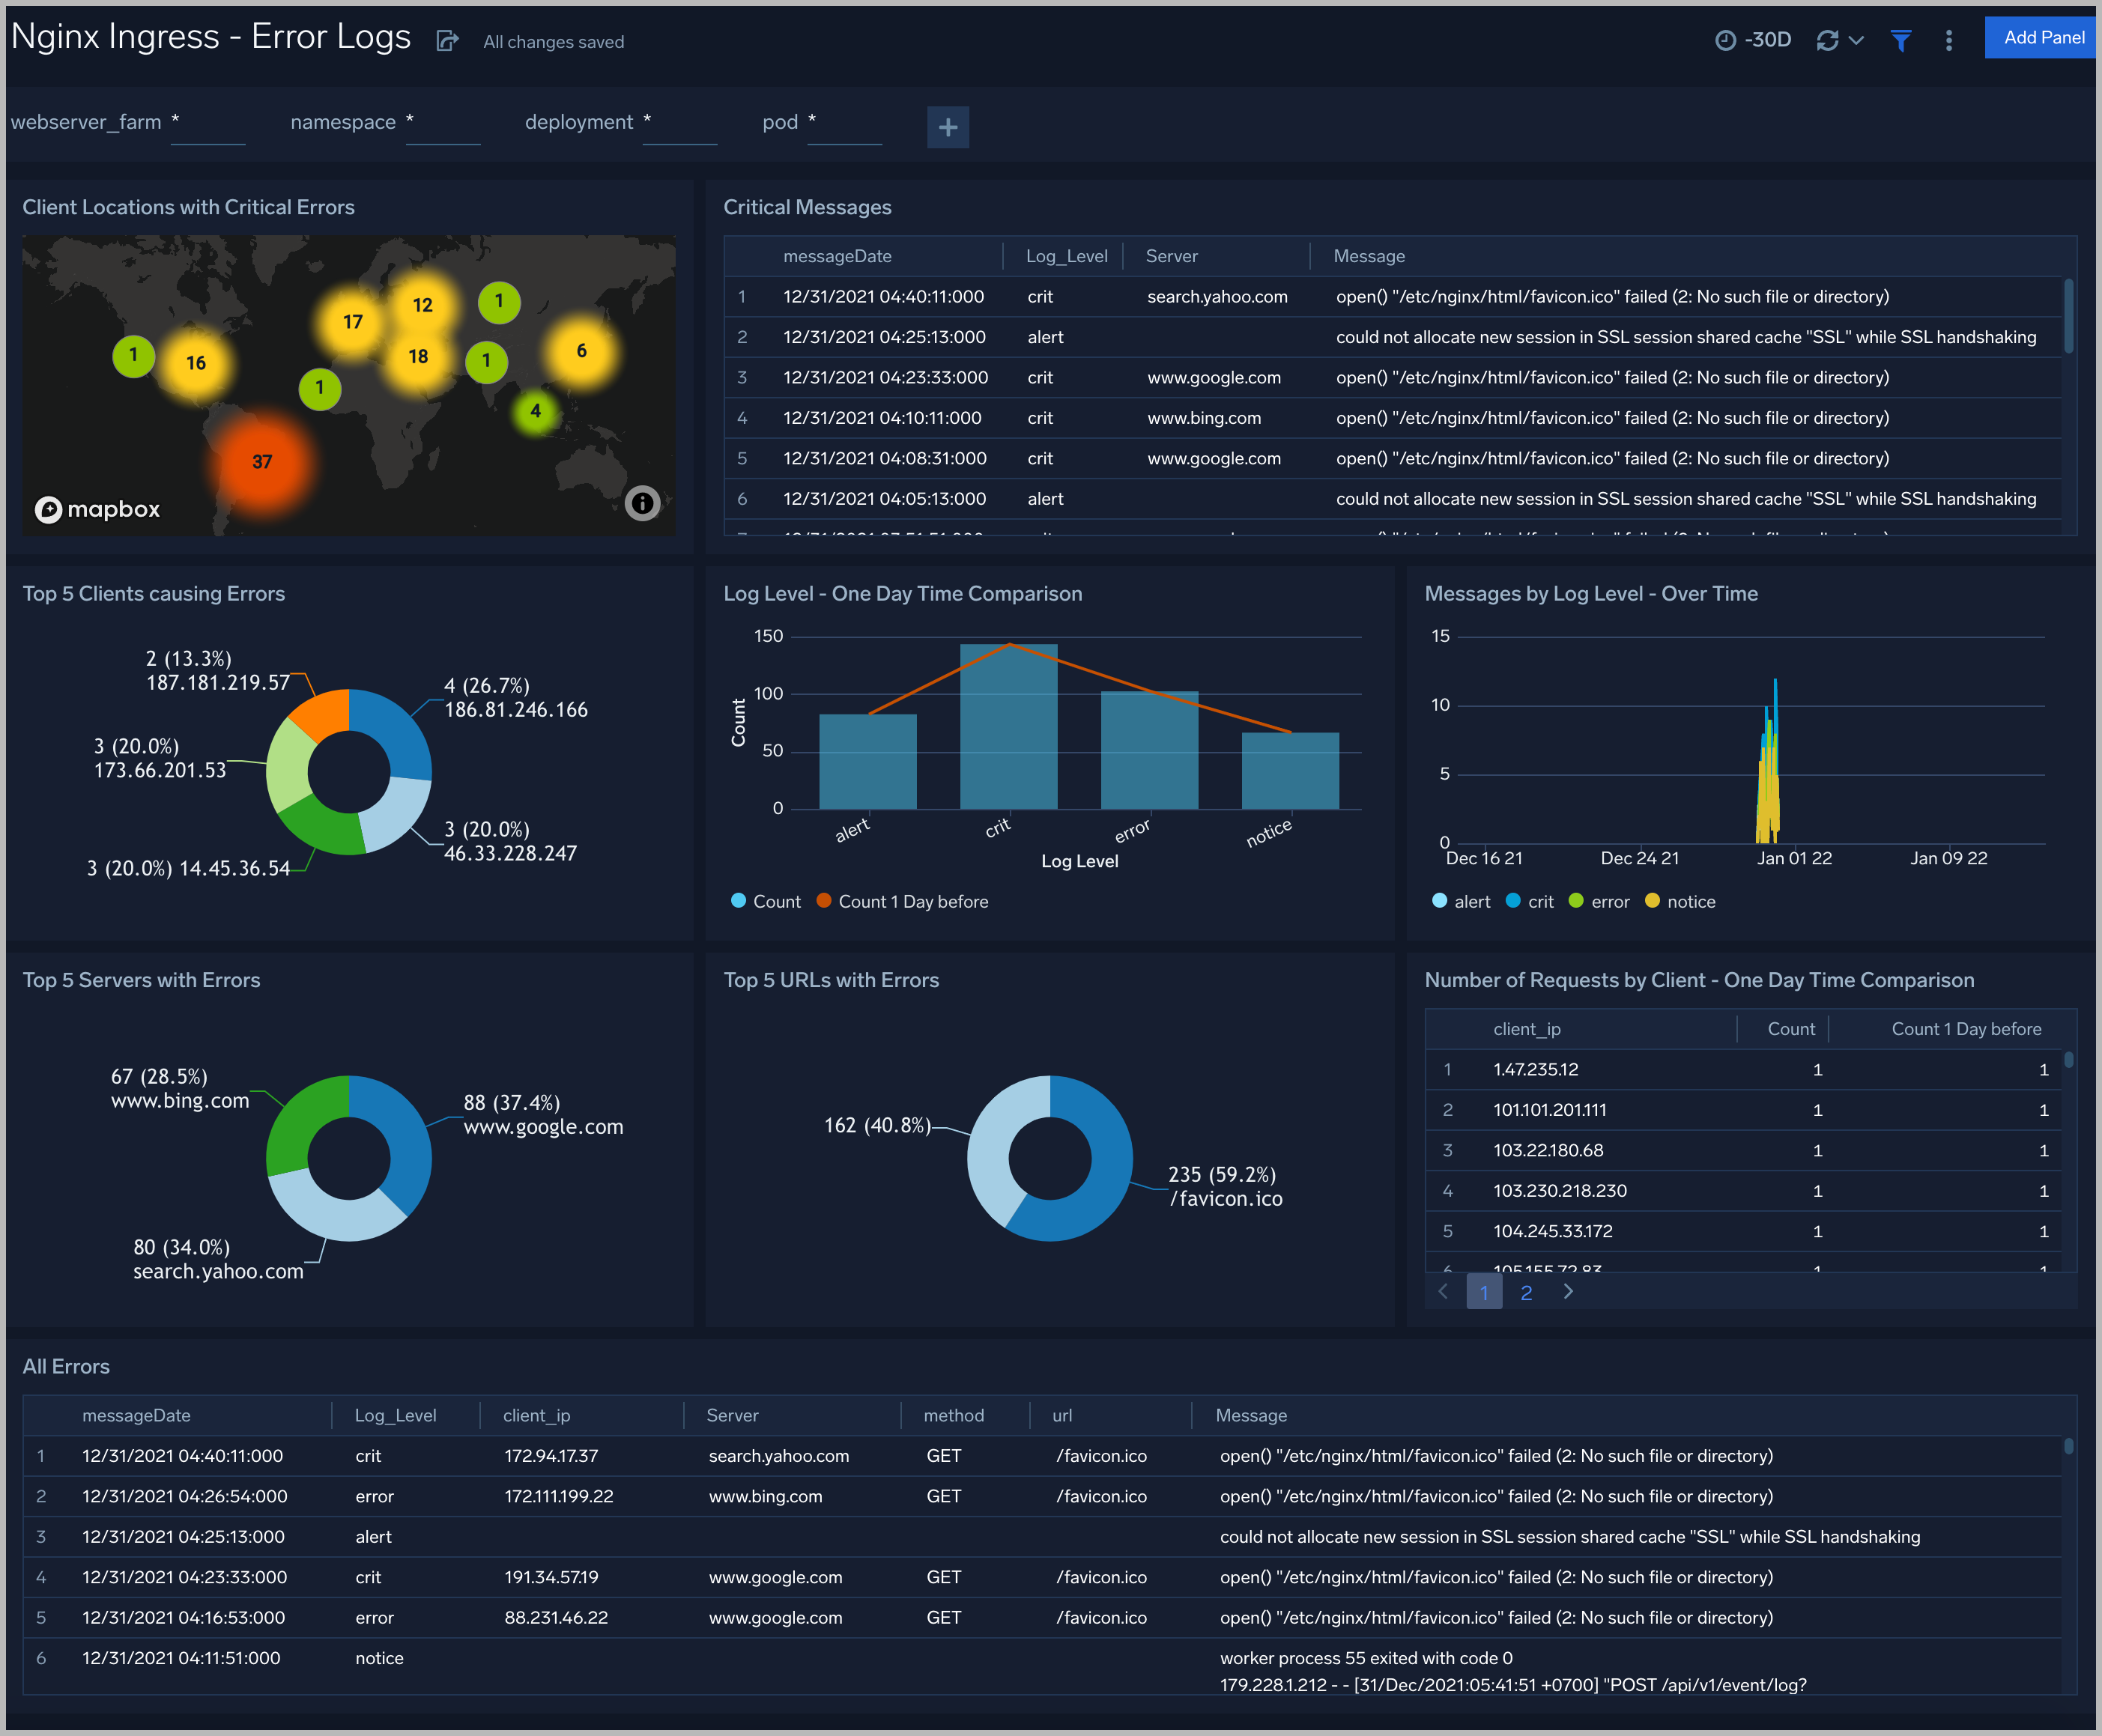
Error Logs
The Nginx Ingress - Error Logs Analysis dashboard provides a high-level view of log level breakdowns, comparisons, and trends. The panels also show the geographic locations of clients and clients with critical messages, new connections and outliers, client requests, request trends, and request outliers.
The Nginx Ingress - Error Logs Analysis Dashboard provides a high-level view of log level breakdowns, comparisons, and trends. The panels also show the geographic locations of clients and clients with critical messages, new connections and outliers, client requests, request trends, and request outliers.
Use this dashboard to:
- Track requests from clients. A request is a message asking for a resource, such as a page or an image.
- To track and view client geographic locations generating errors.
- Track critical alerts and emergency error alerts.
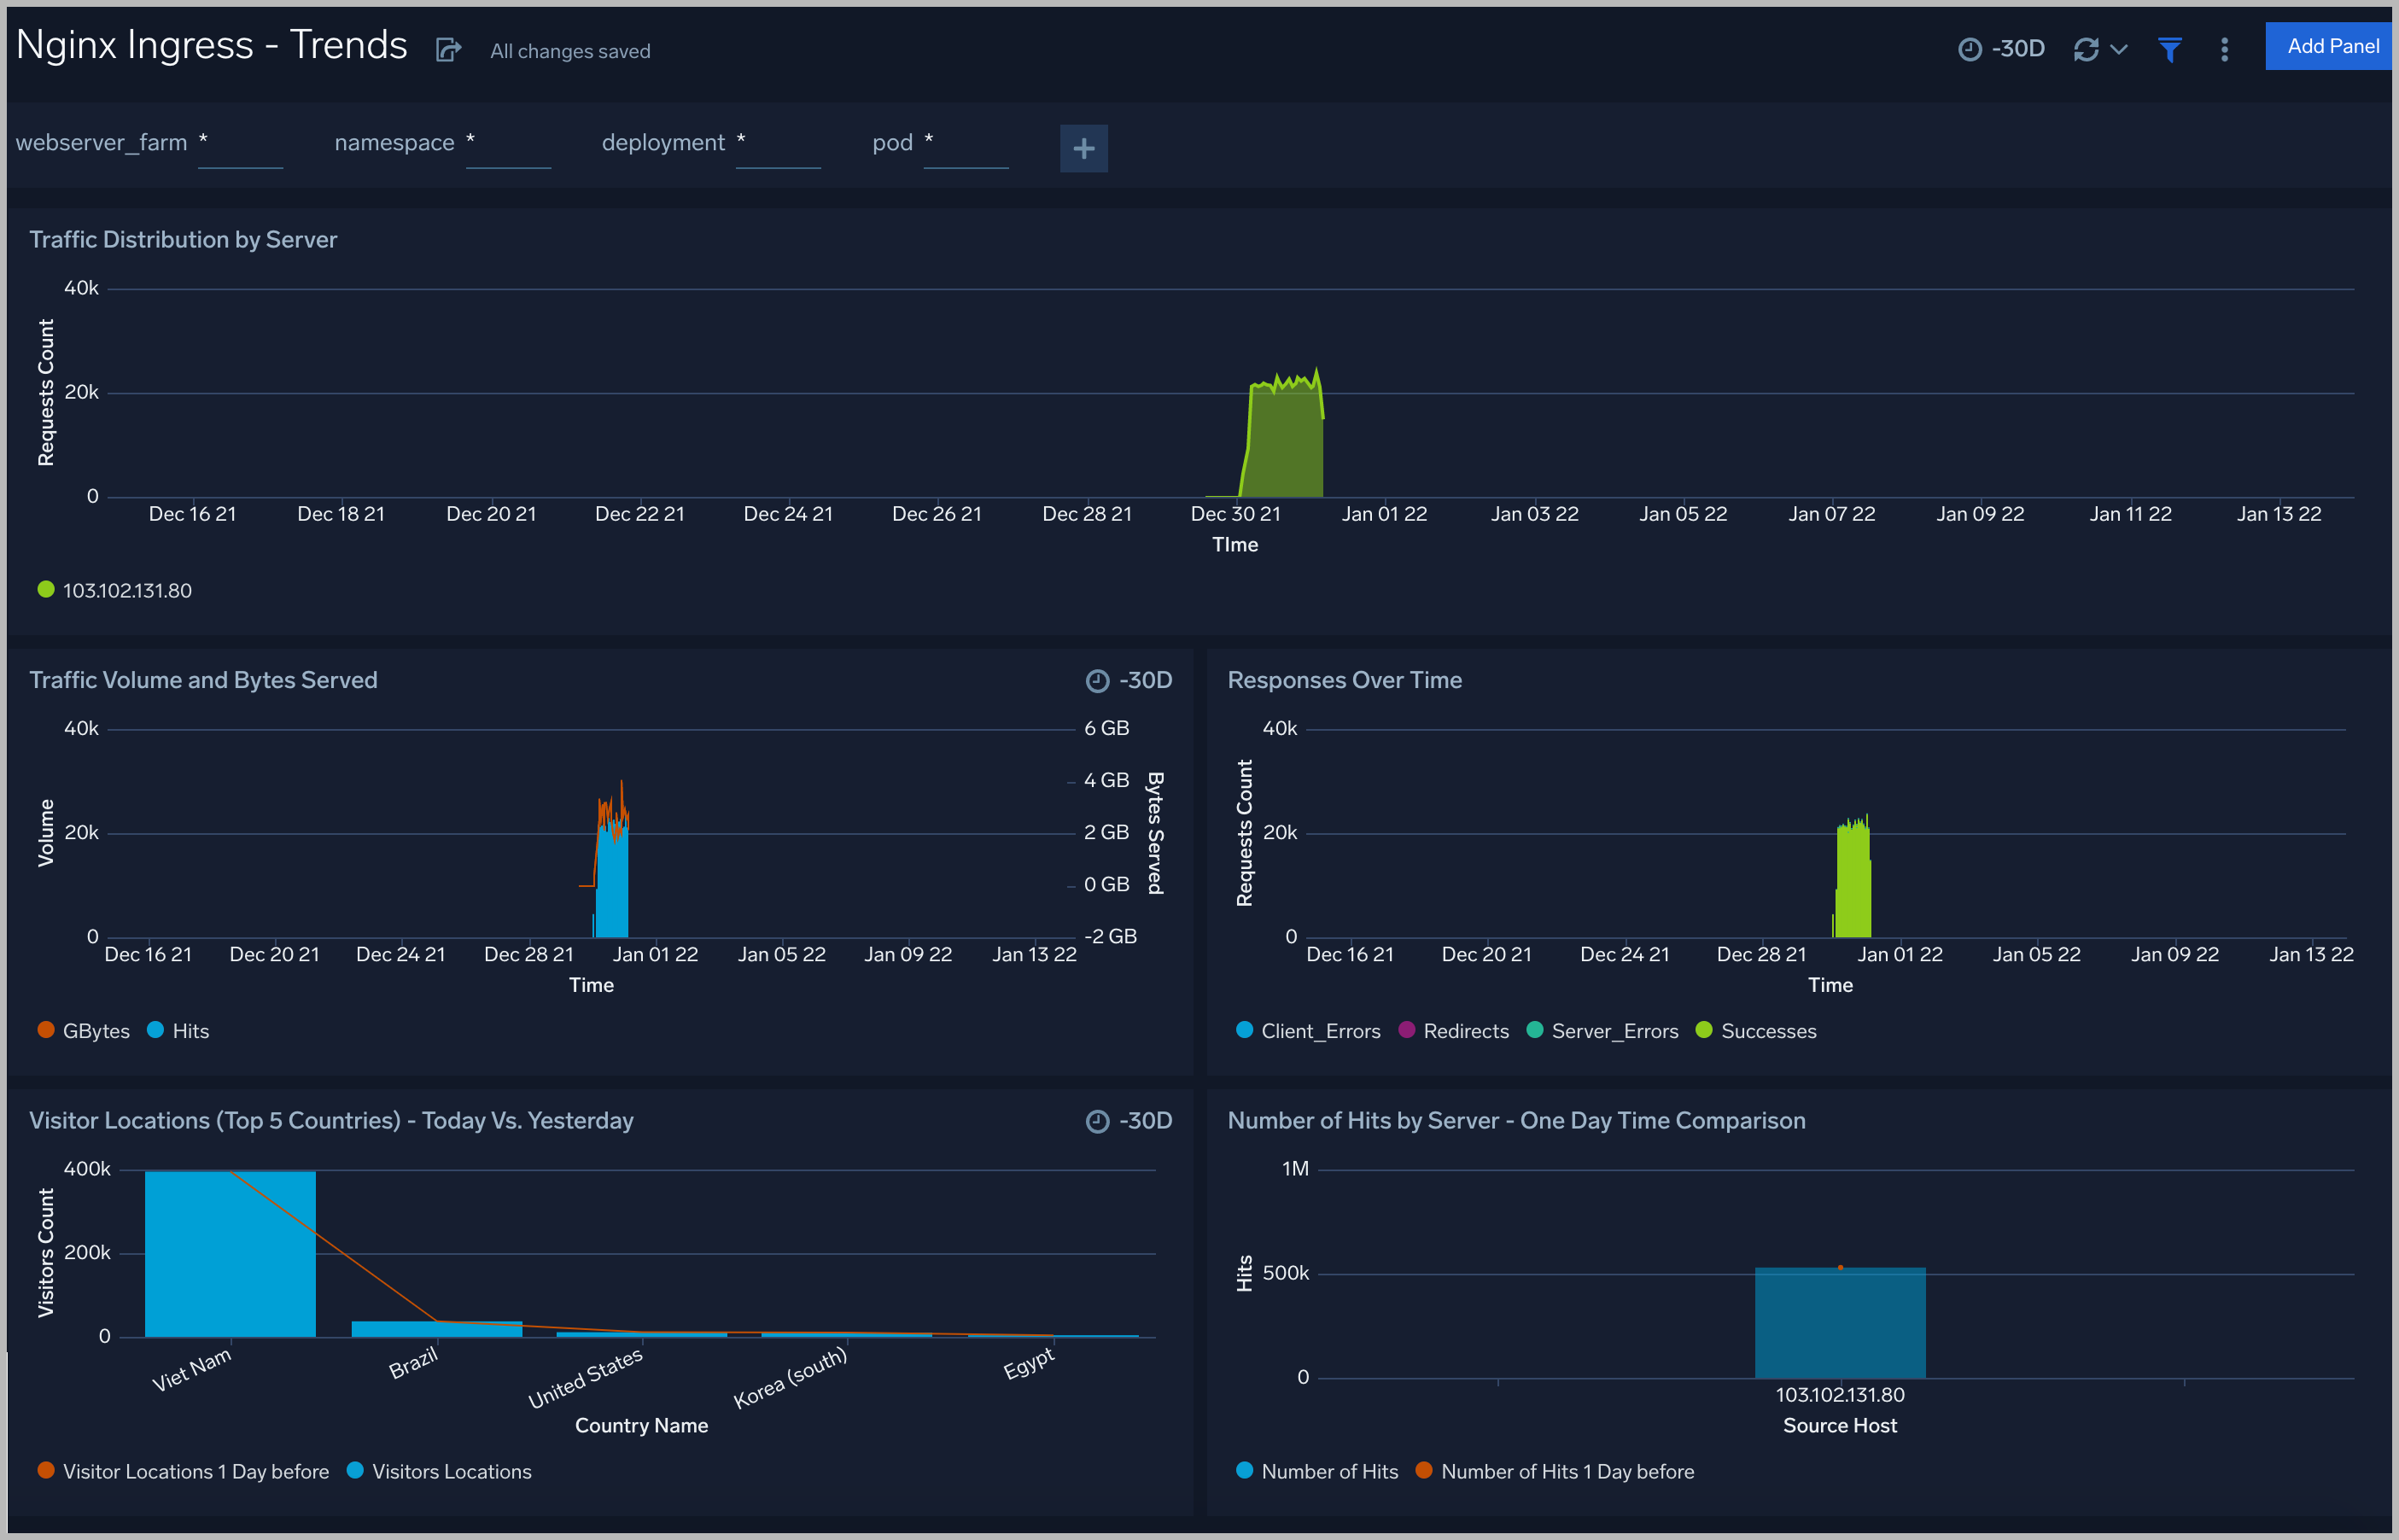
Trends
The Nginx Ingress - Logs Timeline Analysis dashboard provides a high-level view of the activity and health of Nginx servers on your network. Dashboard panels display visual graphs and detailed information on traffic volume and distribution, responses over time, as well as time comparisons for visitor locations and server hits.
Use this dashboard to:
- To understand the traffic distribution across servers, provide insights for resource planning by analyzing data volume and bytes served.
- Gain insights into originated traffic location by region. This can help you allocate compute resources to different regions according to their needs.
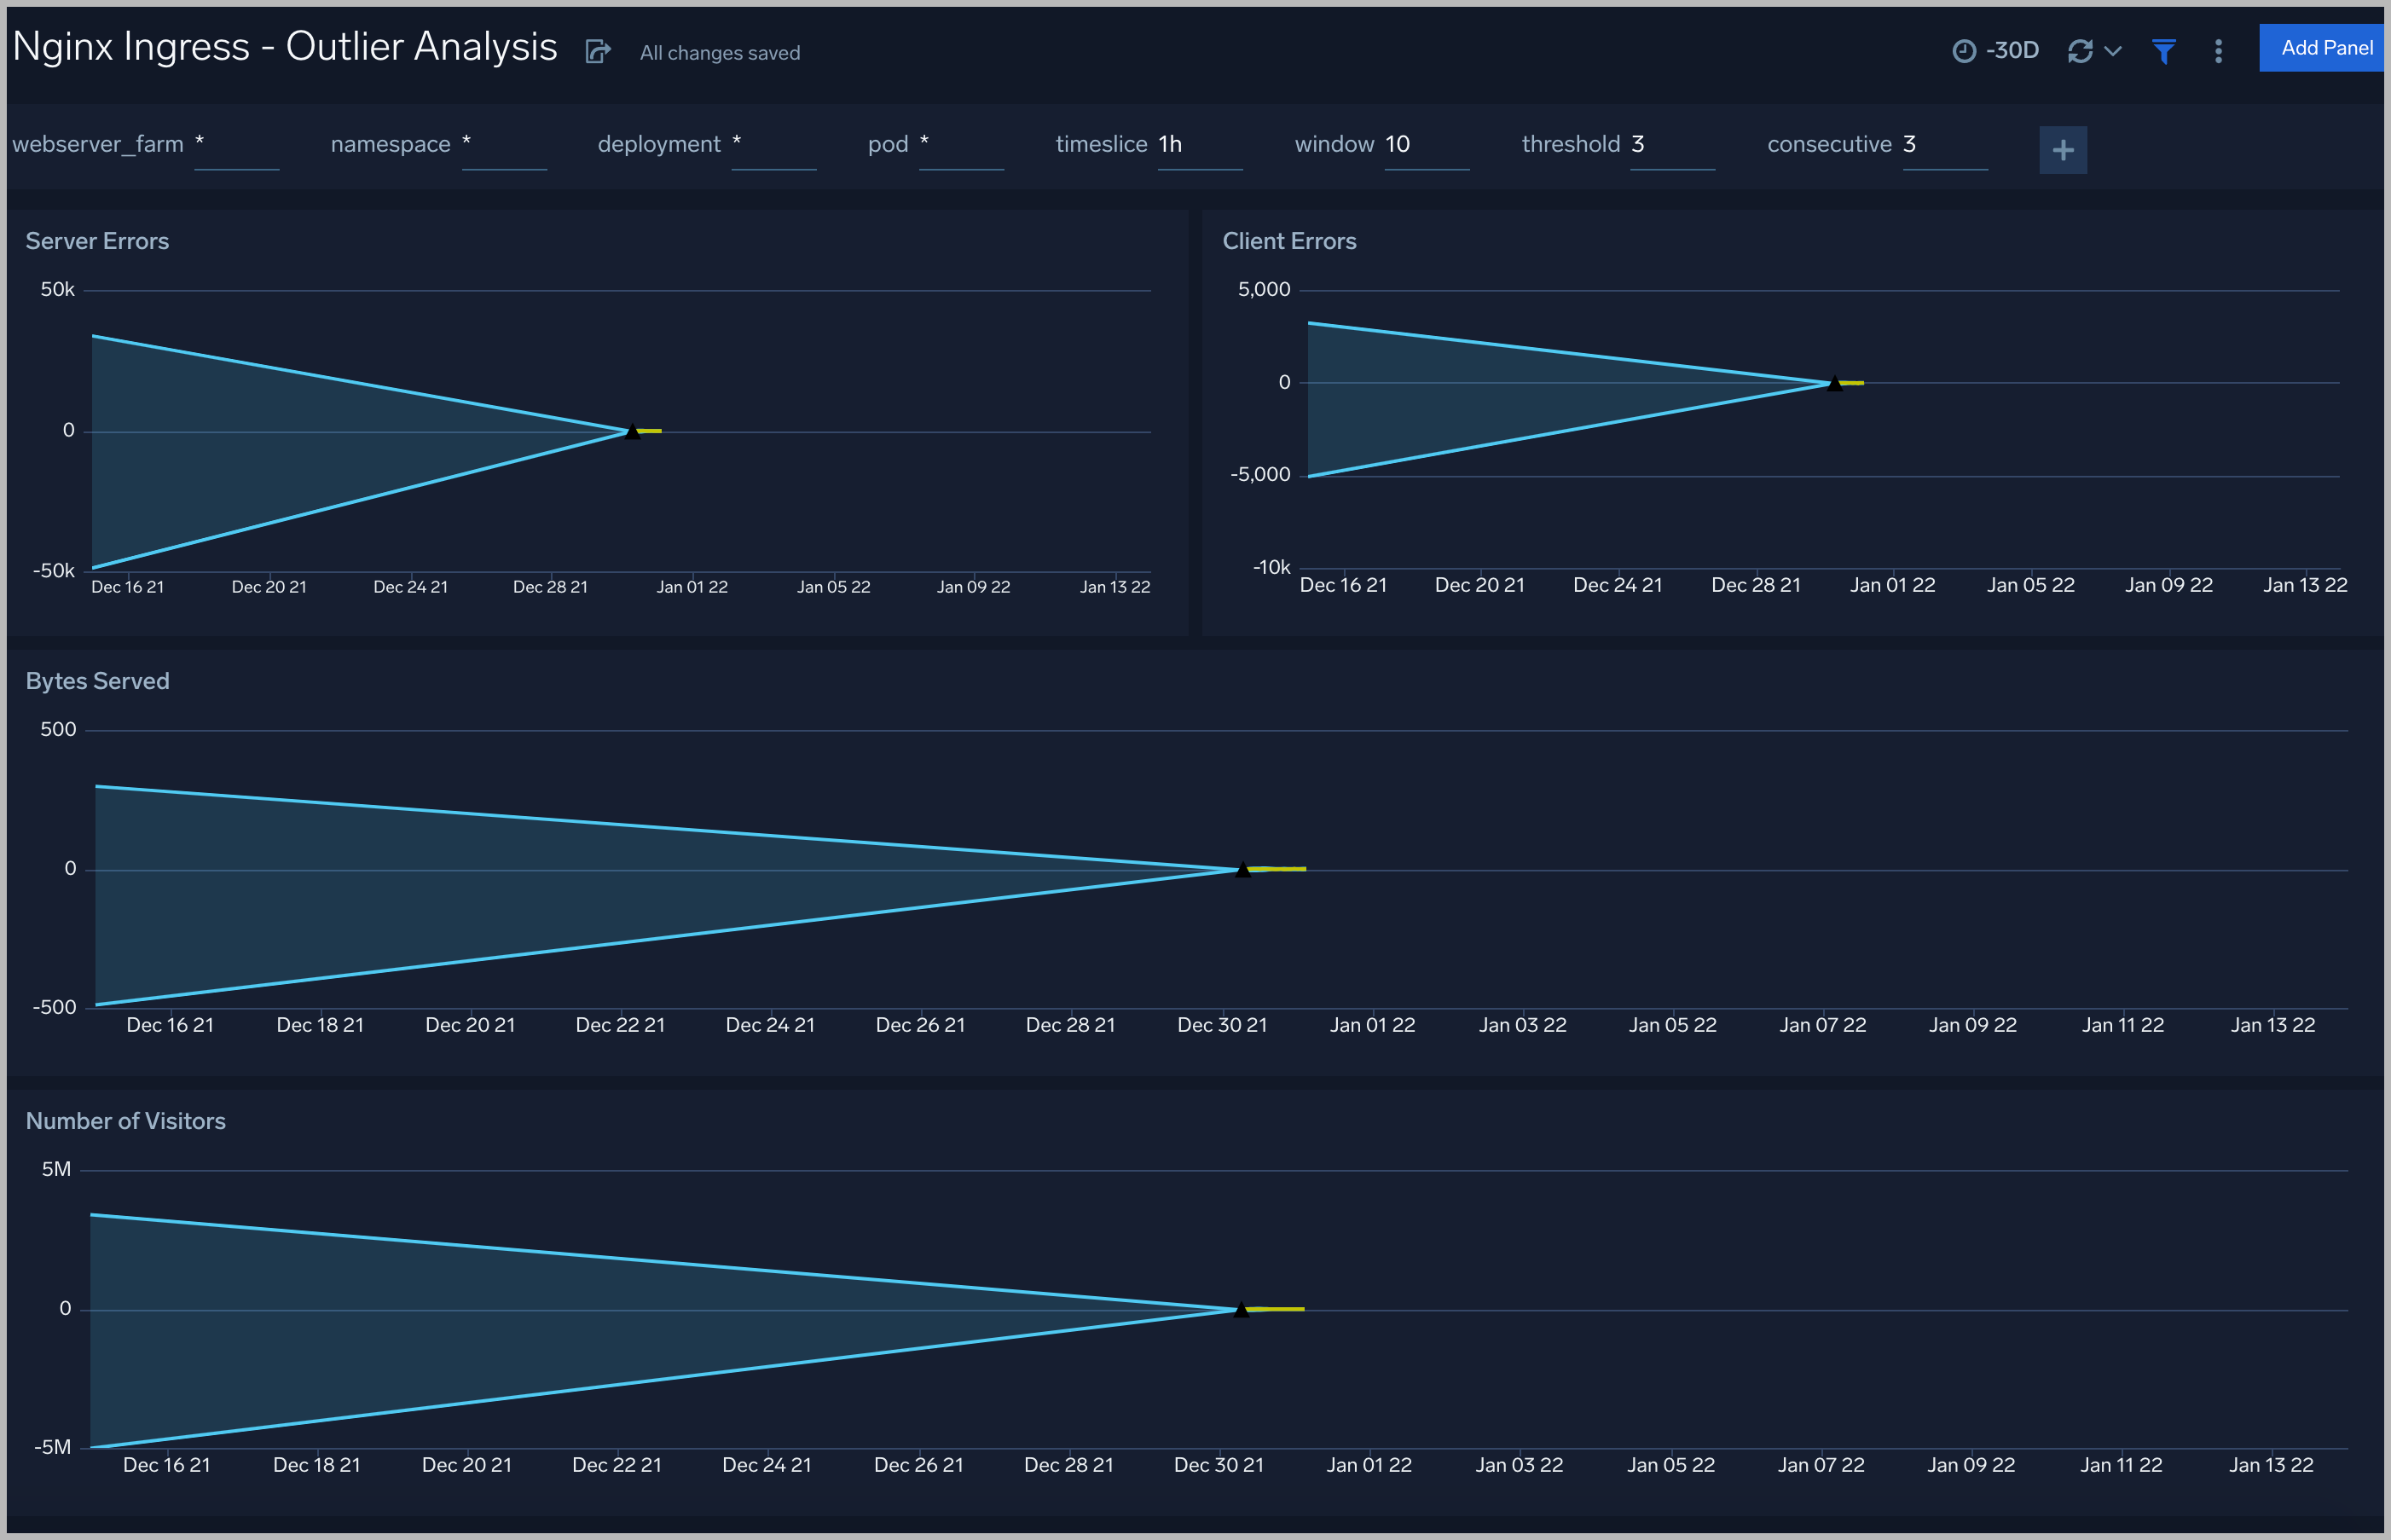
Outlier Analysis
The Nginx Ingress - Outlier Analysis dashboard provides a high-level view of Nginx server outlier metrics for bytes served, number of visitors, and server errors. You can select the time interval over which outliers are aggregated, then hover the cursor over the graph to display detailed information for that point in time.
Use this dashboard to:
- Detect outliers in your infrastructure with Sumo Logic’s machine learning algorithm.
- To identify outliers in incoming traffic and the number of errors encountered by your servers.
You can use schedule searches to send alerts to yourself whenever there is an outlier detected by Sumo Logic.
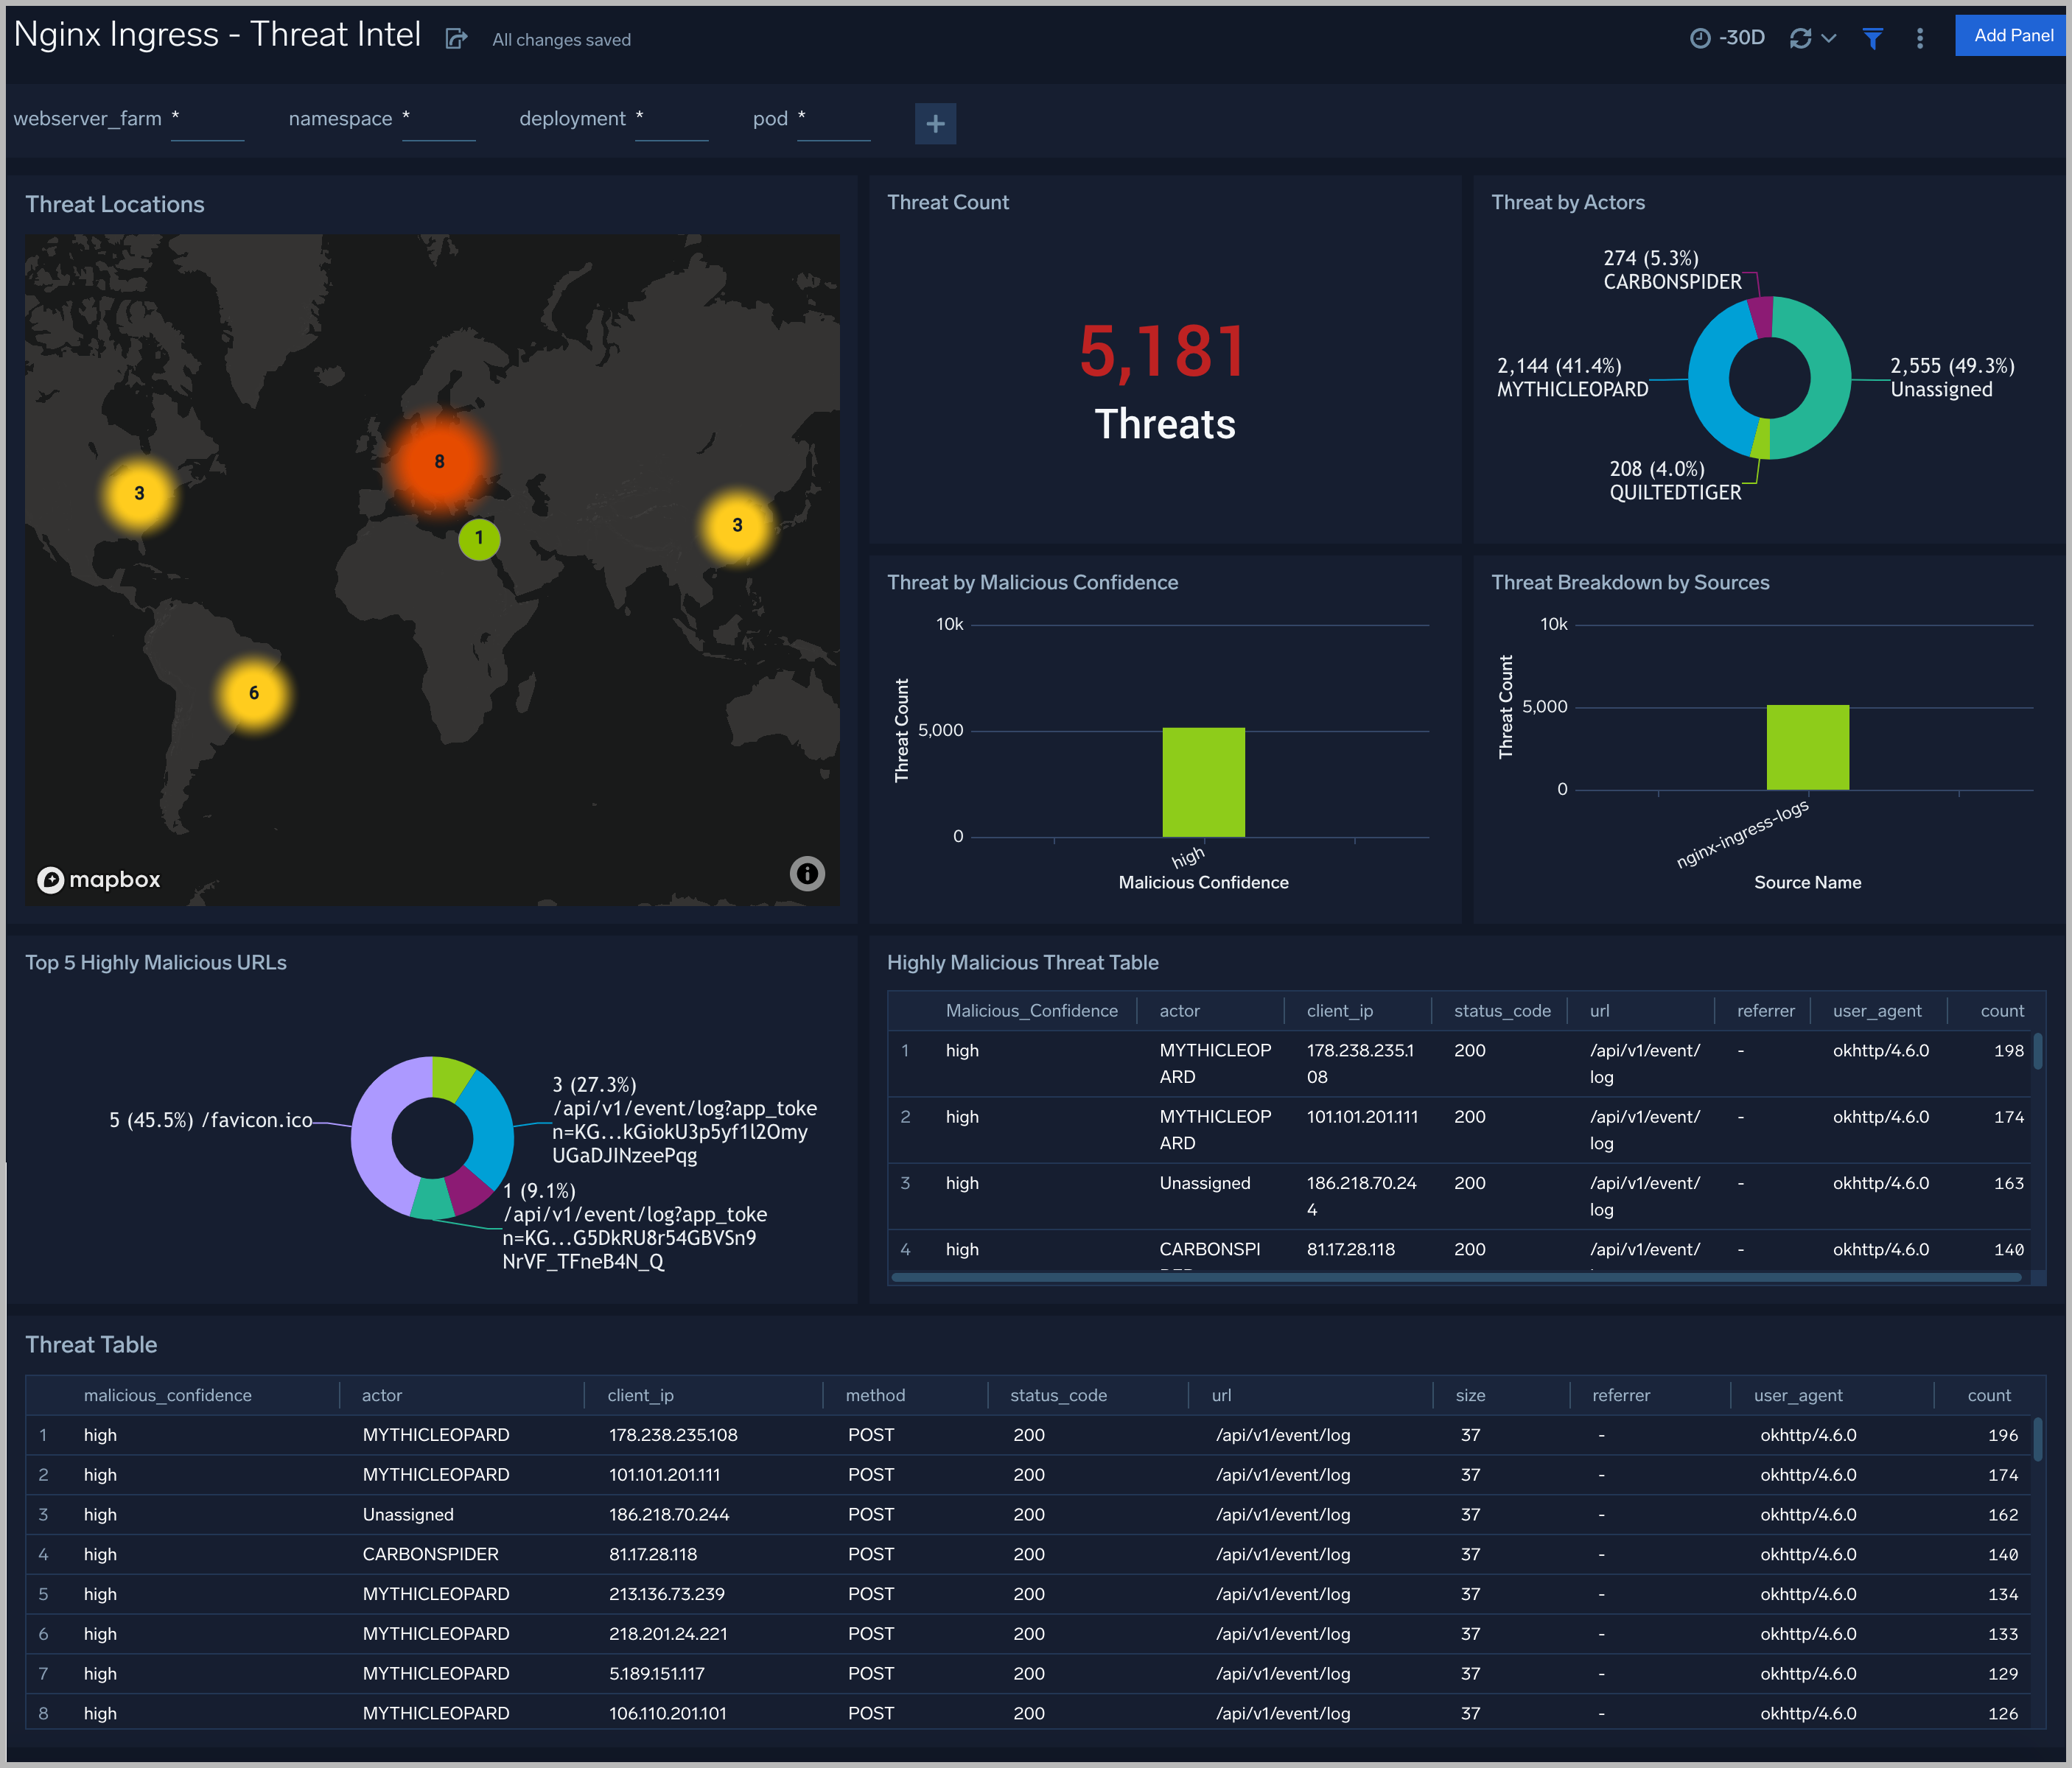
Threat Intel
The Nginx Ingress - Threat Intel dashboard provides an at-a-glance view of threats to Nginx servers on your network. Dashboard panels display the threat count over a selected time period, geographic locations where threats occurred, source breakdown, actors responsible for threats, severity, and a correlation of IP addresses, method, and status code of threats.
Use this dashboard to:
- To gain insights and understand threats in incoming traffic and discover potential IOCs. Incoming traffic requests are analyzed using the Sumo - Crowdstrikes threat feed.
Web Server Operations
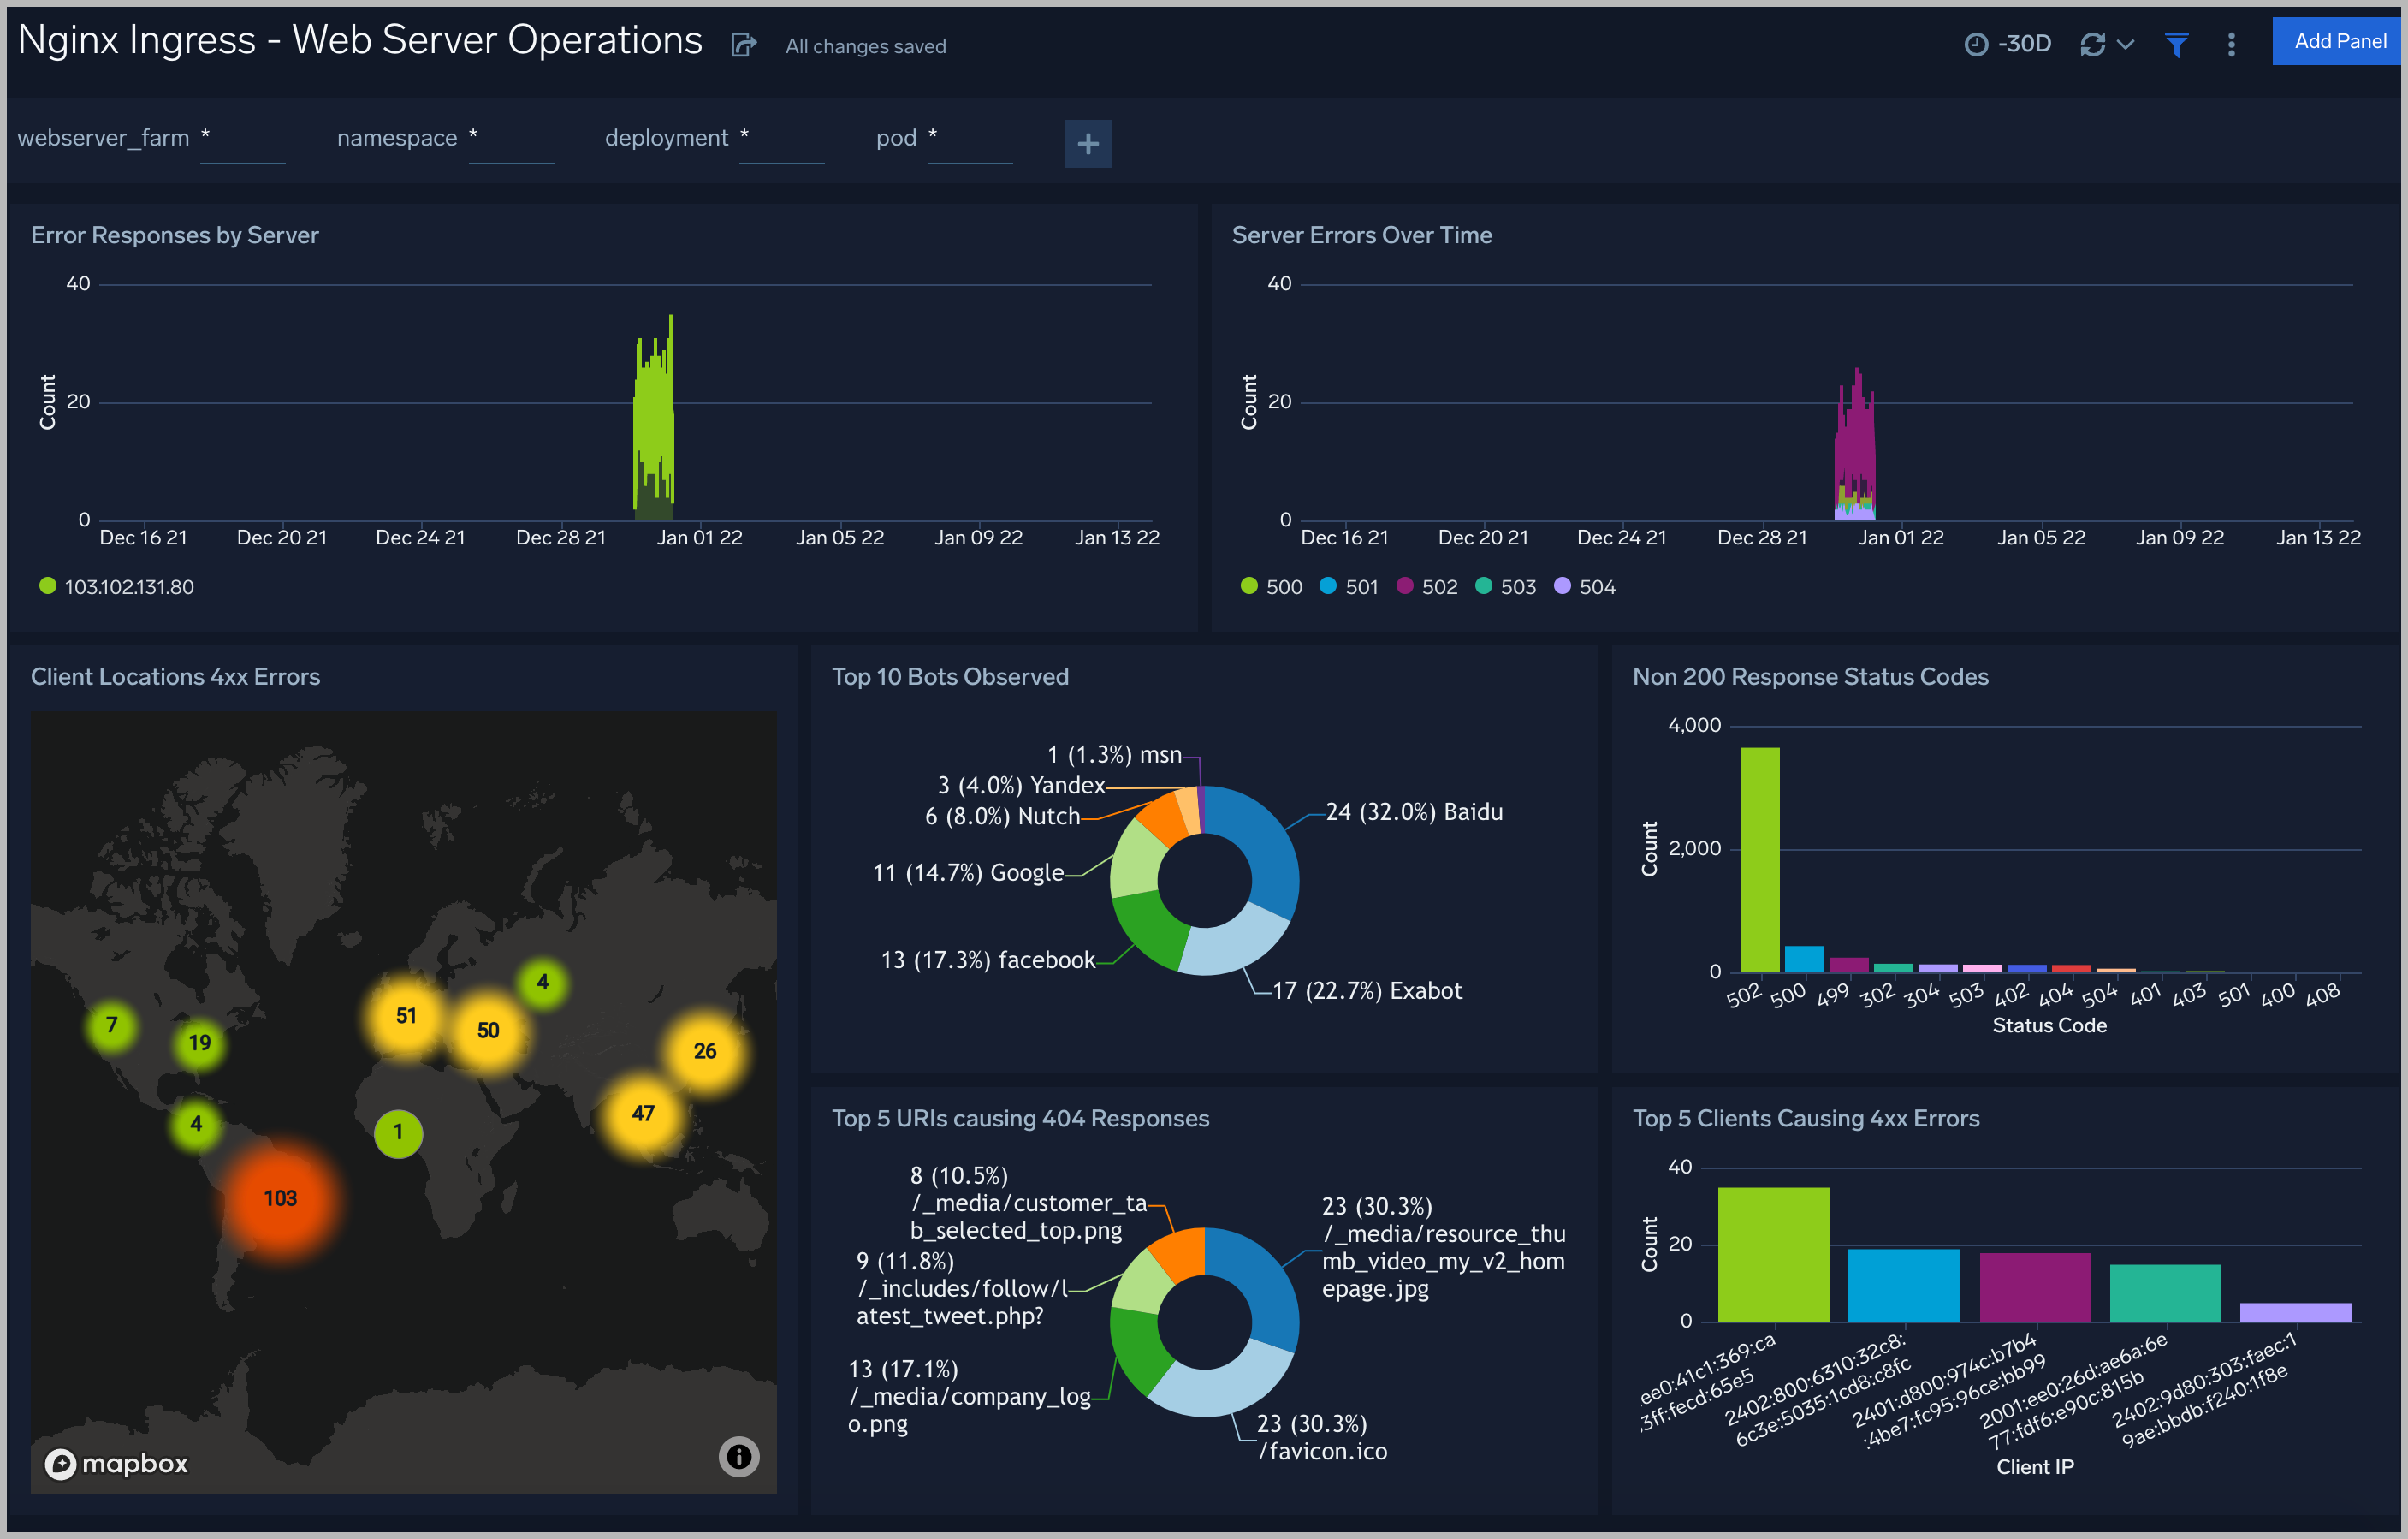
The Nginx - Web Server Operations dashboard provides a high-level view combined with detailed information on the top ten bots, geographic locations, and data for clients with high error rates, server errors over time, and non 200 response code status codes. Dashboard panels also show information on server error logs, error log levels, error responses by a server, and the top URIs responsible for 404 responses.
Use this dashboard to:
- Gain insights into Client, Server Responses on Nginx Server. This helps you identify errors in Nginx Server.
- To identify geo locations of all Client errors. This helps you identify client location causing errors and helps you to block client IPs.
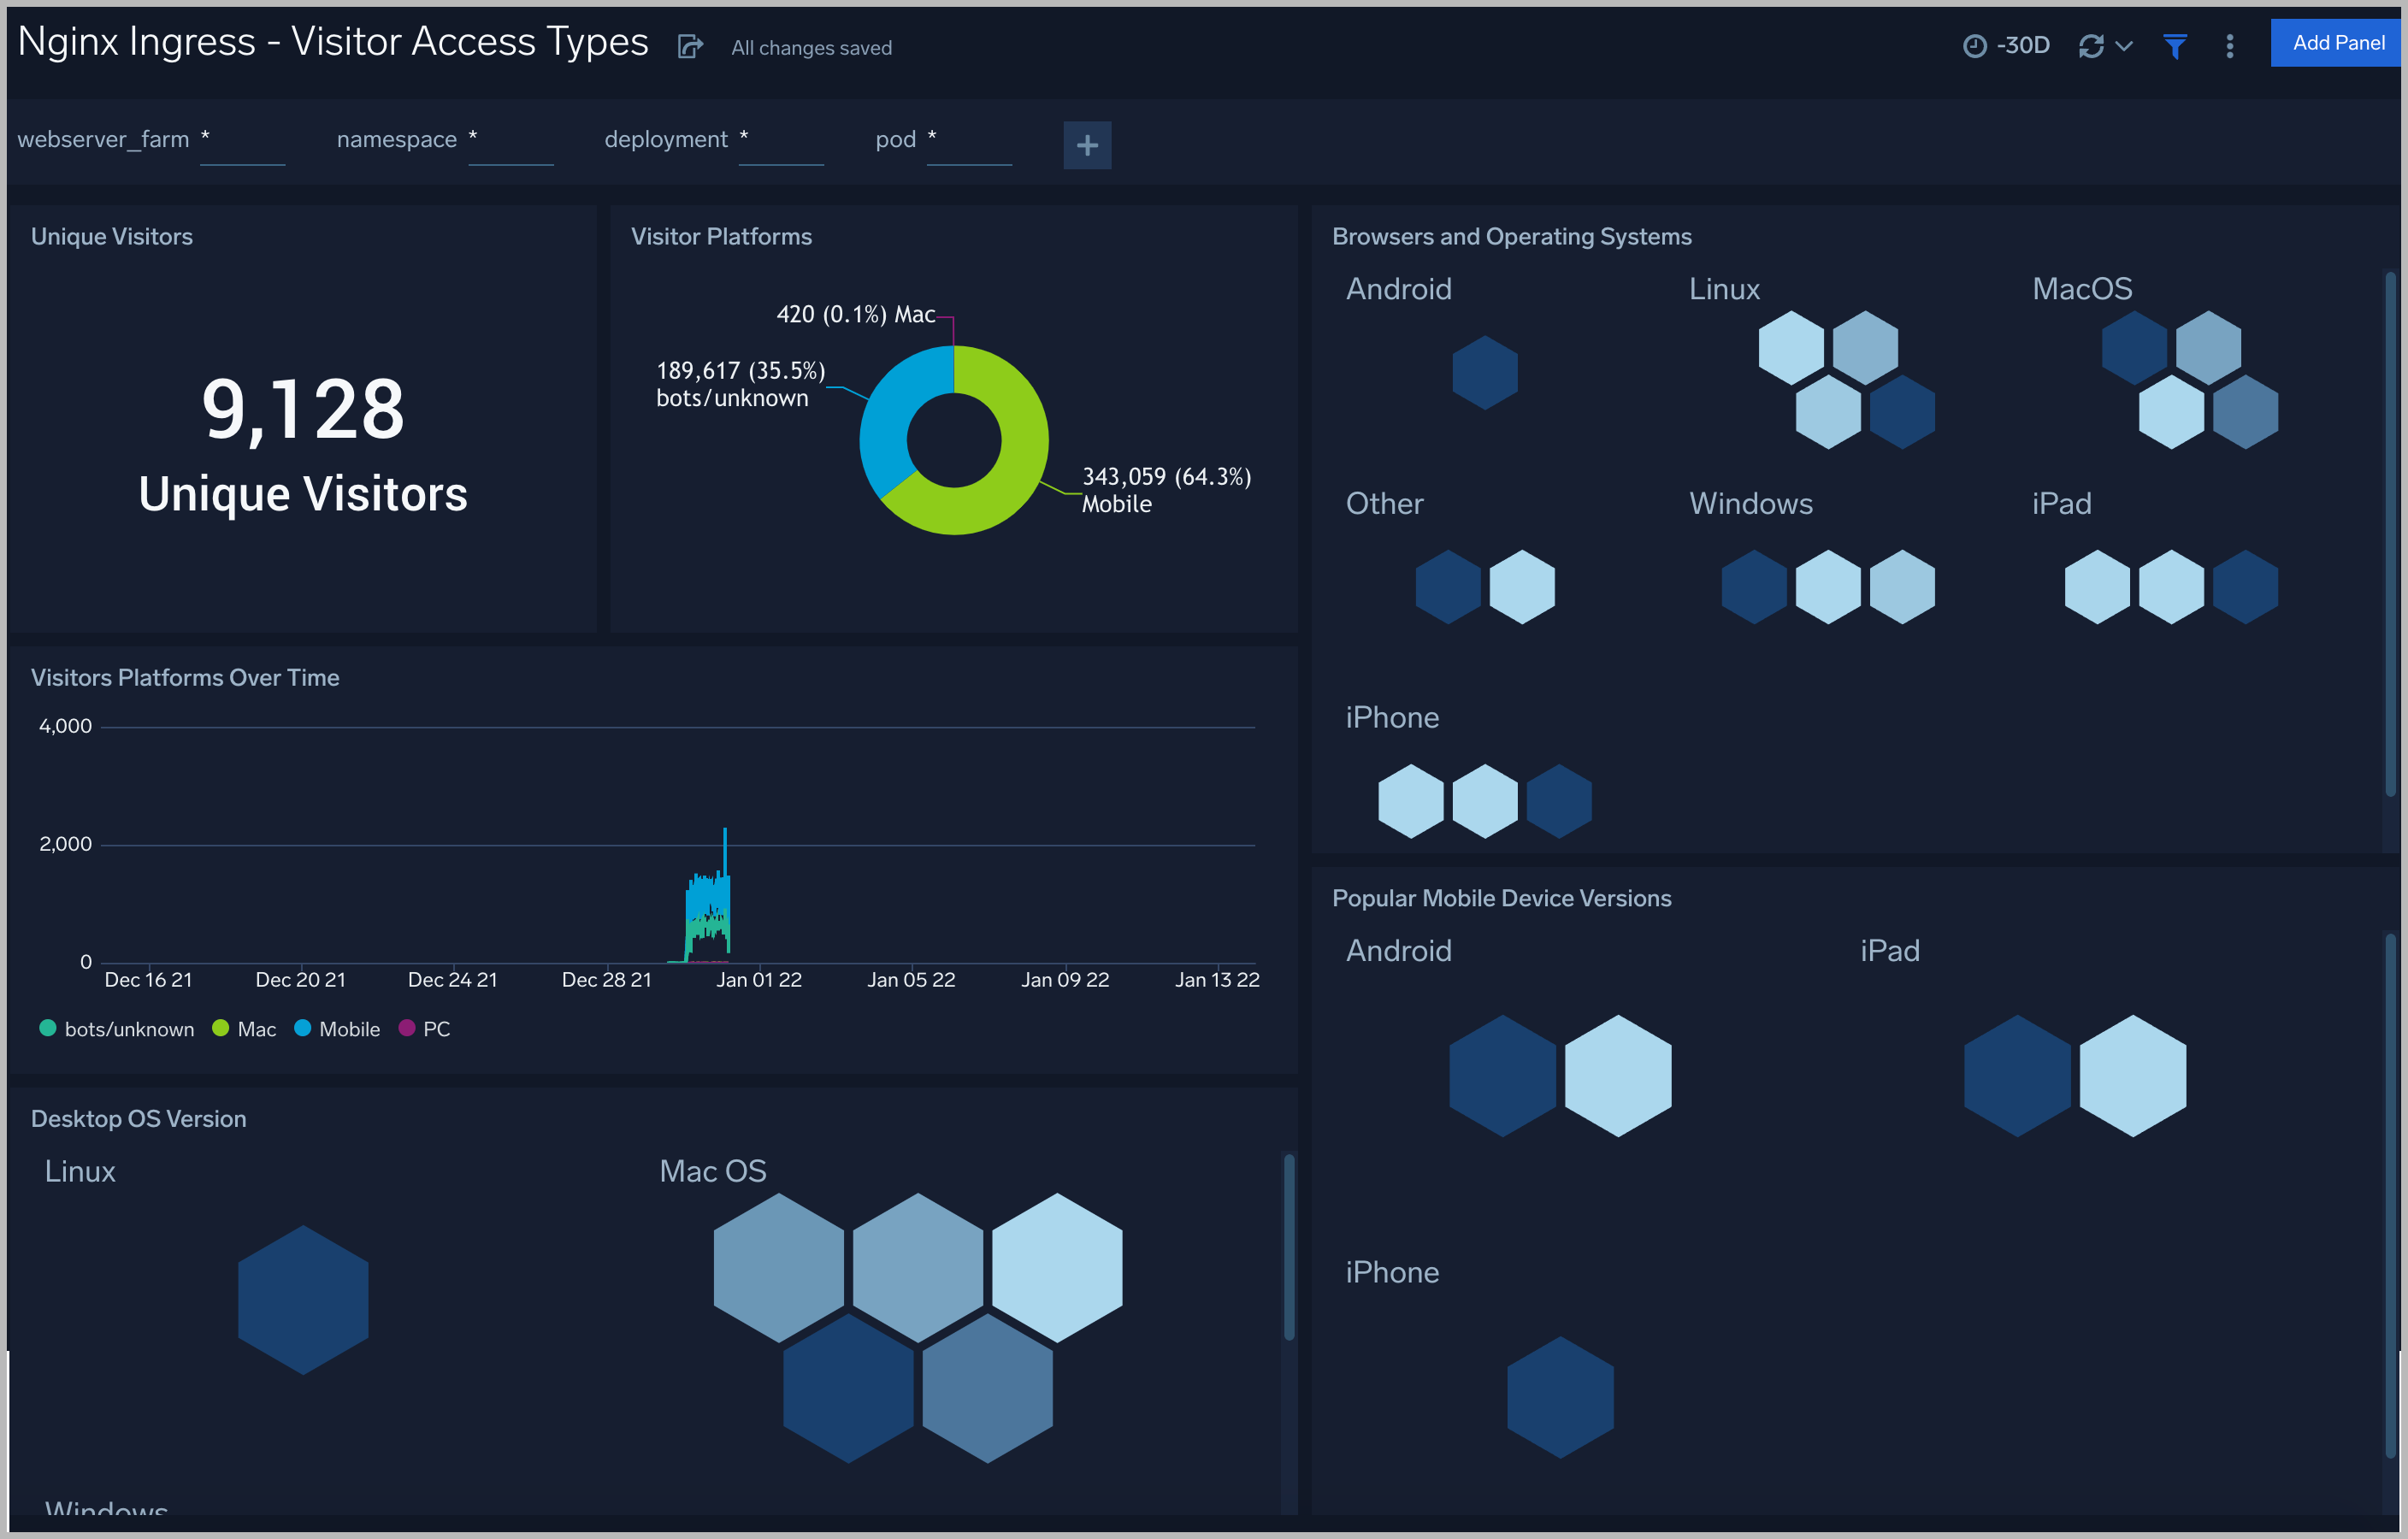
Visitor Access Types
The Nginx Ingress - Visitor Access Types dashboard provides insights into visitor platform types, browsers, and operating systems, as well as the most popular mobile devices, PC and Mac versions used.
Use this dashboard to:
- Understand which platform and browsers are used to gain access to your infrastructure.
- These insights can be useful for planning in which browsers, platforms, and operating systems (OS) should be supported by different software services.
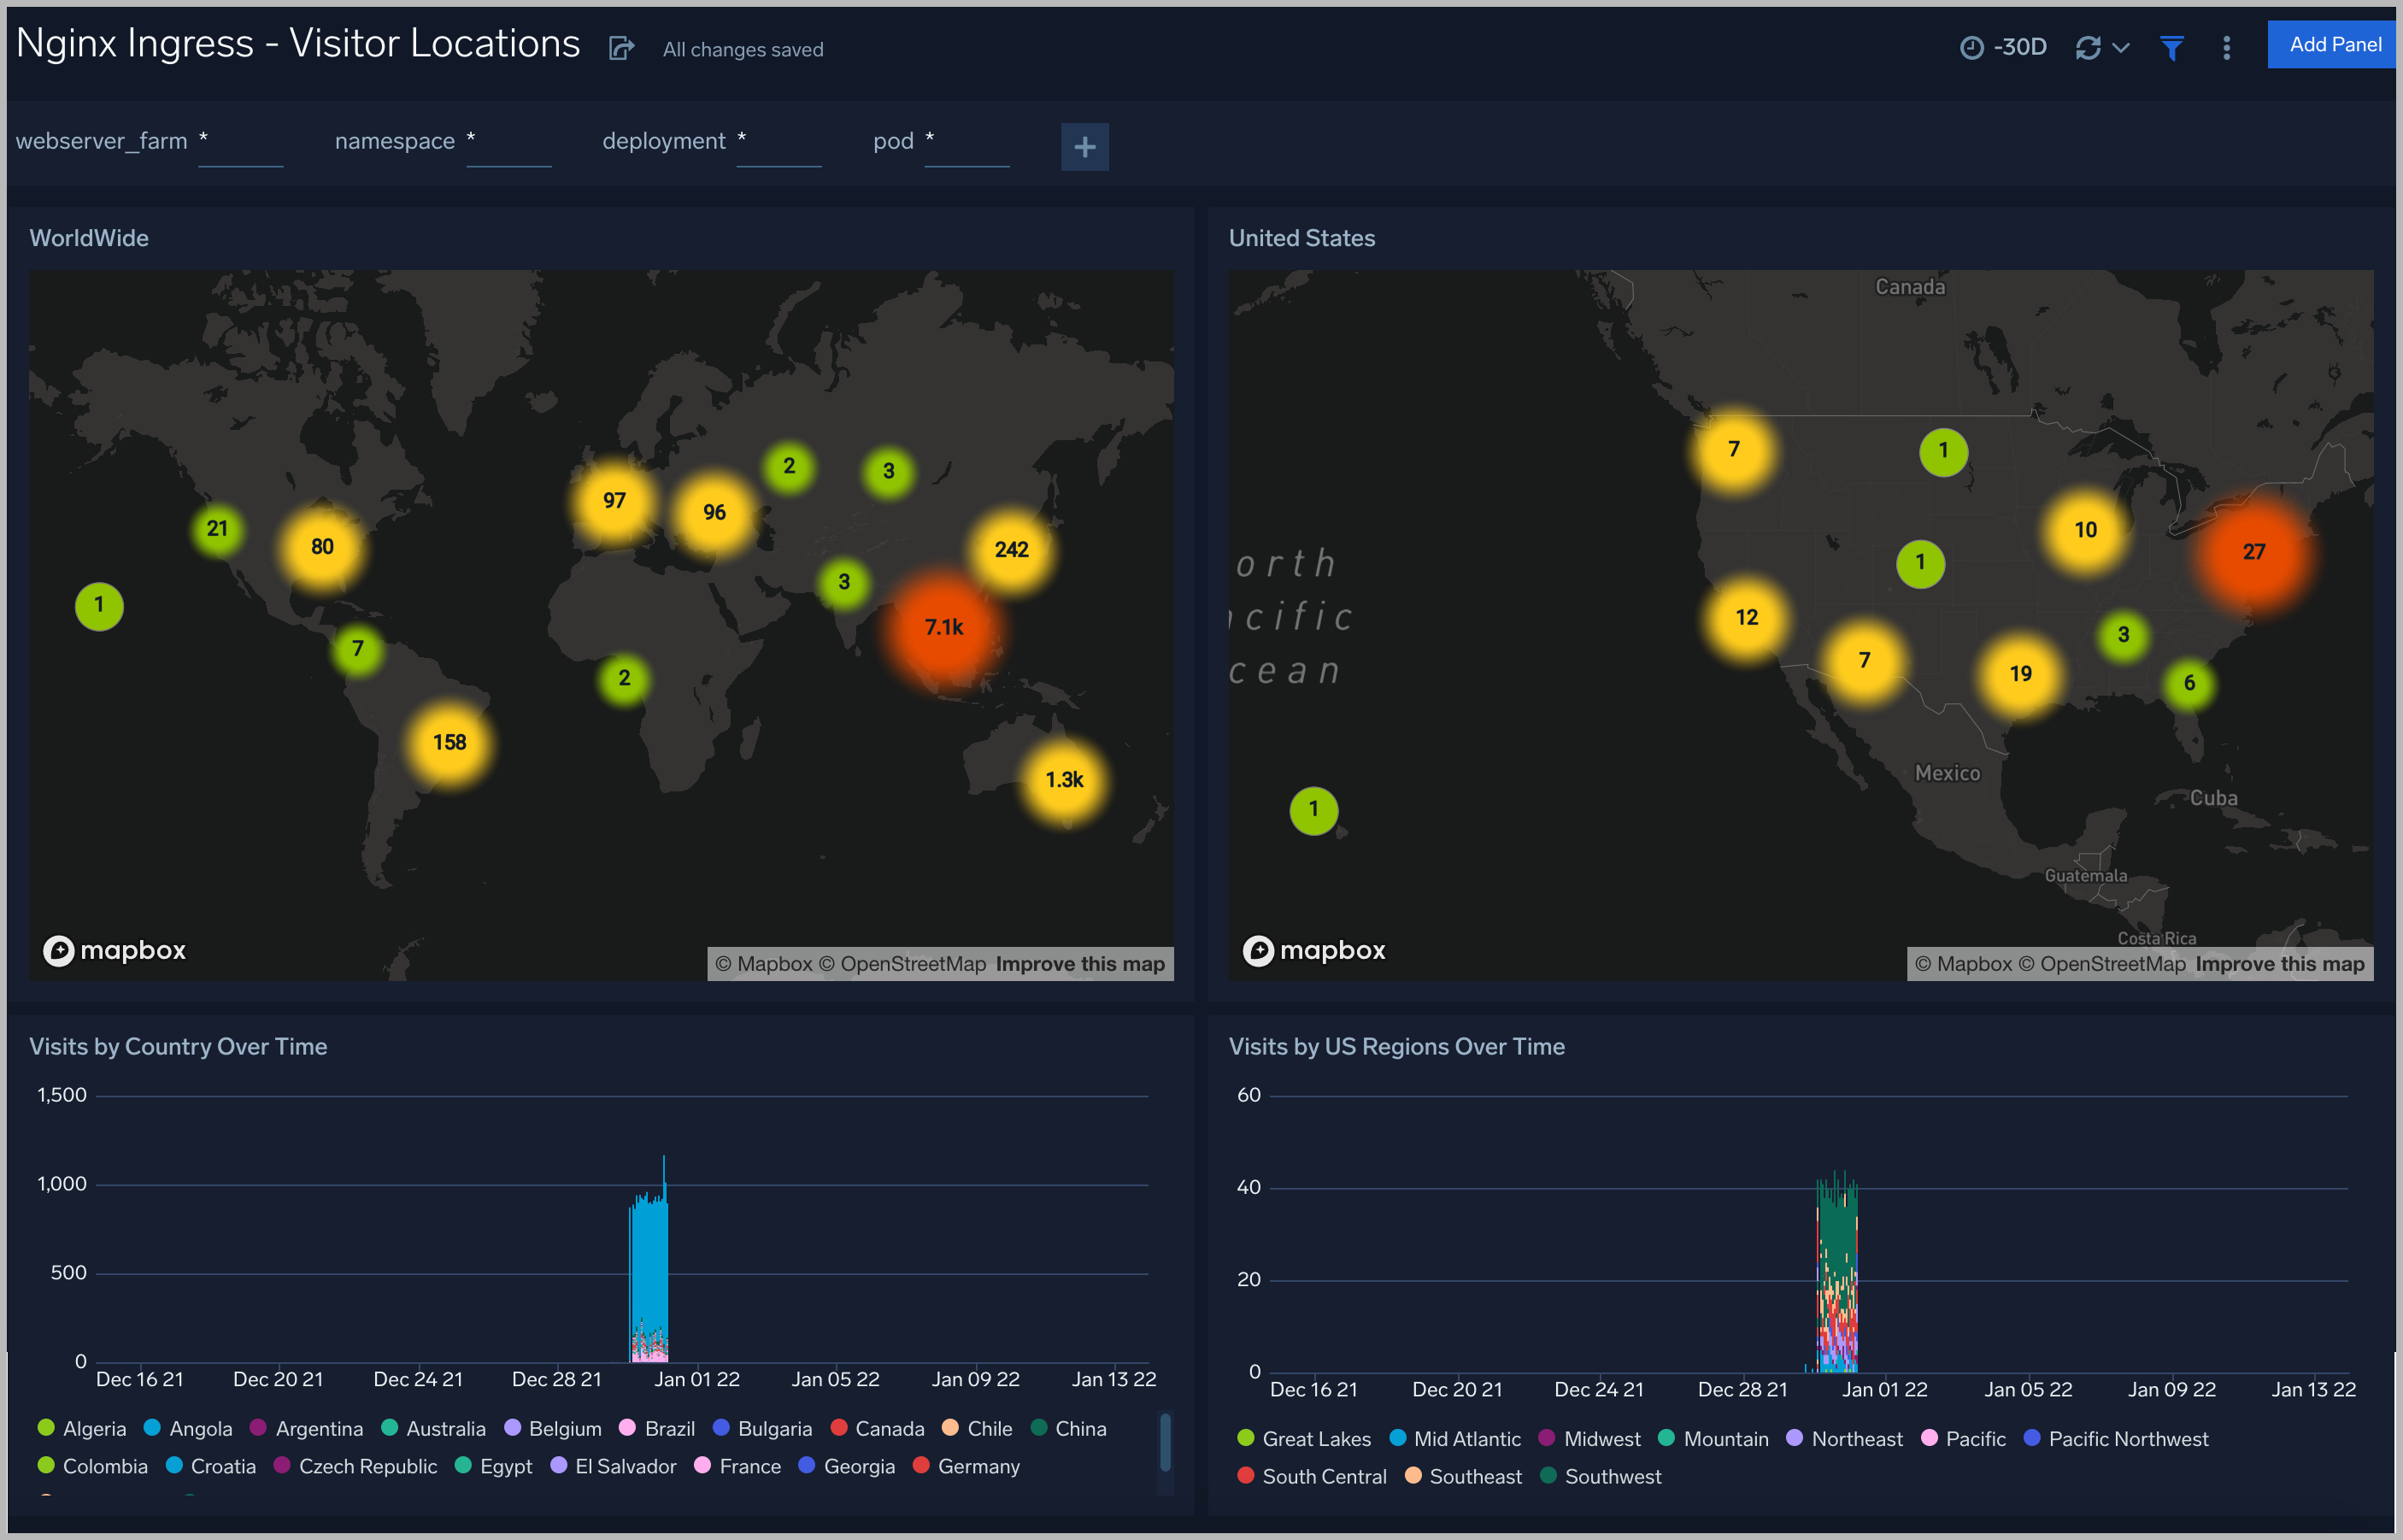
Visitor Locations
The Nginx Ingress - Visitor Locations dashboard provides a high-level view of Nginx visitor geographic locations both worldwide and in the United States. Dashboard panels also show graphic trends for visits by country over time and visits by US region over time.
Use this dashboard to:
- Gain insights into geographic locations of your user base. This is useful for resource planning in different regions across the globe.
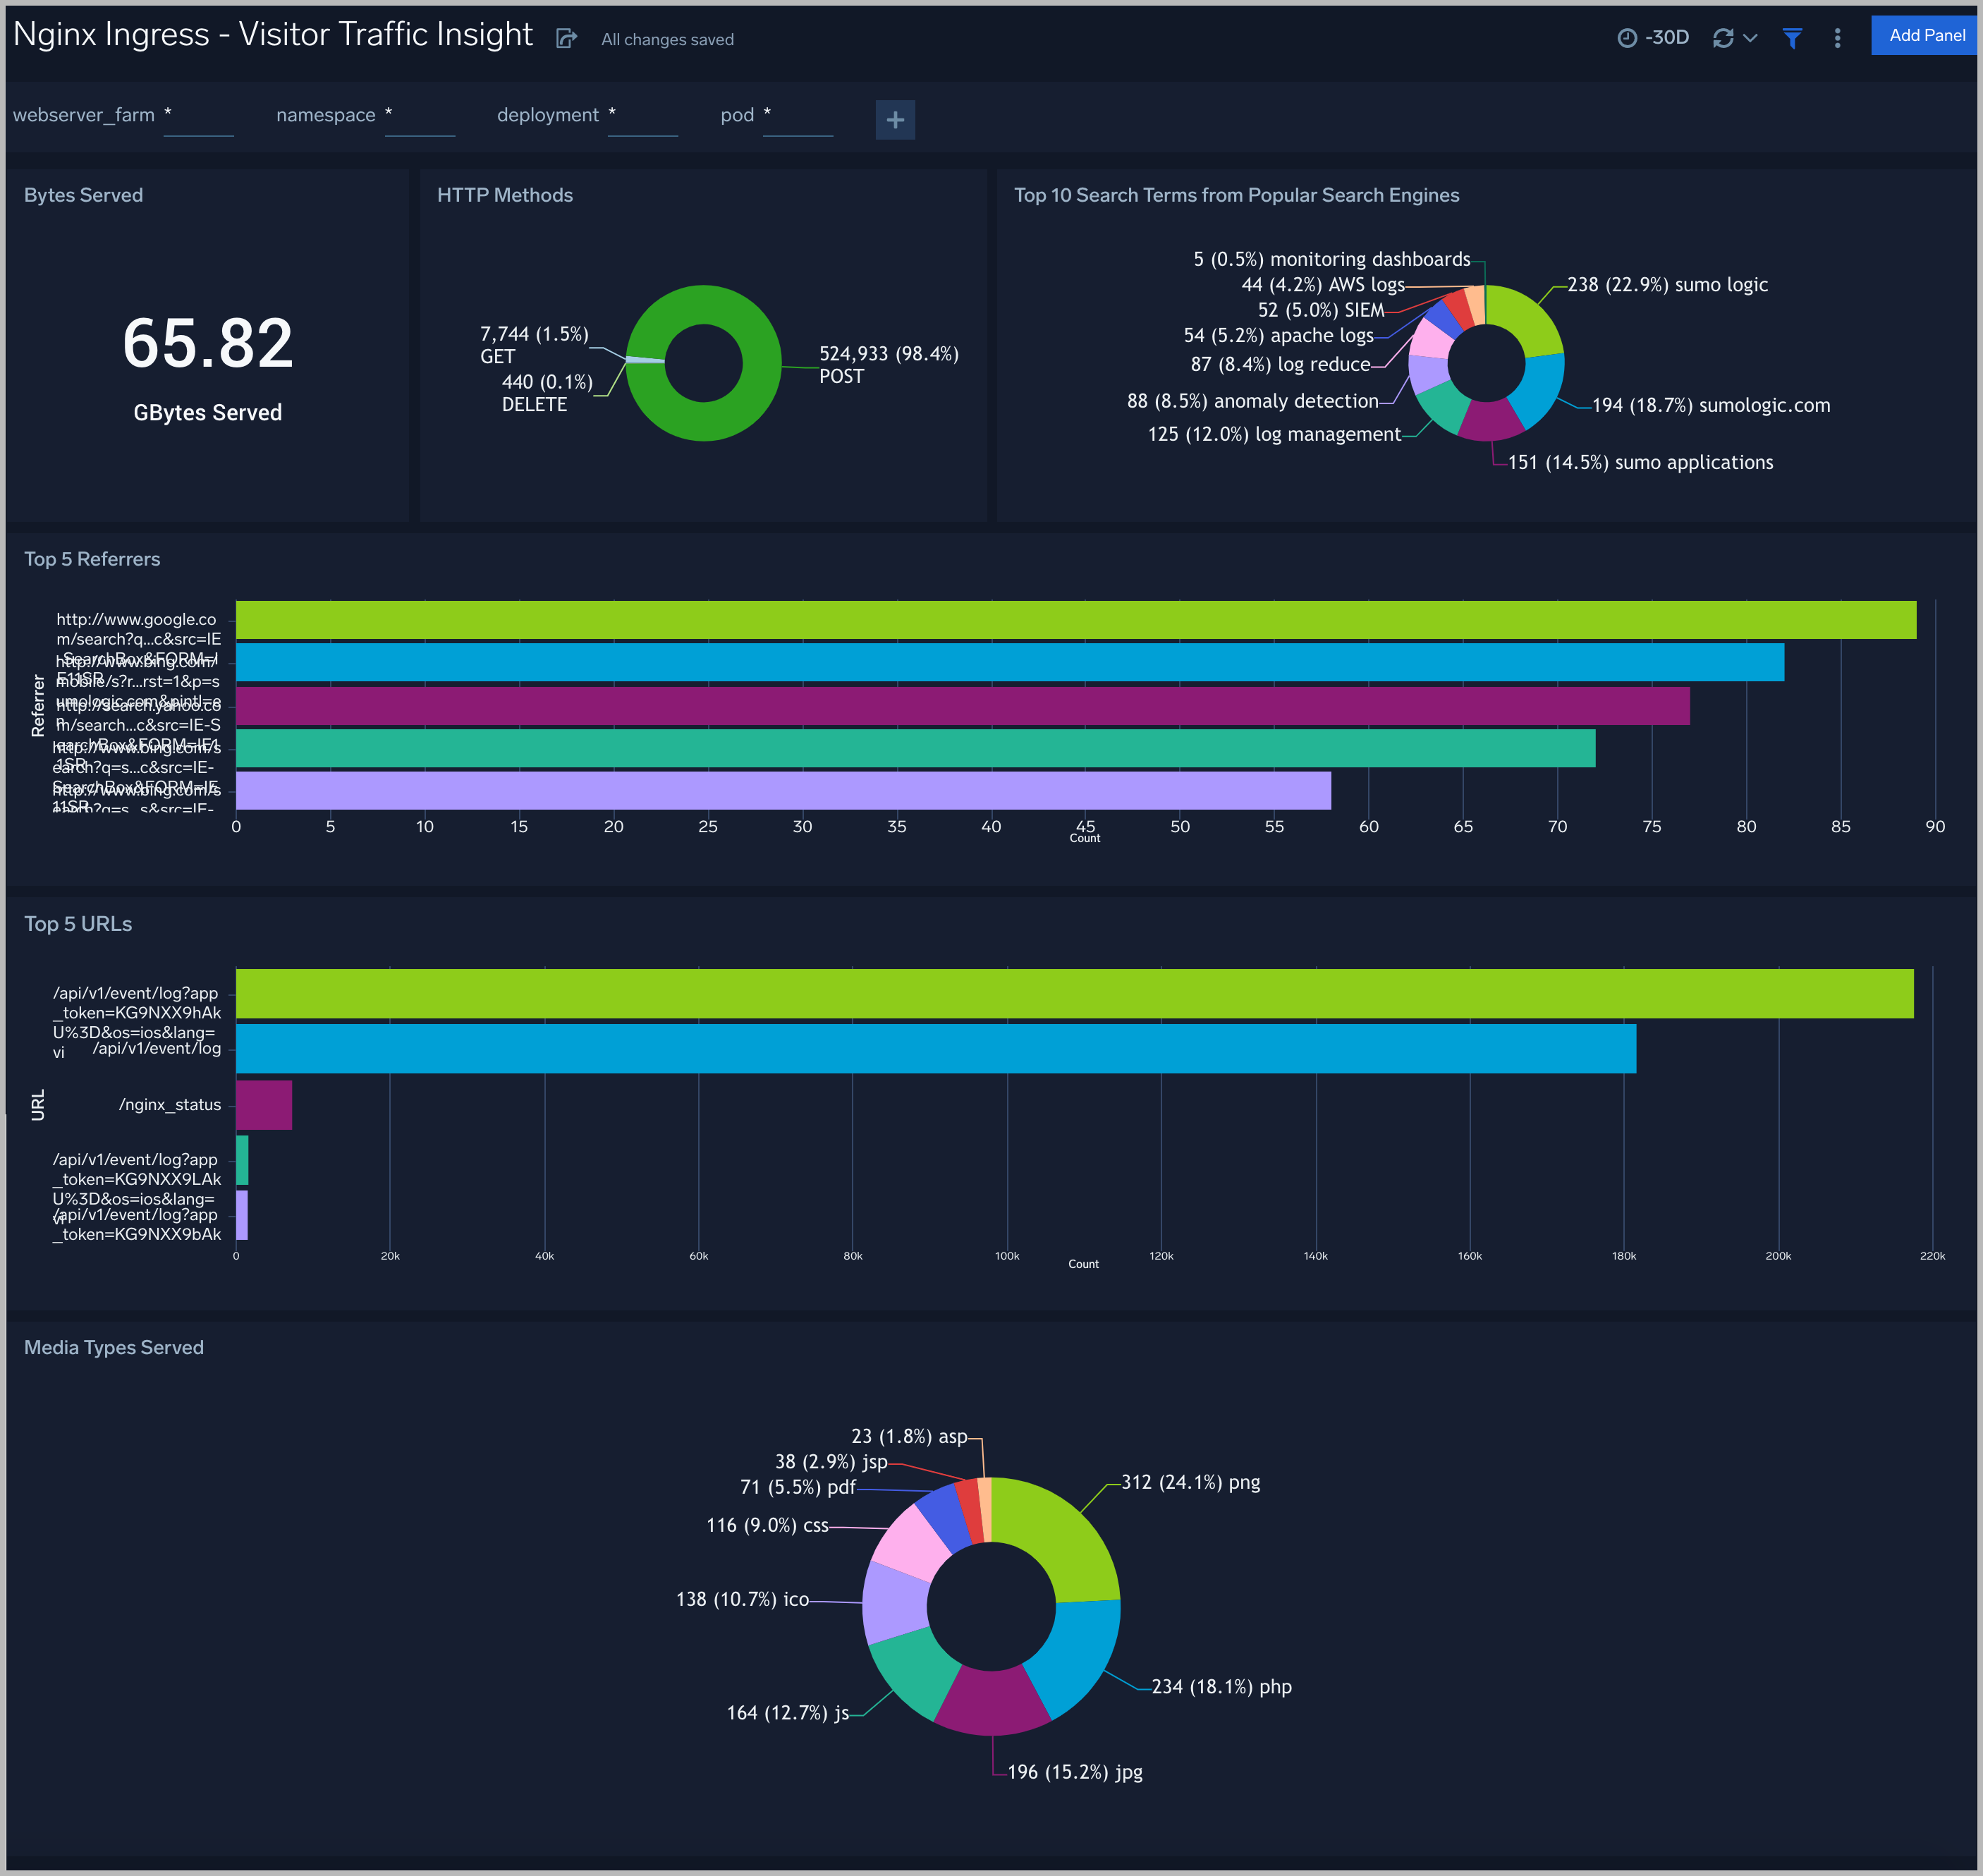
Visitor Traffic Insight
The Nginx Ingress - Visitor Traffic Insight dashboard provides detailed information on the top documents accessed, top referrers, top search terms from popular search engines, and the media types served.
Use this dashboard to:
- To understand the type of content that is frequently requested by users.
- It helps in allocating IT resources according to the content types.
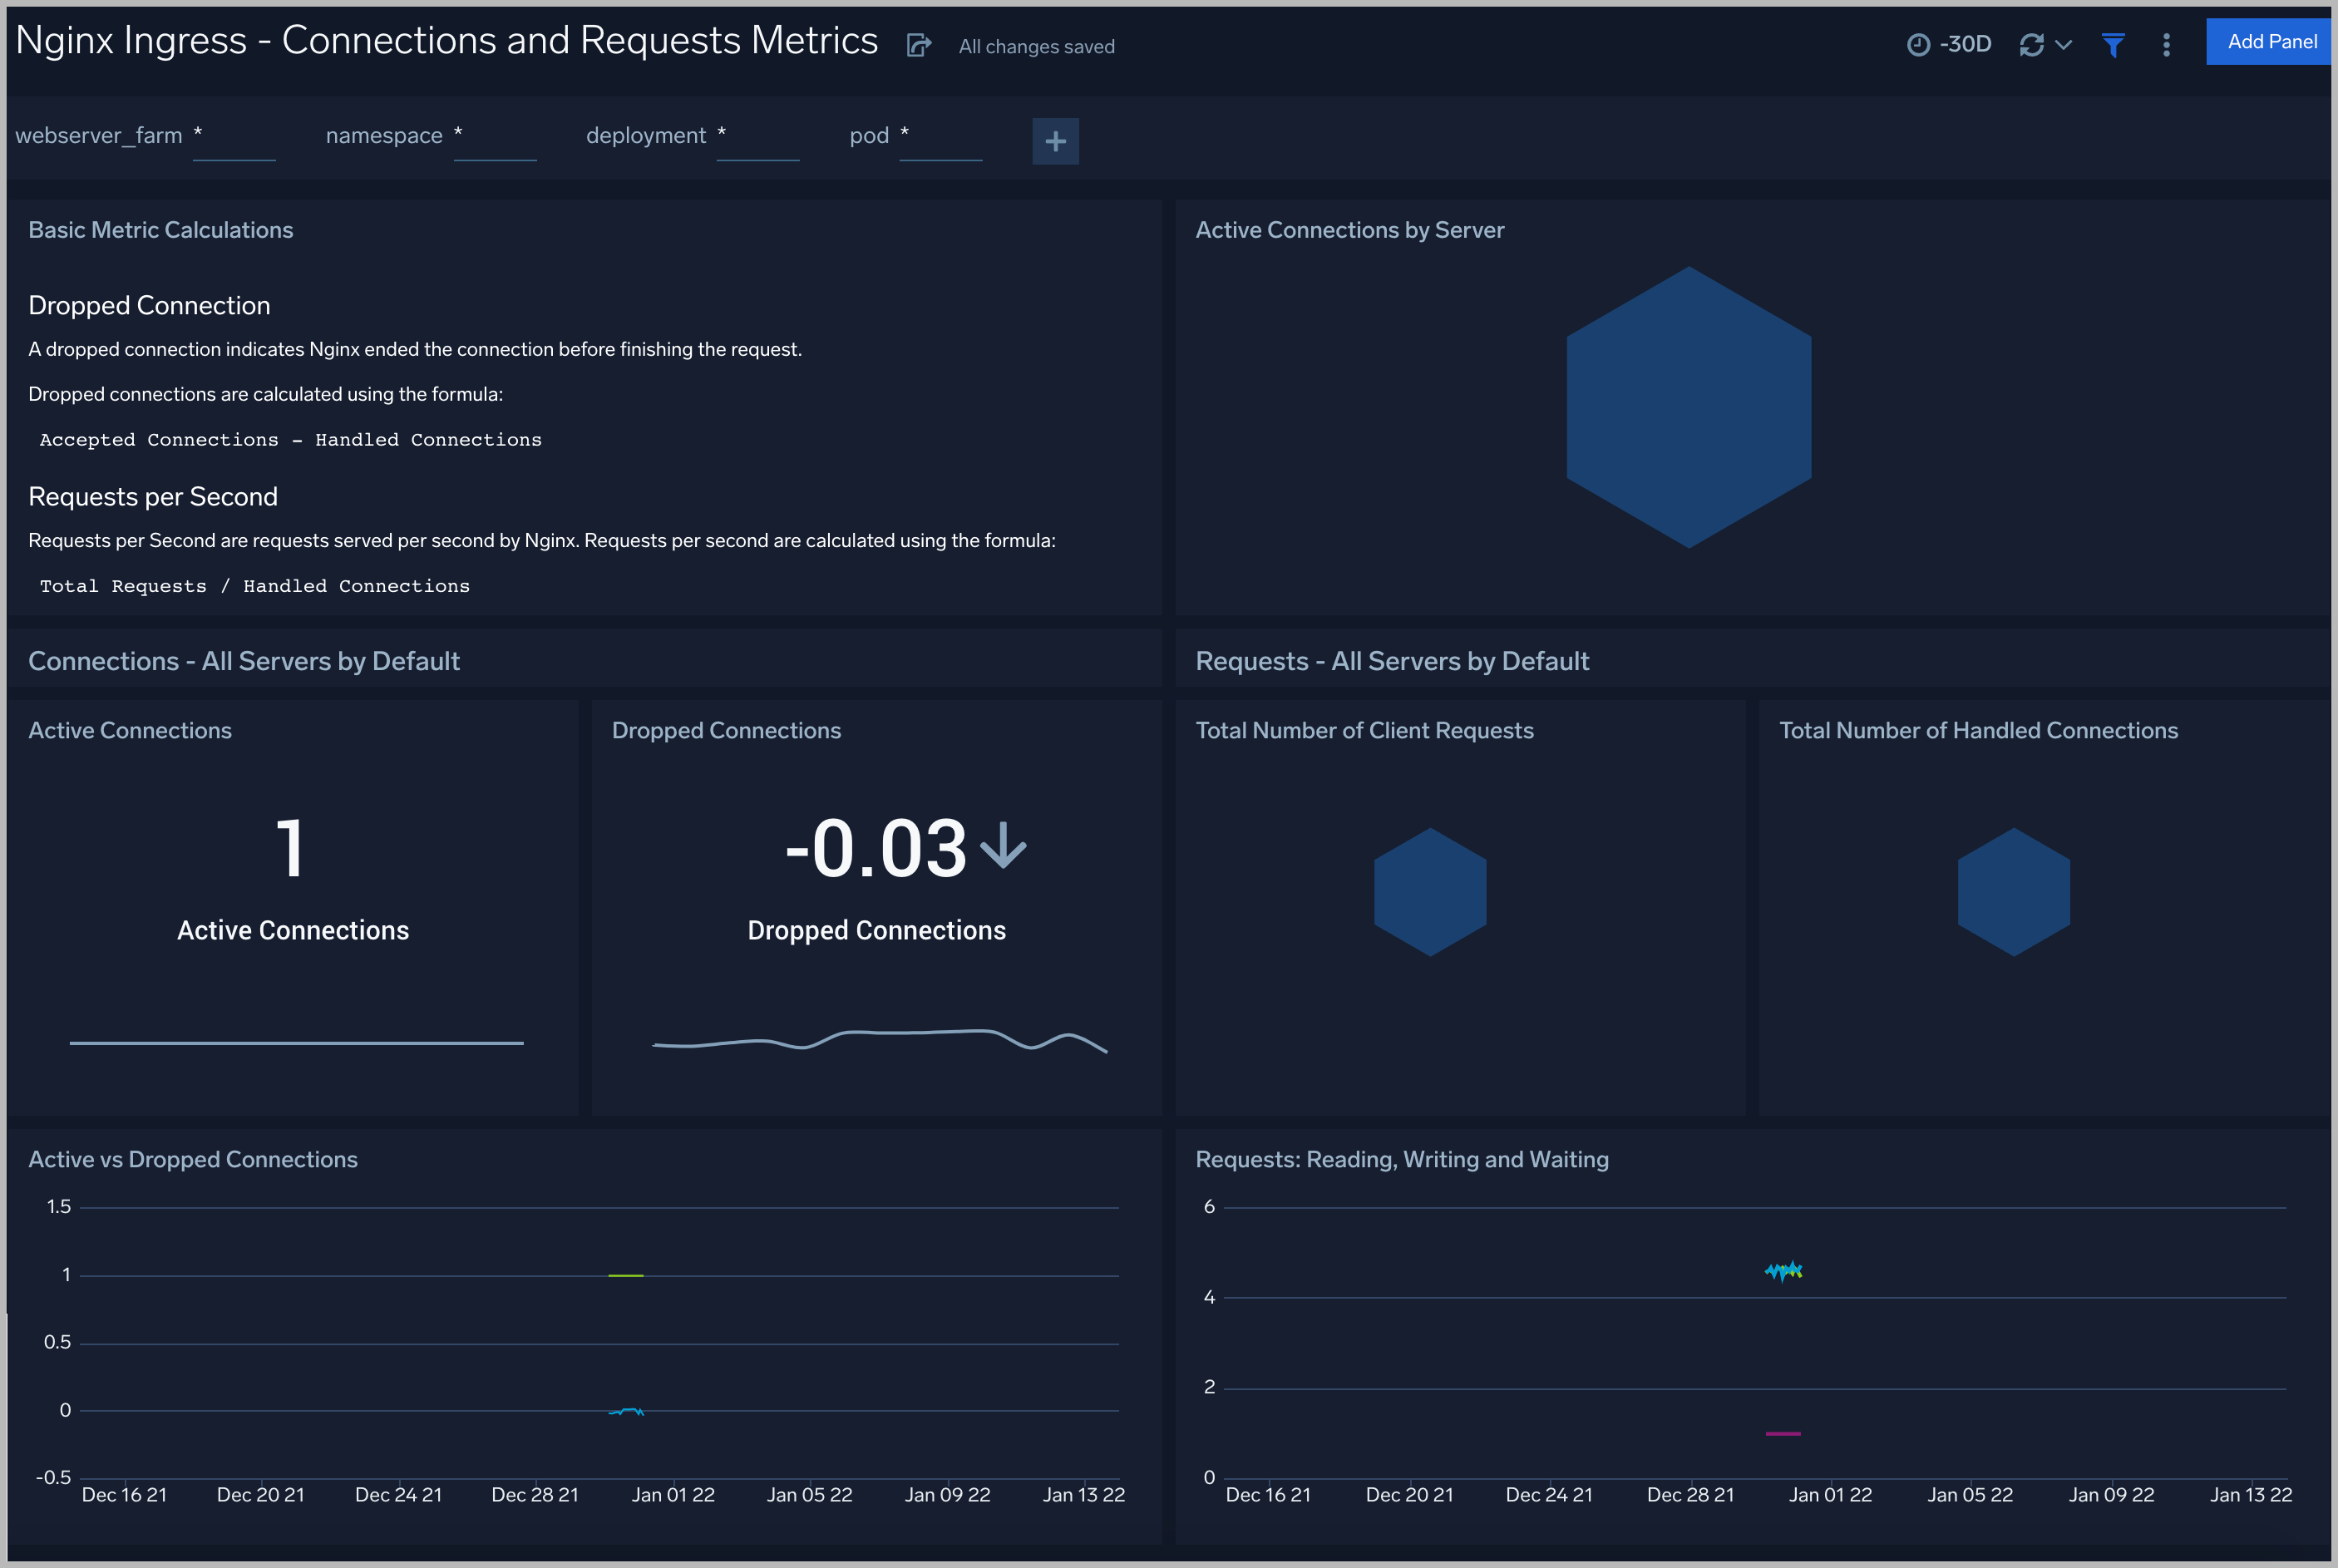
Connections and Requests Metrics
The Nginx Ingress - Connections and Requests Metrics dashboard provides insight into active, dropped connections, reading, writing, and waiting requests.
Use this dashboard to:
- Gain information about active and dropped connections. This helps you identify the connection rejected by Nginx Server.
- Gain information about the total requests handled by Nginx Server per second. This helps you understand read, write requests on Nginx Server.
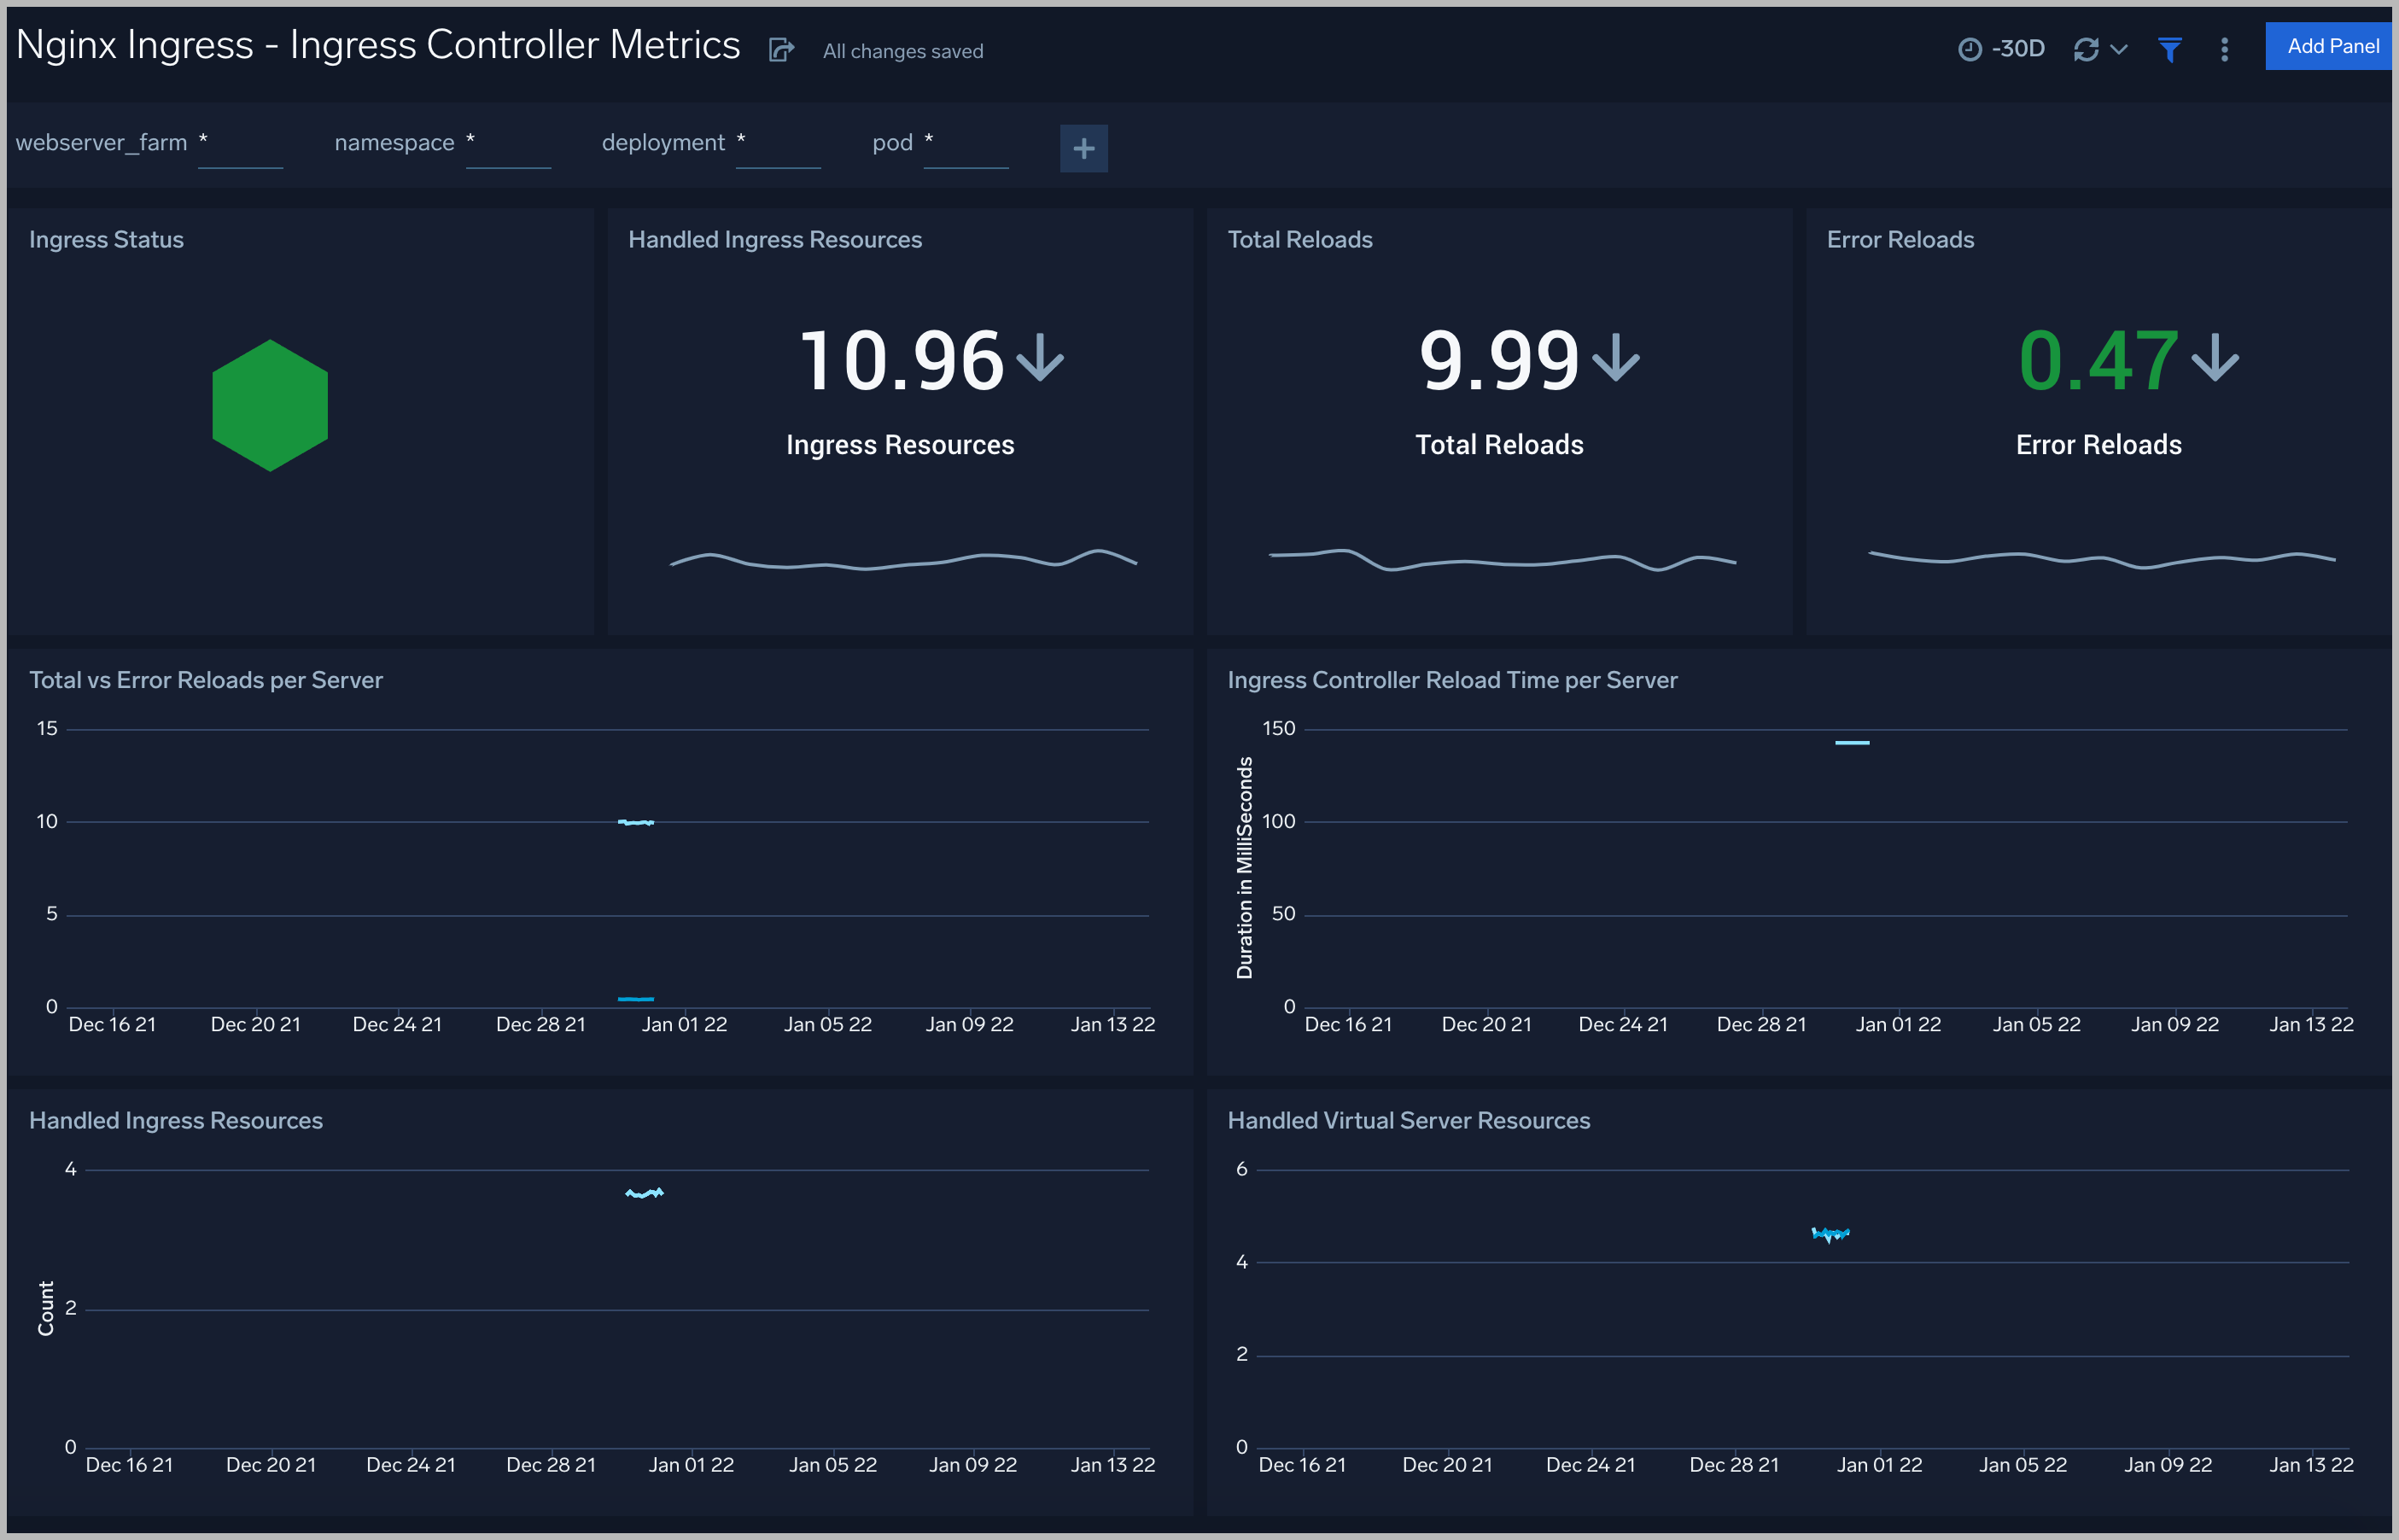
Controller Metrics
The Nginx Ingress - Ingress Controller Metrics dashboard gives you insight on the status, reloads, failure of kubernetes Nginx ingress controller.
Use this dashboard to:
- Gain information about Nginx ingress Controller status and reloads. This helps you understand the availability of Nginx Ingress controllers.
- Gain information about Nginx reload time and any reload errors.
Nginx Ingress Alerts
Sumo Logic has provided out-of-the-box alerts available via Sumo Logic monitors to help you quickly determine if the Nginx server is available and performing as expected. These alerts are built based on logs and metrics datasets and have preset thresholds based on industry best practices and recommendations. They are as follows:
| Alert Type (Metrics/Logs) | Alert Name | Alert Description | Trigger Type (Critical / Warning) | Alert Condition | Recover Condition |
|---|---|---|---|---|---|
| Logs | Nginx Ingress - Access from Highly Malicious Sources | This alert fires when an Nginx Ingress server is accessed from highly malicious IP addresses. | Critical | > 0 | < = 0 |
| Logs | Nginx Ingress - High Client (HTTP 4xx) Error Rate | This alert fires when there are too many HTTP requests (>5%) with a response status of 4xx. | Critical | > 0 | 0 |
| Logs | Nginx Ingress - High Server (HTTP 5xx) Error Rate | This alert fires when there are too many HTTP requests (>5%) with a response status of 5xx. | Critical | > 0 | 0 |
| Logs | Nginx Ingress - Critical Error Messages | This alert fires when we detect critical error messages for a given Nginx Ingress server. | Critical | > 0 | 0 |
| Metrics | Nginx Ingress - Dropped Connections | This alert fires when we detect dropped connections for a given Nginx Ingress server. | Critical | > 0 | 0 |