Amazon Kinesis - Streams
Amazon Kinesis is a platform for streaming data on AWS. It makes it easy to load and analyze streaming data, and it provides the ability for you to build custom streaming data applications for your needs. Amazon Kinesis Streams is used to collect and process large streams of data records in real time. The Sumo Logic app for Amazon Kinesis - Streams is a unified logs and metrics (ULM) app which provides information on the events and metrics. The preconfigured dashboards help you monitor the events, API calls, errors, incoming and outgoing records, latencies, and throughput of Kinesis Streams.
Log and Metrics types
For more information on Amazon Kinesis - Streams, see here.
The app uses Kinesis logs and metrics for:
- Kinesis CloudWatch Metrics. For details, see here.
- Kinesis operations using AWS CloudTrail. For details, see here.
Sample log messages
 {
    "eventVersion":"1.01",
    "userIdentity":{
       "type":"IAMUser",
       "principalId":"EX_PRINCIPAL_ID",
       "arn":"arn:aws:iam::012345678910:user/Alice",
       "accountId":"012345678910",
       "accessKeyId":"vmLwWTxSQrcvzD",
       "userName":"Gosia"
    },
    "eventTime":"2017-11-01T21:23:30+0000",
    "errorCode":"LimitExceedException",
    "errorMessage":"Rate exceeded for stream CWL-Kinesis under account 656757657843",
    "eventSource":"kinesis.amazonaws.com",
    "eventName":"MergeShards",
    "awsRegion":"us-east-2 ",
    "sourceIPAddress":"187.185.157.125",
    "userAgent":"aws-sdk-java/unknown-version Linux/x.xx",
    "requestParameters":{
       "streamName":"GoodStream",
       "adjacentShardToMerge":"shardId-000000000002",
       "shardToMerge":"shardId-000000000001"
    },
    "responseElements":null,
    "requestID":"e9f9c8eb-c757-11e3-bf1d-6948db3cd570",
    "eventID":"77cf0d06-ce90-42da-9576-71986fec411f"
 }
Sample queries
_sourceCategory=aws/kinesis* "kinesis.amazonaws.com" errorCode
| json field=_raw "eventSource", "eventName", "awsRegion", "sourceIPAddress","userAgent" nodrop
| json field=_raw "requestParameters.streamName" as streamName nodrop
| json field=_raw "userIdentity.sessionContext.sessionIssuer.userName" as userName nodrop
| json field=_raw "userIdentity.userName" as userName nodrop
| json field=_raw "errorCode" as error_code nodrop
| json field=_raw "errorMessage" as error_msg nodrop
| where eventSource="kinesis.amazonaws.com"
| count by error_code, error_msg, eventName, userName, sourceIPAddress
Collecting logs and metrics for the Amazon Kinesis - Streams app
Collecting Metrics
- Configure a Hosted Collector.
- Configure an Amazon CloudWatch Source for Metrics.
- Name. Enter a name to display for the new Source.
- Description. Enter an optional description.
- Regions. Select your Amazon Regions for Kinesis.
- Namespaces. Select AWS/Kinesis.
- Source Category. Enter a source category. For example, kinesis_metrics.
- Access Key ID and Secret Access Key. Enter your Amazon Access Key ID and Secret Access Key.
- Scan Interval. Use the default of 5 minutes, or enter the frequency Sumo Logic will scan your CloudWatch Sources for new data.
- Click Save.
Collect Amazon Kinesis - Streams Events using CloudTrail
- To your Hosted Collector, add an AWS CloudTrail Source.
- Name. Enter a name to display for the new Source.
- Description. Enter an optional description.
- S3 Region. Select the Amazon Region for your Kinesis S3 bucket.
- Bucket Name. Enter the exact name of your Kinesis S3 bucket.
- Path Expression. Enter the string that matches the S3 objects you'd like to collect. You can use a wildcard (*) in this string. (DO NOT use a leading forward slash. See Amazon Path Expressions.) The S3 bucket name is not part of the path. Don’t include the bucket name when you are setting the Path Expression.
- Source Category. Enter a source category. For example, kinesis_event.
- Access Key ID and Secret Access Key. Enter your Amazon Access Key ID and Secret Access Key.
- Scan Interval. Use the default of 5 minutes. Alternately, enter the frequency Sumo Logic will scan your S3 bucket for new data.
- Enable Timestamp Parsing. Select the Extract timestamp information from log file entries check box.
- Time Zone. Select Ignore time zone from the log file and instead use, and select UTC from the dropdown.
- Timestamp Format. Select Automatically detect the format.
- Enable Multiline Processing. Select the Detect messages spanning multiple lines check box, and select Infer Boundaries.
- Click Save.
Installing the Amazon Kinesis - Streams app
To install the app, do the following:
- Select App Catalog.
- In the 🔎 Search Apps field, run a search for your desired app, then select it.
- Click Install App.
note
Sometimes this button says Add Integration.
- Click Next in the Setup Data section.
- In the Configure section of your respective app, complete the following fields.
- Key. Select either of these options for the data source.
- Choose Source Category and select a source category from the list for Default Value.
- Choose Custom, and enter a custom metadata field. Insert its value in Default Value.
- Key. Select either of these options for the data source.
- Click Next. You will be redirected to the Preview & Done section.
Post-installation
Once your app is installed, it will appear in your Installed Apps folder, and dashboard panels will start to fill automatically.
Each panel slowly fills with data matching the time range query and received since the panel was created. Results will not immediately be available, but will update with full graphs and charts over time.
Viewing Amazon Kinesis - Streams dashboards
All dashboards have a set of filters that you can apply to the entire dashboard. Use these filters to drill down and examine the data to a granular level.
- You can change the time range for a dashboard or panel by selecting a predefined interval from a drop-down list, choosing a recently used time range, or specifying custom dates and times. Learn more.
- You can use template variables to drill down and examine the data on a granular level. For more information, see Filtering Dashboards with Template Variables.
- Most Next-Gen apps allow you to provide the scope at the installation time and are comprised of a key (
_sourceCategoryby default) and a default value for this key. Based on your input, the app dashboards will be parameterized with a dashboard variable, allowing you to change the dataset queried by all panels. This eliminates the need to create multiple copies of the same dashboard with different queries.
Events
See the details of Kinesis events including the count over time, location, API calls, errors, and users.
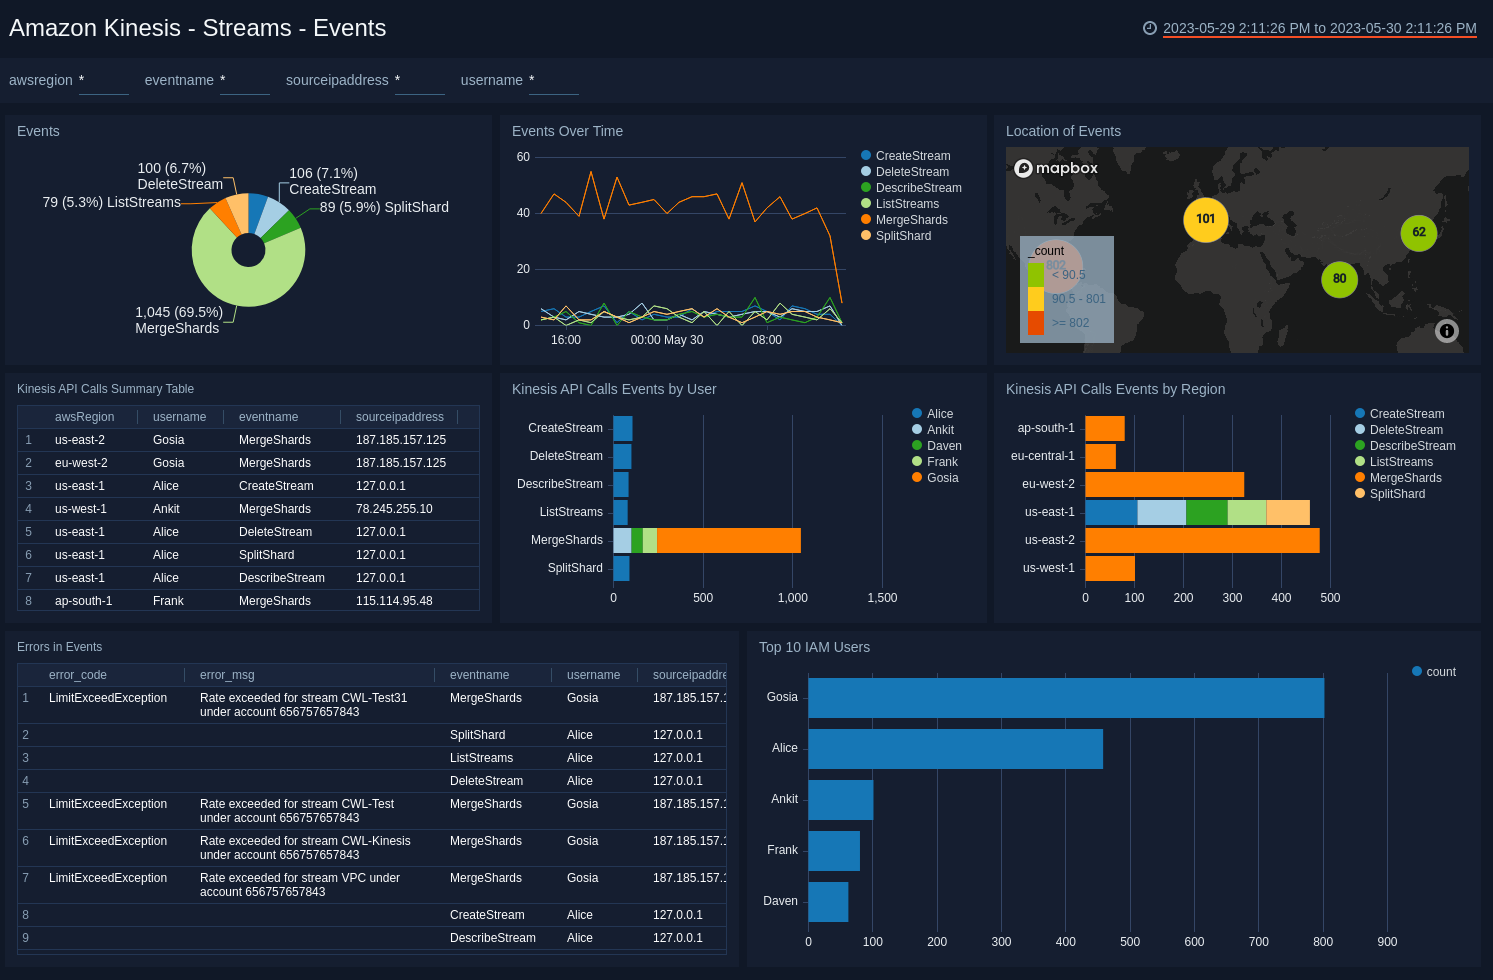
Events. See the count and percentage of different events in Kinesis in the last 24 hours on a pie chart.
Events Over Time. See the count of different events over time in the last 24 hours on a line chart.
Location of Events. See the count of events in the last 24 hours on a world map.
Kinesis API Calls Summary Table. See the summary of Kinesis API calls in the last 24 hours including the AWS region, username, event name, source IP address, and count, displayed in a table.
Kinesis API Calls Events by User. See the count of Kinesis API calls events by user in the last 24 hours on a bar chart.
Kinesis API Calls Events by Region. See the count of Kinesis API calls events by AWS region in the last 24 hours on a bar chart.
Errors in Events. See the details of errors in the events in the last 24 hours including the error code, error message, event name, username, source IP address, and count, displayed in a table.
Top 10 IAM Users. See the top 10 IAM users along with the count in the last 24 hours on a bar chart.
Metrics
See the details of the Kinesis metrics including the incoming bytes, incoming records, get records, put and get latency, write and read provisioned throughput exceeded, and iterator age.
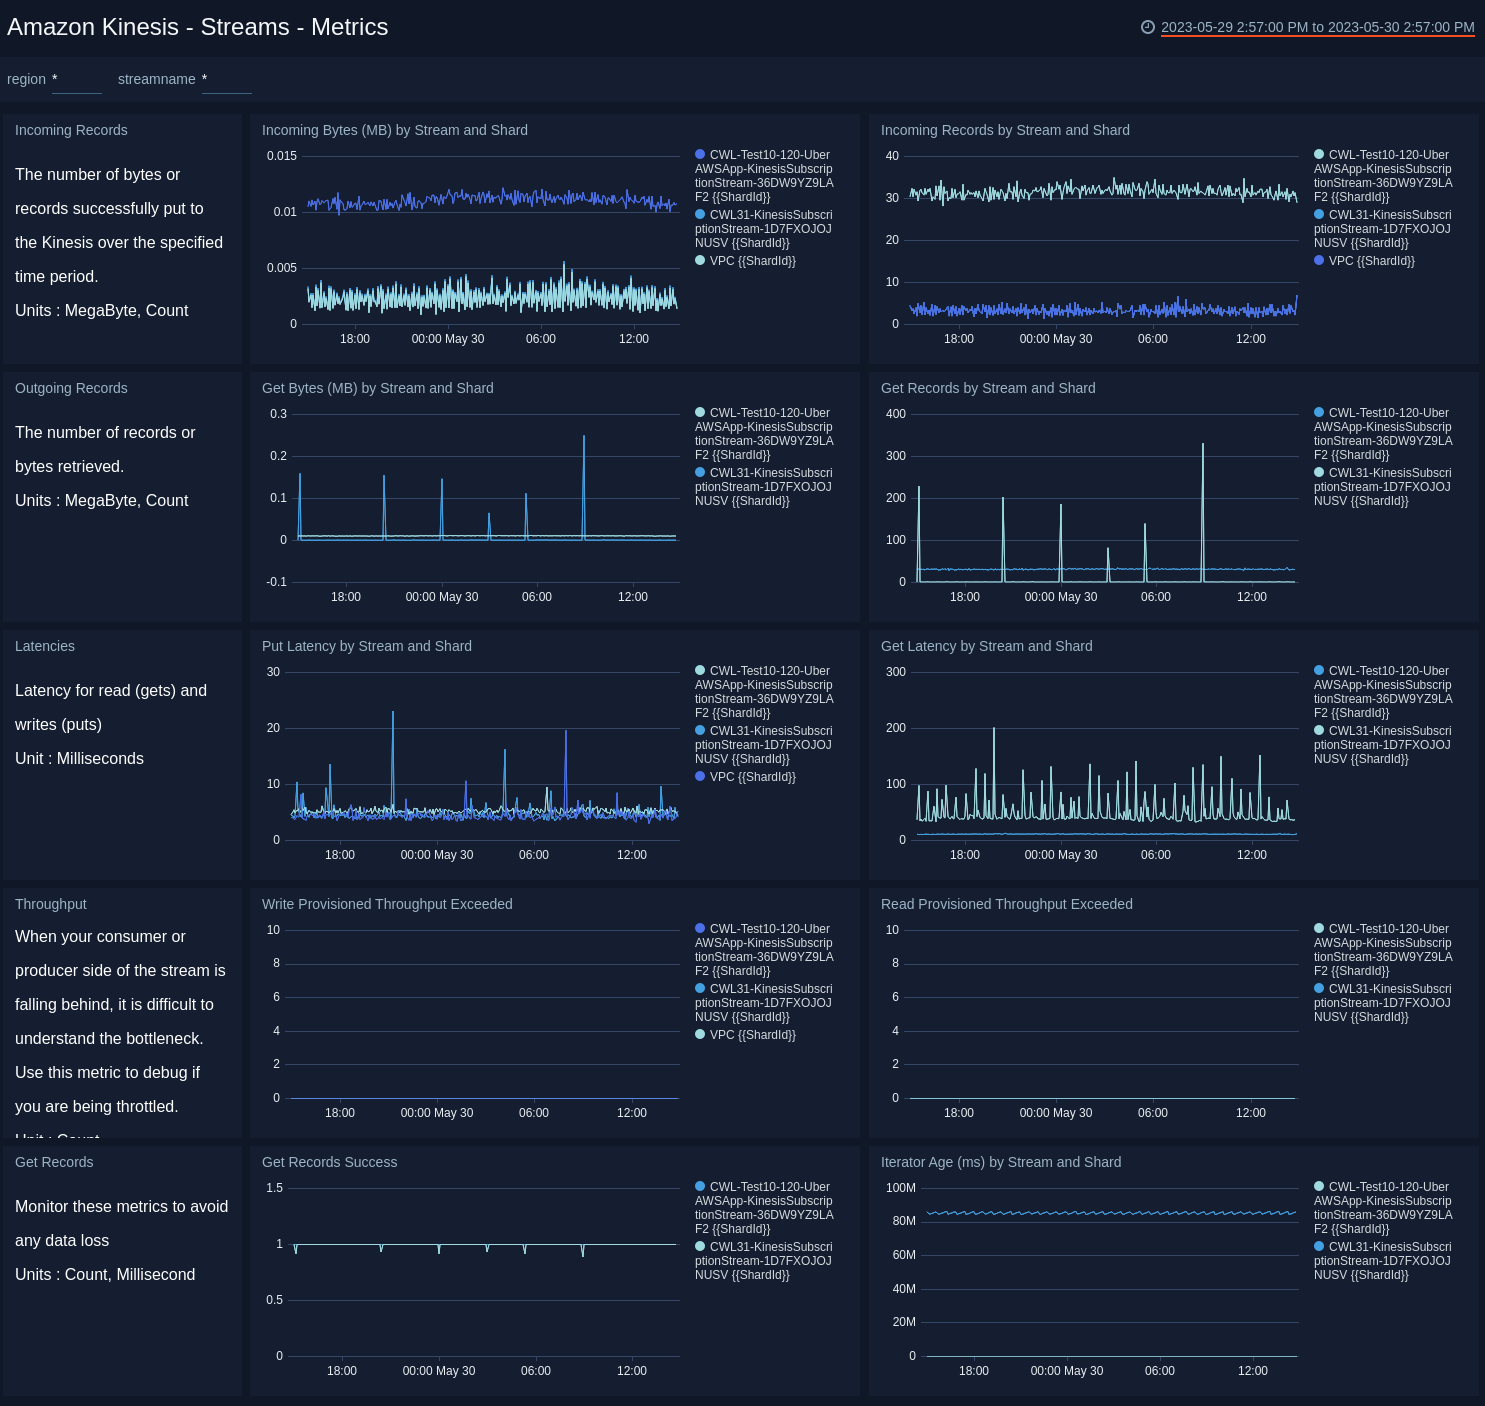
Incoming Bytes (MB) by Stream and Shard. See the sum of the metric incoming bytes in MB by stream and shard for the last 24 hours on a line chart.
Incoming Records by Stream and Shard. See the sum of the metric incoming records by stream and shard for the last 24 hours on a line chart.
Get Bytes (MB) by Stream and Shard. See the sum of the metric get bytes in MB by stream and shard for the last 24 hours on a line chart.
Get Records by Stream and Shard. See the sum of the metric get records by stream and shard for the last 24 hours on a line chart.
Put Latency by Stream and Shard. See the average of the metric put latency by stream and shard for the last 24 hours on a line chart.
Get Latency by Stream and Shard. See the average of the metric get latency by stream and shard for the last 24 hours on a line chart.
Write Provisioned Throughput Exceeded. See the average of the metric write provisioned throughput exceeded for the last 24 hours on a line chart.
Read Provisioned Throughput Exceeded. See the average of the metric read provisioned throughput exceeded for the last 24 hours on a line chart.
Get Records Success. See the average of the metric get records success for the last 24 hours on a line chart.
Iterator Age (ms) by Stream and Shard. See the maximum of the metric iterator age in milliseconds by stream and shard for the last 24 hours on a line chart.
Upgrading the Amazon Kinesis - Streams app (Optional)
To update the app, do the following:
- Select App Catalog.
- In the Search Apps field, search for and then select your app.
Optionally, you can identify apps that can be upgraded in the Upgrade available section. - To upgrade the app, click Upgrade.
- If the upgrade does not have any configuration or property changes, you will be redirected to the Preview & Done section.
- If the upgrade has any configuration or property changes, you will be redirected to Setup Data page.
- In the Configure section of your respective app, complete the following fields.
- Key. Select either of these options for the data source.
- Choose Source Category and select a source category from the list for Default Value.
- Choose Custom and enter a custom metadata field. Insert its value in Default Value.
- Key. Select either of these options for the data source.
- Click Next. You will be redirected to the Preview & Done section.
- In the Configure section of your respective app, complete the following fields.
Post-update
Your upgraded app will be installed in the Installed Apps folder, and dashboard panels will start to fill automatically.
See our Release Notes changelog for new updates in the app.
Uninstalling the Amazon Kinesis - Streams app (Optional)
To uninstall the app, do the following:
- Select App Catalog.
- In the 🔎 Search Apps field, run a search for your desired app, then select it.
- Click Uninstall.