Apache Tomcat - OpenTelemetry Collector

The Apache Tomcat app is a unified logs and metrics app that helps you monitor the availability, performance, health, and resource utilization of your Apache Tomcat servers. Preconfigured dashboards provide insight into visitor locations, traffic patterns, errors, resource utilization, garbage collection, web server operations, and access from known malicious sources.
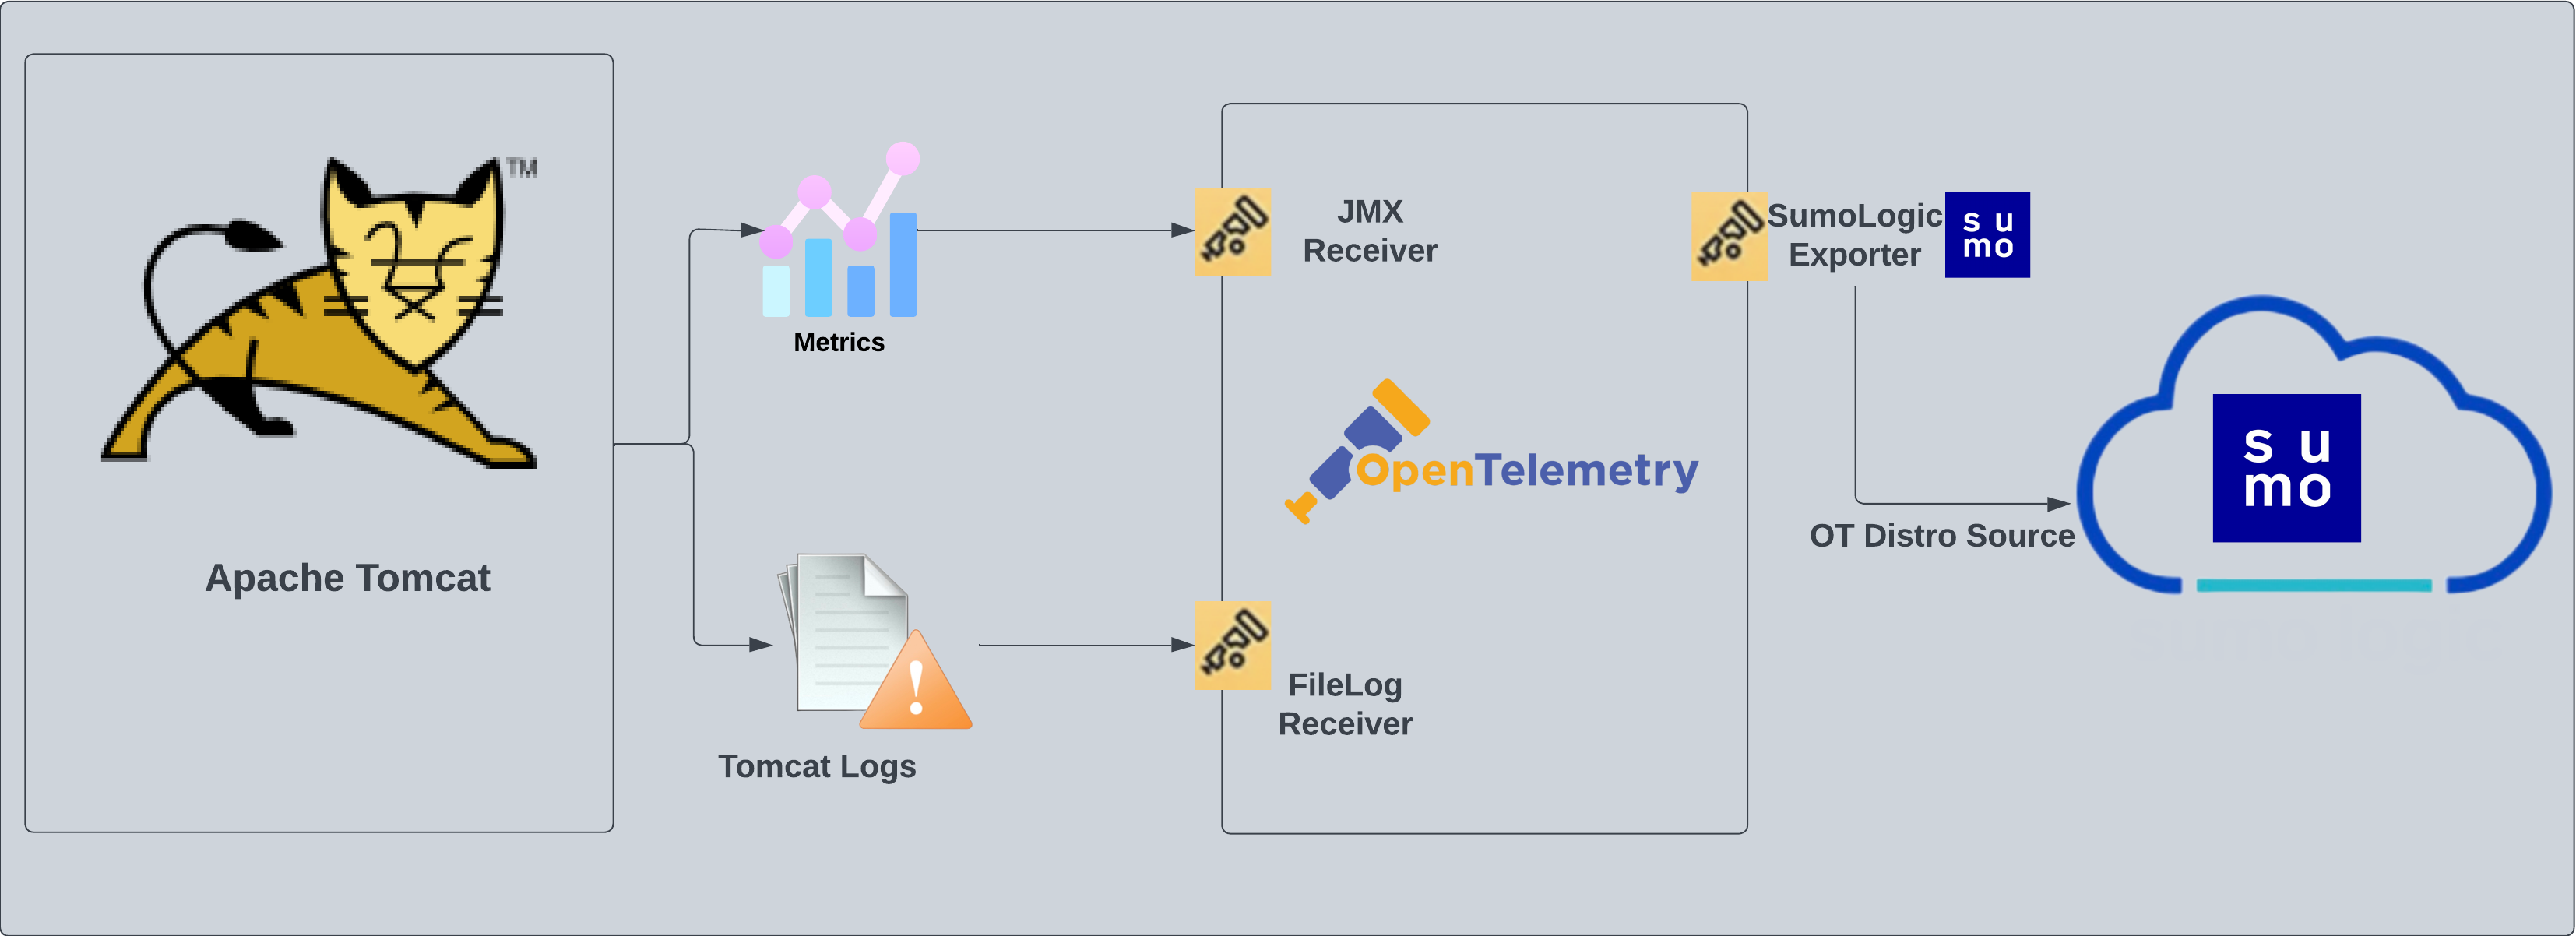
Tomcat logs are sent to Sumo Logic through the OpenTelemetry filelog receiver and metrics are sent through the JMX receiver with the target_system set as tomcat.
Fields Created in Sumo Logic for Tomcat
The following are the Fields that will be created as part of the Tomcat App install, if not already present.
sumo.datasource. Has a fixed value oftomcat.deployment.environment. User configured. This is the deployment environment where the Tomcat cluster resides. For example:dev,prodorqa.webengine.cluster.name. User configured. Set a value of the cluster where your Tomcat instance resides. This will be tagged along with the data sent to Sumo Logic.webengine.system. Has a fixed value oftomcat.webengine.node.name. Holds the value of the Fully Qualified Domain Name (FQDN) of the machine from which the OpenTelemetry collector is collecting logs and metrics.
Prerequisites
For metric collection
JMX receiver collects Tomcat metrics from Tomcat server as part of the OpenTelemetry Collector (OTC).
-
Follow the instructions in JMX - OpenTelemetry's prerequisites section to download the JMX Metric Gatherer. This gatherer is used by the JMX Receiver.
-
Set the JMX port by setting it as part of
JAVA_OPTSfor Tomcat startup. Usually it is set in the/etc/systemd/system/tomcat.serviceorC:\Program Files\apache-tomcat\bin\tomcat.batfile.JAVA_OPTS="$JAVA_OPTS -Dcom.sun.management.jmxremote -Dcom.sun.management.jmxremote.port=11099 -Dcom.sun.management.jmxremote.authenticate=true -Dcom.sun.management.jmxremote.ssl=false -Dcom.sun.management.jmxremote.password.file=${TOMCAT_CONF_DIR}/jmx.password -Dcom.sun.management.jmxremote.access.file=${TOMCAT_CONF_DIR}/jmx.access"
For log collection
The Sumo Logic app for Apache Tomcat uses three types of logs:
- Tomcat Access logs. Log format description. Recommended pattern used is pattern="common".
- Tomcat Catalina.out logs. Log format description
- Tomcat Garbage Collection (GC) logs. Log format description
By default, Tomcat logs are stored in /usr/share/tomcat/logs/ The default directory for log files is listed in the /usr/share/tomcat/conf/logging.properties file.
For Linux systems with ACL Support, the otelcol install process should have created the ACL grants necessary for the otelcol system user to access default log locations. You can verify the active ACL grants using the getfacl command. Install the ACL in your Linux environment, if not installed.
The required ACL may not be supported for some rare cases, for example, Linux OS Distro, which is officially not supported by Sumo Logic. In this case, you can run the following command to explicitly grant the permissions.
sudo setfacl -R -m d:u:otelcol-sumo:r-x,d:g:otelcol-sumo:r-x,u:otelcol-sumo:r-x,g:otelcol-sumo:r-x <PATH_TO_LOG_FILE>
Run the above command for all the log files in the directory that need to be ingested, which are not residing in the default location.
If Linux ACL Support is not available, traditional Unix-styled user and group permission must be modified. It should be sufficient to add the otelcol system user to the specific group that has access to the log files.
For Windows systems, log files which are collected should be accessible by the SYSTEM group. Use the following set of PowerShell commands if the SYSTEM group does not have access.
$NewAcl = Get-Acl -Path "<PATH_TO_LOG_FILE>"
# Set properties
$identity = "NT AUTHORITY\SYSTEM"
$fileSystemRights = "ReadAndExecute"
$type = "Allow"
# Create new rule
$fileSystemAccessRuleArgumentList = $identity, $fileSystemRights, $type
$fileSystemAccessRule = New-Object -TypeName System.Security.AccessControl.FileSystemAccessRule -ArgumentList $fileSystemAccessRuleArgumentList
# Apply new rule
$NewAcl.SetAccessRule($fileSystemAccessRule)
Set-Acl -Path "<PATH_TO_LOG_FILE>" -AclObject $NewAcl
Collection configuration and app installation
As part of data collection setup and app installation, you can select the App from App Catalog and click on Install App. Follow the steps below.
Step 1: Set up Collector
If you want to use an existing OpenTelemetry Collector, you can skip this step by selecting the Use an existing Collector option.
To create a new Collector:
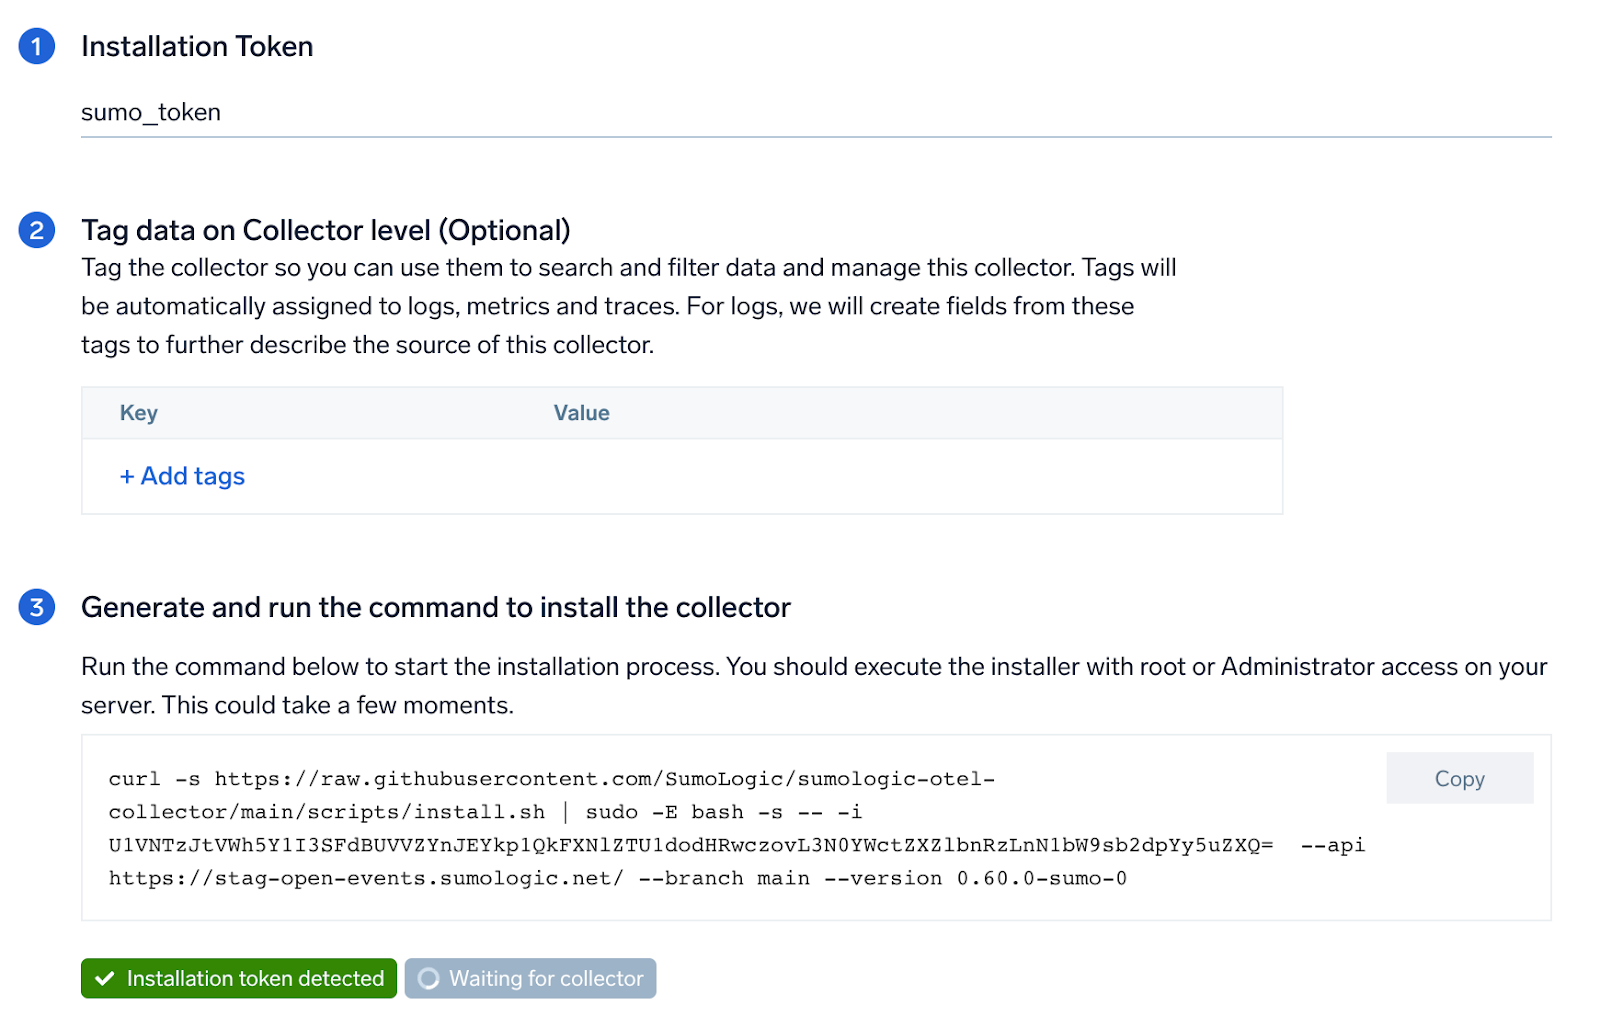
- Select the Add a new Collector option.
- Select the platform where you want to install the Sumo Logic OpenTelemetry Collector.
This will generate a command that you can execute in the machine environment you need to monitor. Once executed, it will install the Sumo Logic OpenTelemetry Collector.
Step 2: Configure integration
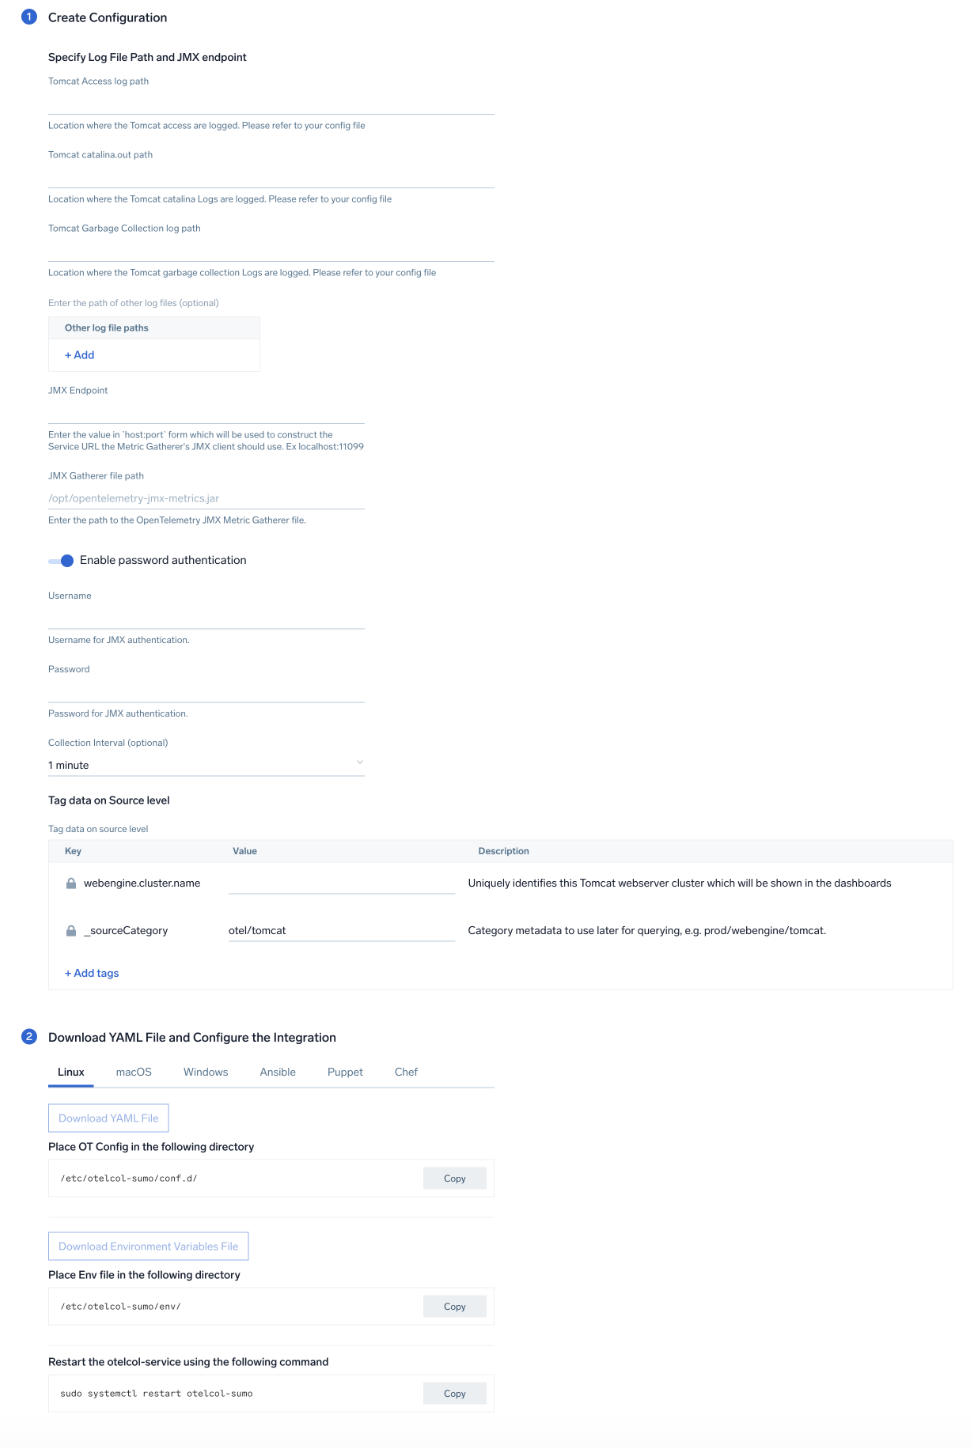
In this step, you will configure the YAML required for Tomcat Collection.
The path of the log file configured to capture Tomcat logs is needed to be given here.
The files are typically located in /usr/share/tomcat/logs/*. If you're using a customized path, check the Tomcat.conf file for this information.
For metrics, you're required to provide the JMX endpoint (default is localhost:11099) along with the collection_interval (default is 1 minute).
You can add any custom fields which you want to tag along with the data ingested in Sumo Logic. Click the Download YAML File button to get the YAML file.
Step 3: Send logs and metrics to Sumo Logic
Once you have downloaded the yaml file as described in the previous step, follow the below steps based on your platform.
- Linux
- Windows
- macOS
- Chef
- Ansible
- Puppet
- Copy the YAML file to
/etc/otelcol-sumo/conf.d/folder in the Tomcat instance which needs to be monitored. - Restart the collector using:
sudo systemctl restart otelcol-sumo
- Copy the YAML file to
C:\ProgramData\Sumo Logic\OpenTelemetry Collector\config\conf.dfolder in the machine which needs to be monitored. - Restart the collector using:
Restart-Service -Name OtelcolSumo
- Copy the YAML file to
/etc/otelcol-sumo/conf.d/folder in the Tomcat instance which needs to be monitored. - Restart the otelcol-sumo process using the below command:
otelcol-sumo --config /etc/otelcol-sumo/sumologic.yaml --config "glob:/etc/otelcol-sumo/conf.d/*.yaml"
- Copy the yaml file into your Chef cookbook files directory
files/<downloaded_yaml_file>. - Use a Chef file resource in a recipe to manage it.
cookbook_file '/etc/otelcol-sumo/conf.d/<downloaded_yaml_file>' do mode 0644 notifies :restart, 'service[otelcol-sumo]', :delayed end - Add the recipe to your collector setup to start collecting the data. Every team typically has their established way of applying the Chef recipe. The resulting Chef recipe should look something like:
cookbook_file '/etc/otelcol-sumo/conf.d/<downloaded_yaml_file>' do
mode 0644
notifies :restart, 'service[otelcol-sumo]', :delayed
end
- Place the file into your Ansible playbook files directory.
- Run the Ansible playbook.
ansible-playbook -i inventory install_sumologic_otel_collector.yaml
-e '{"installation_token": "<YOUR_TOKEN>", "collector_tags": {<YOUR_TAGS>}, "src_config_path": "files/conf.d"}'
- Place the file into your Puppet module files directory
modules/install_otel_collector/files/<downloaded_yaml>. - Use a Puppet file resource to manage it.
file { '/etc/otelcol-sumo/conf.d/<downloaded_yaml_file>':
    ensure => present,
    source => 'puppet:///modules/install_otel_collector/<downloaded_yaml_file>',
    mode => '0644',
    notify => Service[otelcol-sumo],
} - Apply the Puppet manifest. Every team typically has their established way of applying the Puppet manifest. The resulting Puppet manifest should look something like:
node 'default' {
    class { 'install_otel_collector'
      installation_token => '<YOUR_TOKEN>',
      collector_tags => { <YOUR_TAGS> },
    }

    service { 'otelcol-sumo':
      provider => 'systemd',
      ensure => running,
      enable => true,
      require => Class['install_otel_collector'],
    }

    file { '/etc/otelcol-sumo/conf.d/<downloaded_yaml_file>':
      ensure => present,
      source => 'puppet:///modules/install_otel_collector/<downloaded_yaml_file>',
      mode => '0644',
      notify => Service[otelcol-sumo],
    }
  }
After successfully executing the above command, Sumo Logic will start receiving data from your host machine.
Click Next. This will install the app (dashboards and monitors) to your Sumo Logic Org.
Dashboard panels will start to fill automatically. It's important to note that each panel fills with data matching the time range query and received since the panel was created. Results won't immediately be available, but within 20 minutes, you'll see full graphs and maps.
Sample log messages
Dec 13, 2022 03:53:03 PM org.apache.catalina.startup.Catalina start INFO: Server startup in 63394 ms
179.105.33.169 - - [13/Dec/2022:15:53:03 +0000] "PUT /aboutus/ HTTP/1.1" 404 76246453 "http://bing.com/Nutch-1.4" "-"
Sample log queries
 %"sumo.datasource"=tomcat %"webengine.cluster.name"=*
| json "log" as _rawlog nodrop
| if (isEmpty(_rawlog), _raw, _rawlog) as _raw
| parse regex "(?<time>\w+\s+\d+,\s+\d+\s+\d+:\d+:\d+\s+\w+)\s+(?<component>[\w\S]+)\s+(?<method>[\w\S]+)\s+(?<loglevel>\w+):\s+(?<message>[\s\w]+)(?:$|\n(?<thrown>[\s\S]+)$)"
| where (loglevel != "INFO")
| timeslice 1h
| count by _timeslice, component
| transpose row _timeslice column component
Sample metrics
{
  "queryId":"A",
  "_source":"apache-tomcat-otel",
  "_metricId":"9kcuMkQW4hfMv_0DLpjnBg",
  "webengine.node.name":"ip-54-163-207-30.ec2.internal",
  "_sourceName":"Http Input",
  "host.id":"i-071ade72d03650657",
  "host.group":"tomcatHostGrp",
  "telemetry.sdk.version":"1.38.0",
  "os.type":"linux",
  "sumo.datasource":"tomcat",
  "_sourceCategory":"Labs/apache-tomcat-otel",
  "deployment.environment":"dev",
  "_contentType":"Carbon2",
  "host.name":"ip-54-163-207-30.ec2.internal",
  "metric":"tomcat.request_count",
  "_collectorId":"000000000FAB6E04",
  "_sourceId":"000000005A1D5A65",
  "webengine.system":"tomcat",
  "webengine.cluster.name":"tomcat_cluster",
  "unit":"requests",
  "telemetry.sdk.language":"java",
  "telemetry.sdk.name":"opentelemetry",
  "service.name":"unknown_service:java",
  "_collector":"Labs - apache-tomcat-otel",
  "proto_handler":"\"http-nio-8080\"",
  "max":391,
  "min":144,
  "avg":213.86,
  "sum":2994,
  "latest":265,
  "count":14
}
Sample metrics query
sumo.datasource=tomcat deployment.environment=* webengine.cluster.name=* webengine.node.name=* metric=tomcat.request_count | sum by deployment.environment,webengine.cluster.name,webengine.node.name,proto_handler
Viewing Tomcat dashboards
Overview
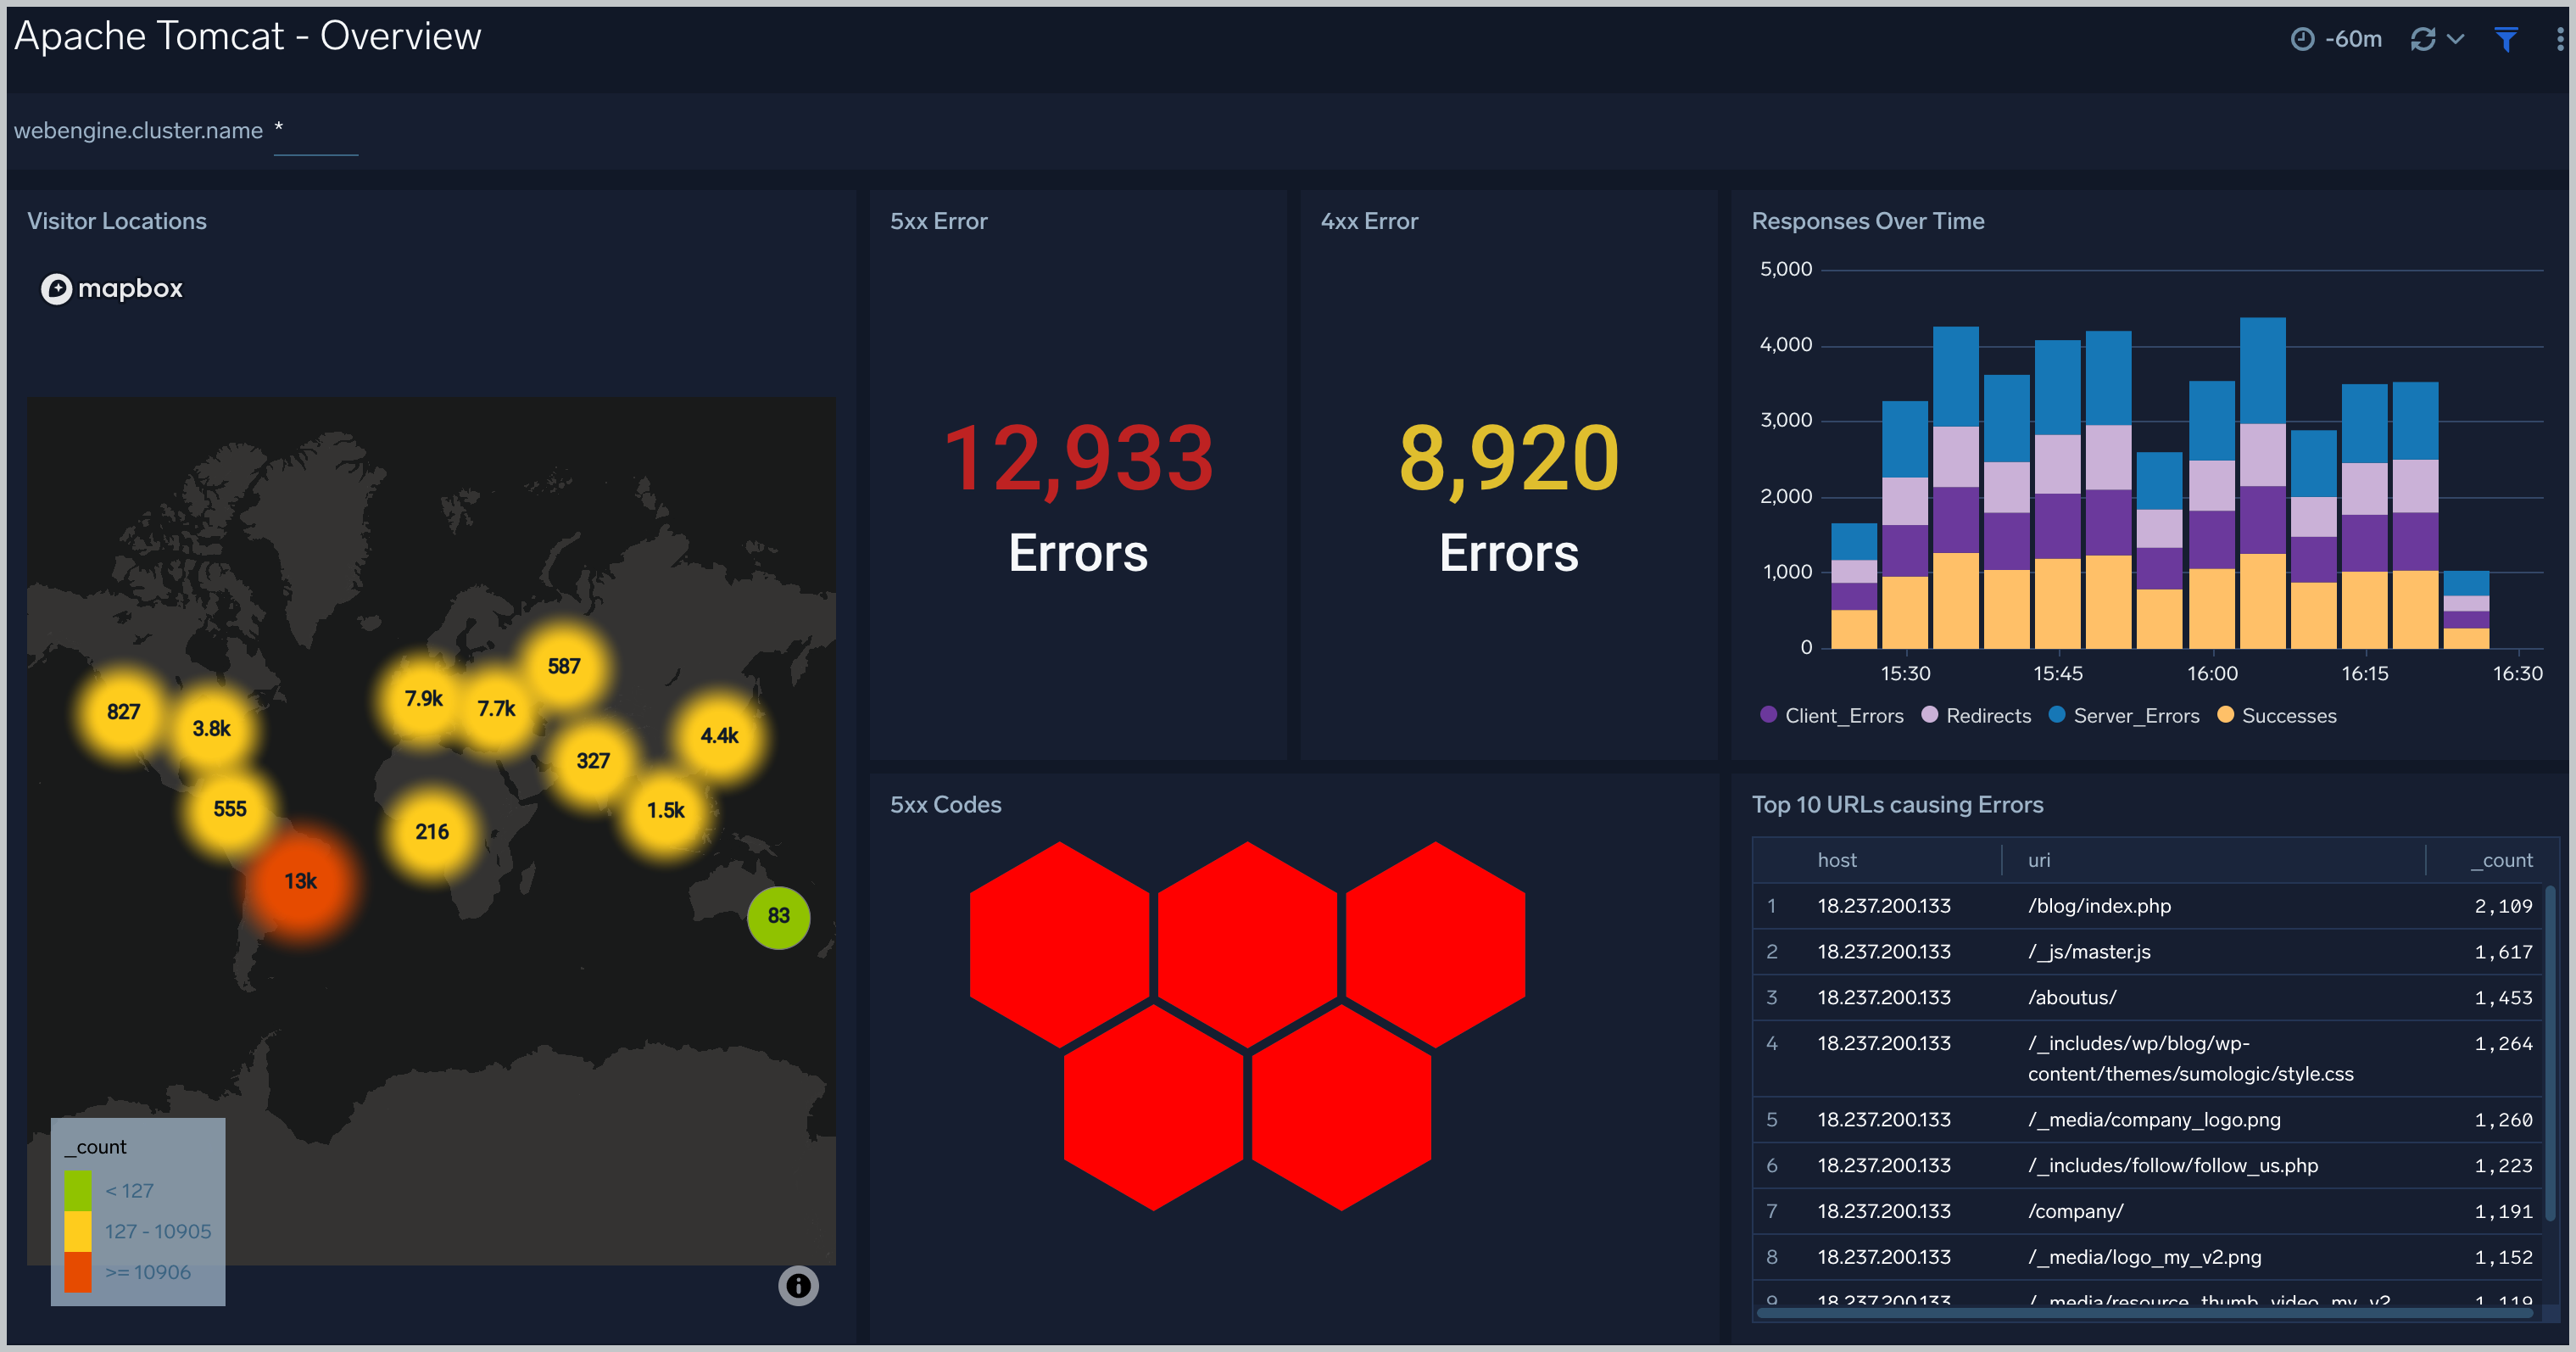
The Apache Tomcat - Overview dashboard offers a high-level view of visitor geographic locations, responses over time, error codes, and the top URLs causing errors. Additionally, it allows you to monitor requests, error counts and rates, as well as busy and idle threads for your Tomcat instance.
Use this dashboard to:
- Analyze http request about status code.
- Gain insights into originated traffic location by region. This can help you allocate computer resources to different regions according to their needs.
- Gain insights into Client, Server Responses on Tomcat Server. This helps you identify errors in Tomcat Server.
Visitor Locations
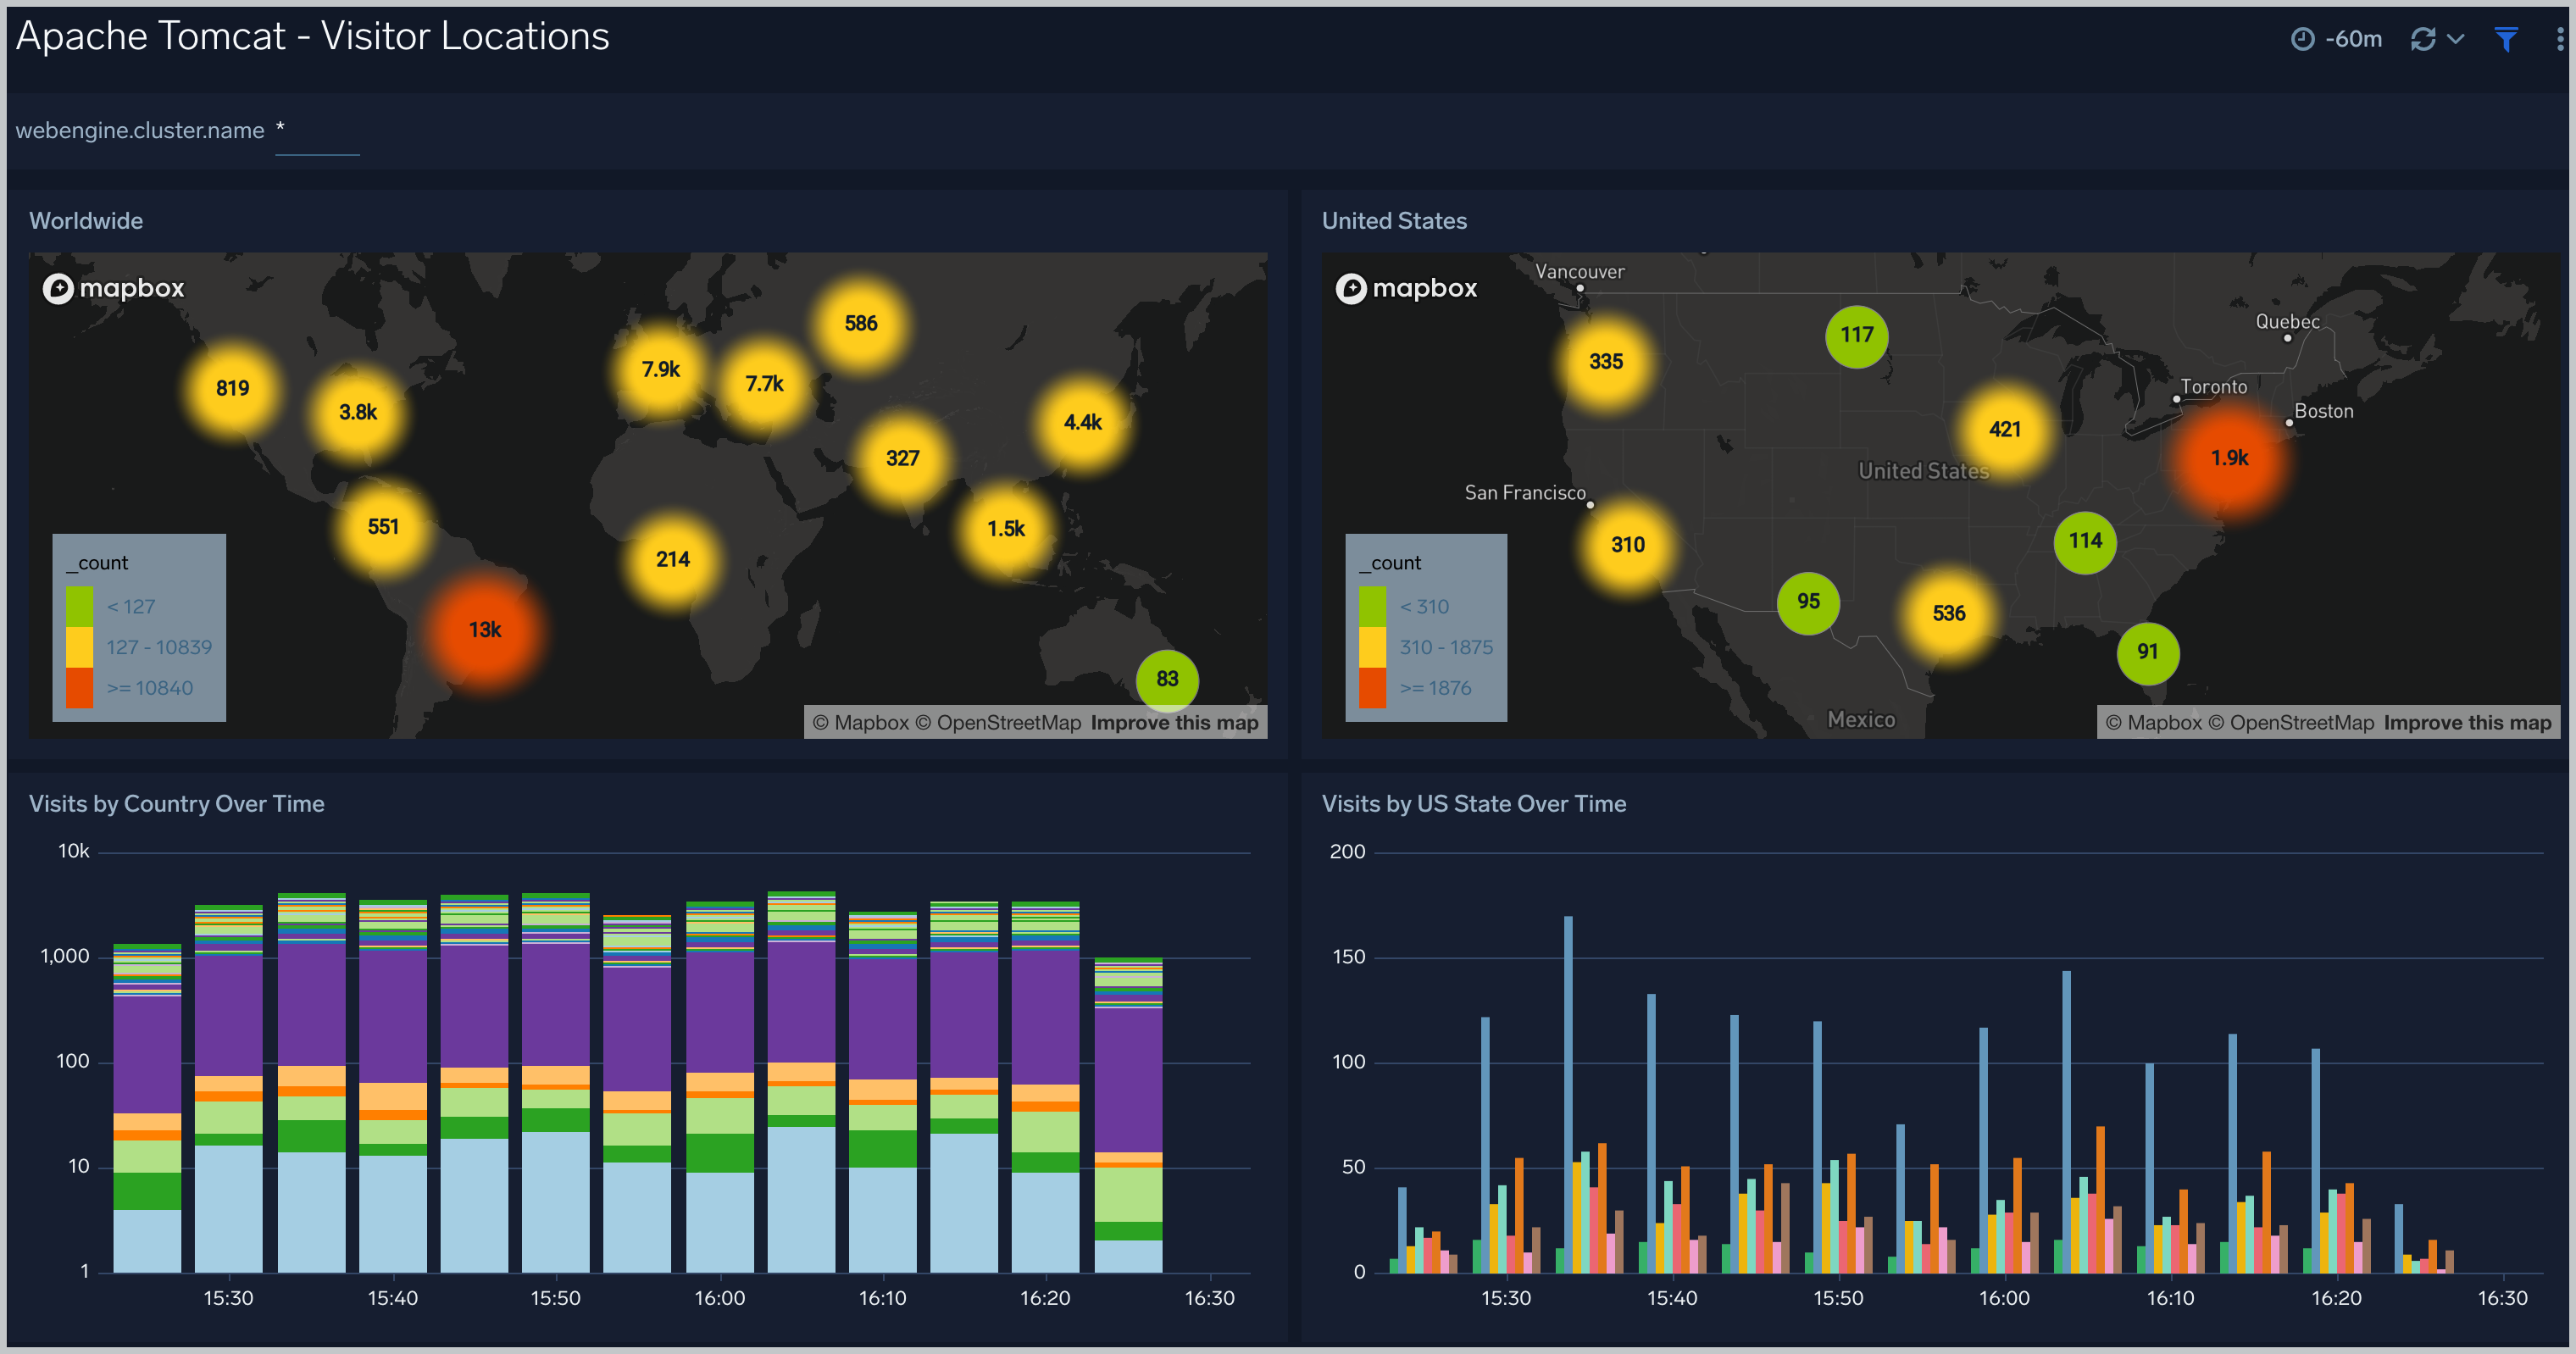
The Apache Tomcat - Visitor Locations dashboard provides a high-level view of Tomcat visitor geographic locations both worldwide and in the U.S. Dashboard panels also show graphic trends for visits by country over time and visits by U.S. region over time.
- Worldwide. Uses a geo lookup operation to display worldwide visitor locations by IP address on a map of the world, which allows you to see a count of hits per location for the last 24 hours.
- Visits by Country Over Time. Displays the number of visitors by country in a stacked column chart on a timeline for the last hour.
- United States. Uses a geo lookup operation to display US visitor locations by IP address on a map of the world, which allows you to see a count of hits per location for the last 24 hours.
- Visits by US State Over Time. Displays the number of US visitors by state in a stacked column chart on a timeline for the last hour.
Visitor Traffic Insight
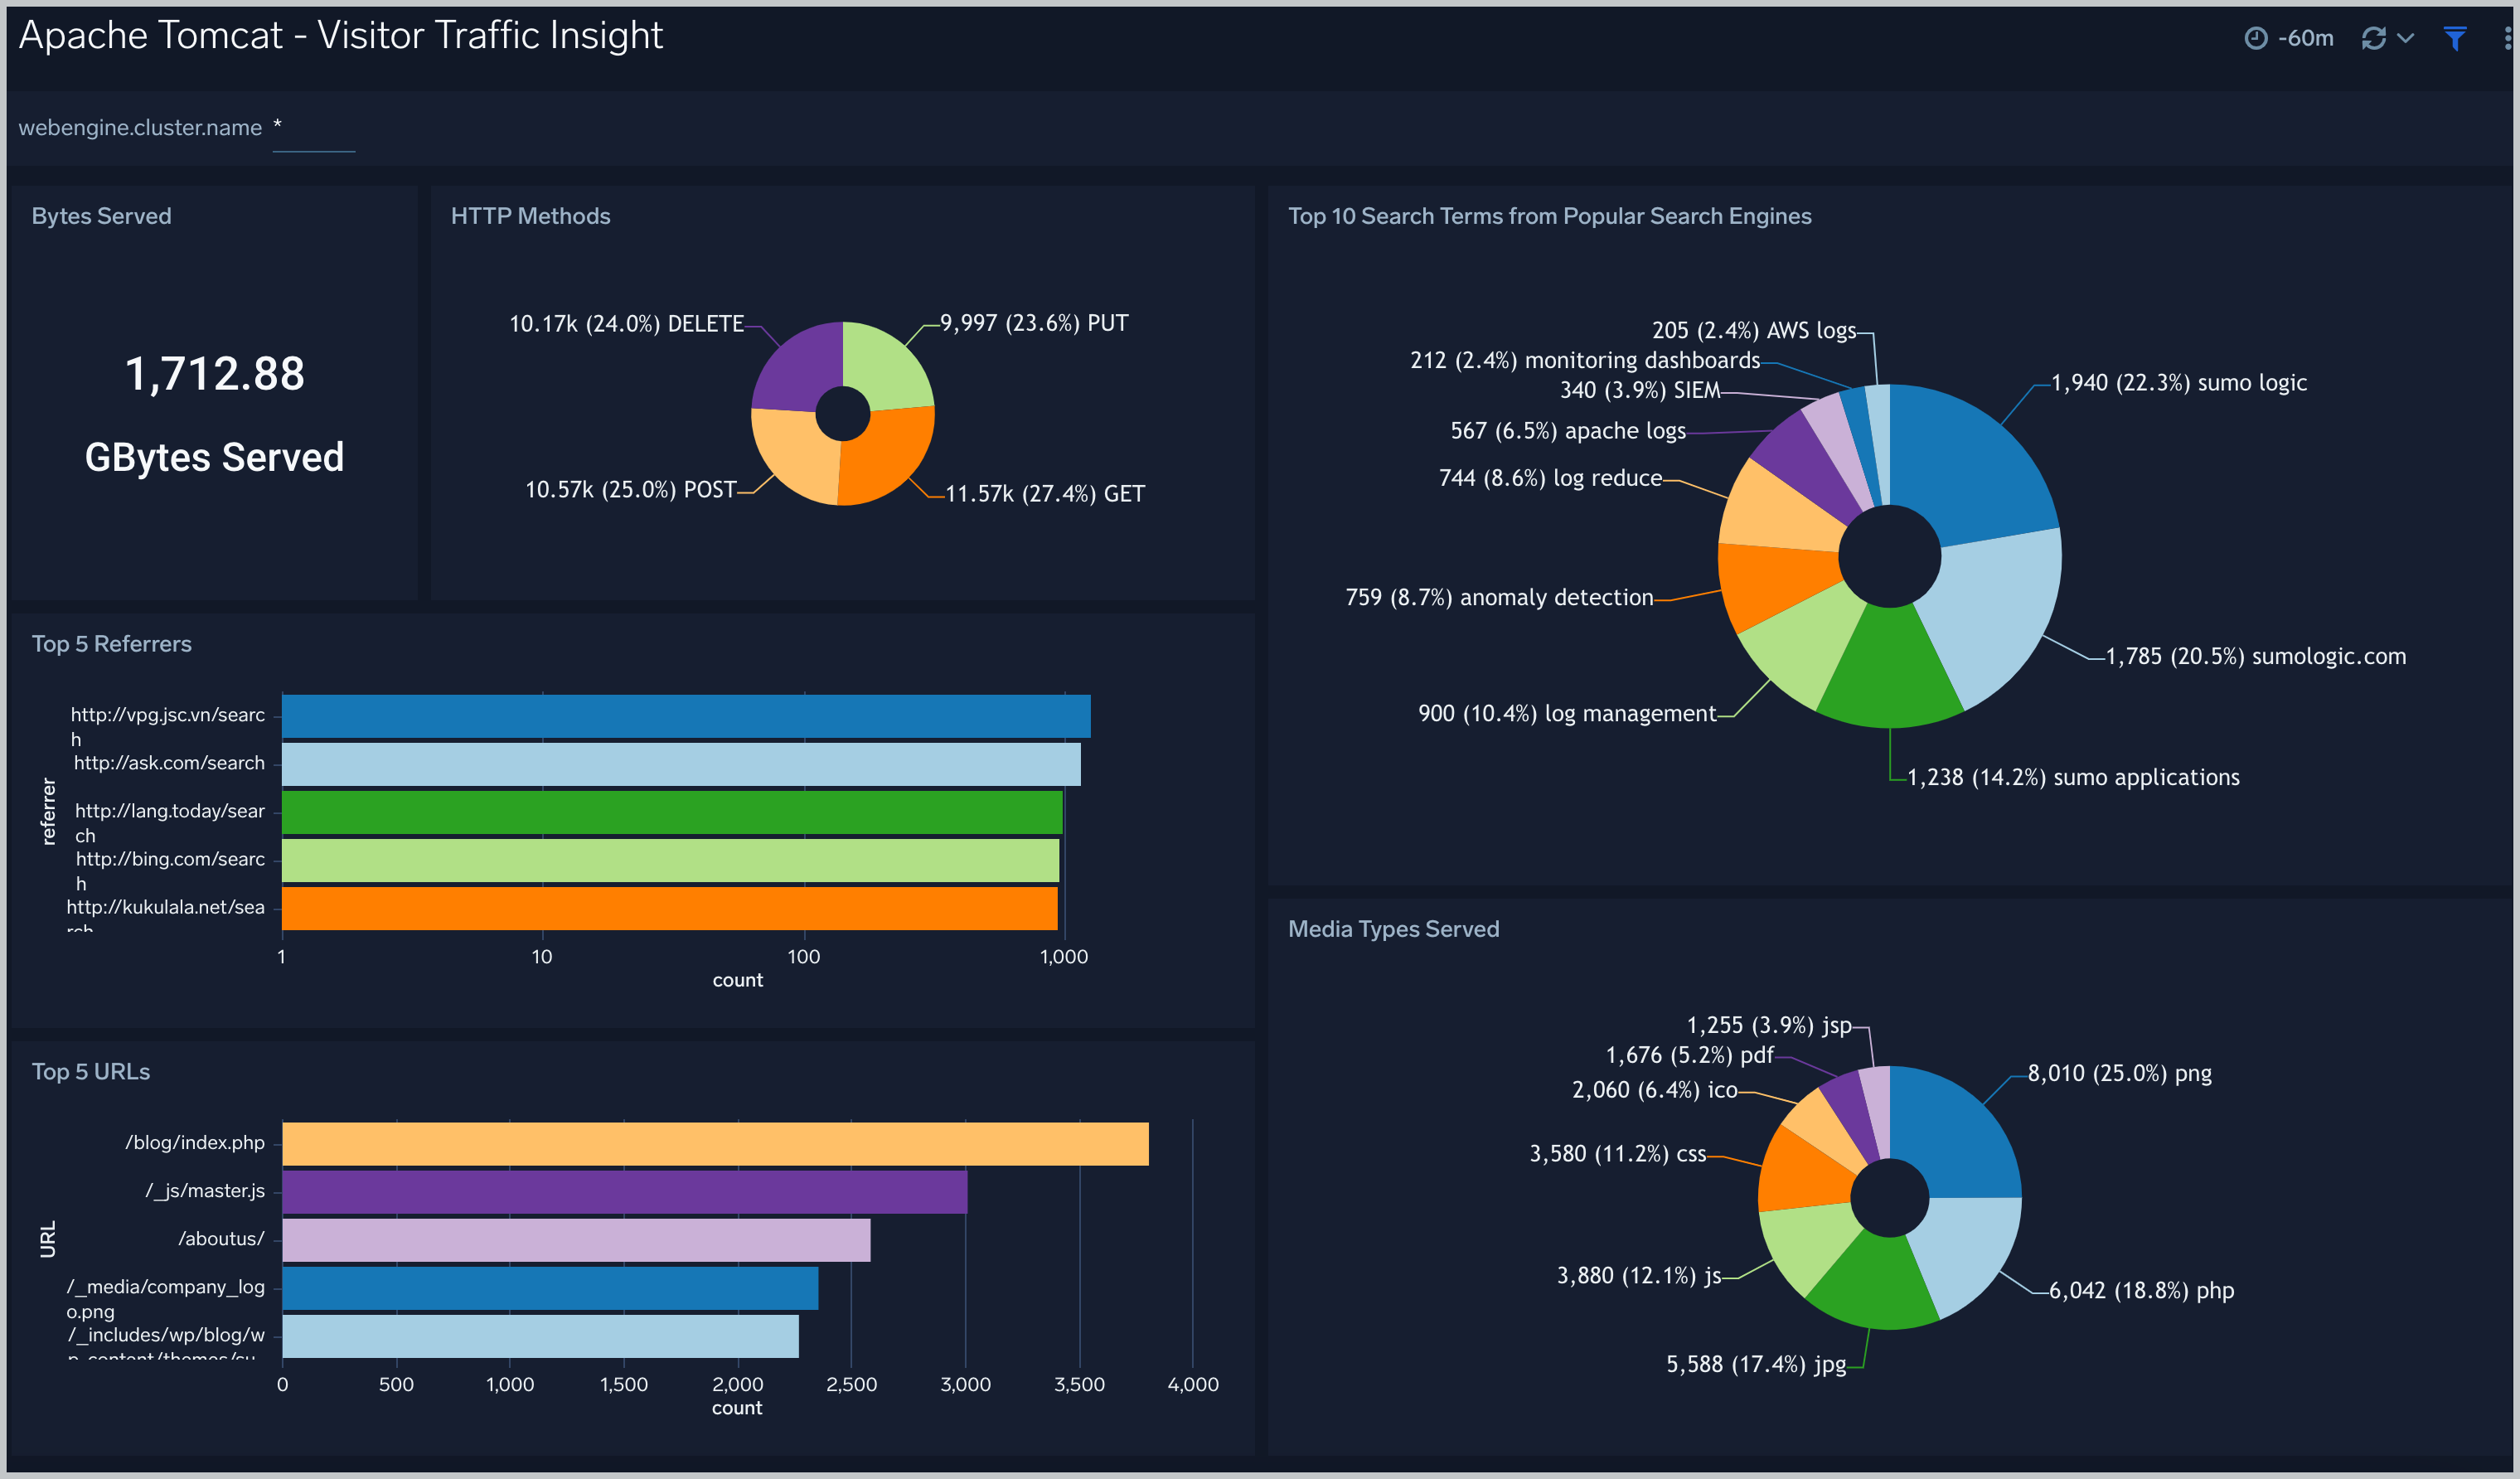
The Apache Tomcat - Visitor Traffic Insight dashboard provides detailed information on the top documents accessed, top referrers, top search terms from popular search engines, and the media types served.
Bytes Served. Displays bytes served in a single chart on a timeline for the last 60 minutes.
HTTP Methods. Shows the number of methods over time in a pie chart on a timeline for the last 60 minutes.
Top 5 url. Provides a list of the top 5 URLs being accessed by your visitors in a bar chart for the 60 minutes.
Media Types Served. Displays a list of file types being served in a pie chart for the 60 minutes.
Top 5 Referrers. Shows a list of the top 5 referring websites by URL in a bar chart for the 60 minutes.
Top 10 Search Terms from Popular Search Engines. Displays a list of the top 10 search terms and their count from search engines such as Google, Bing, and Yahoo in an aggregation table for the past hour.
Web Server Operations
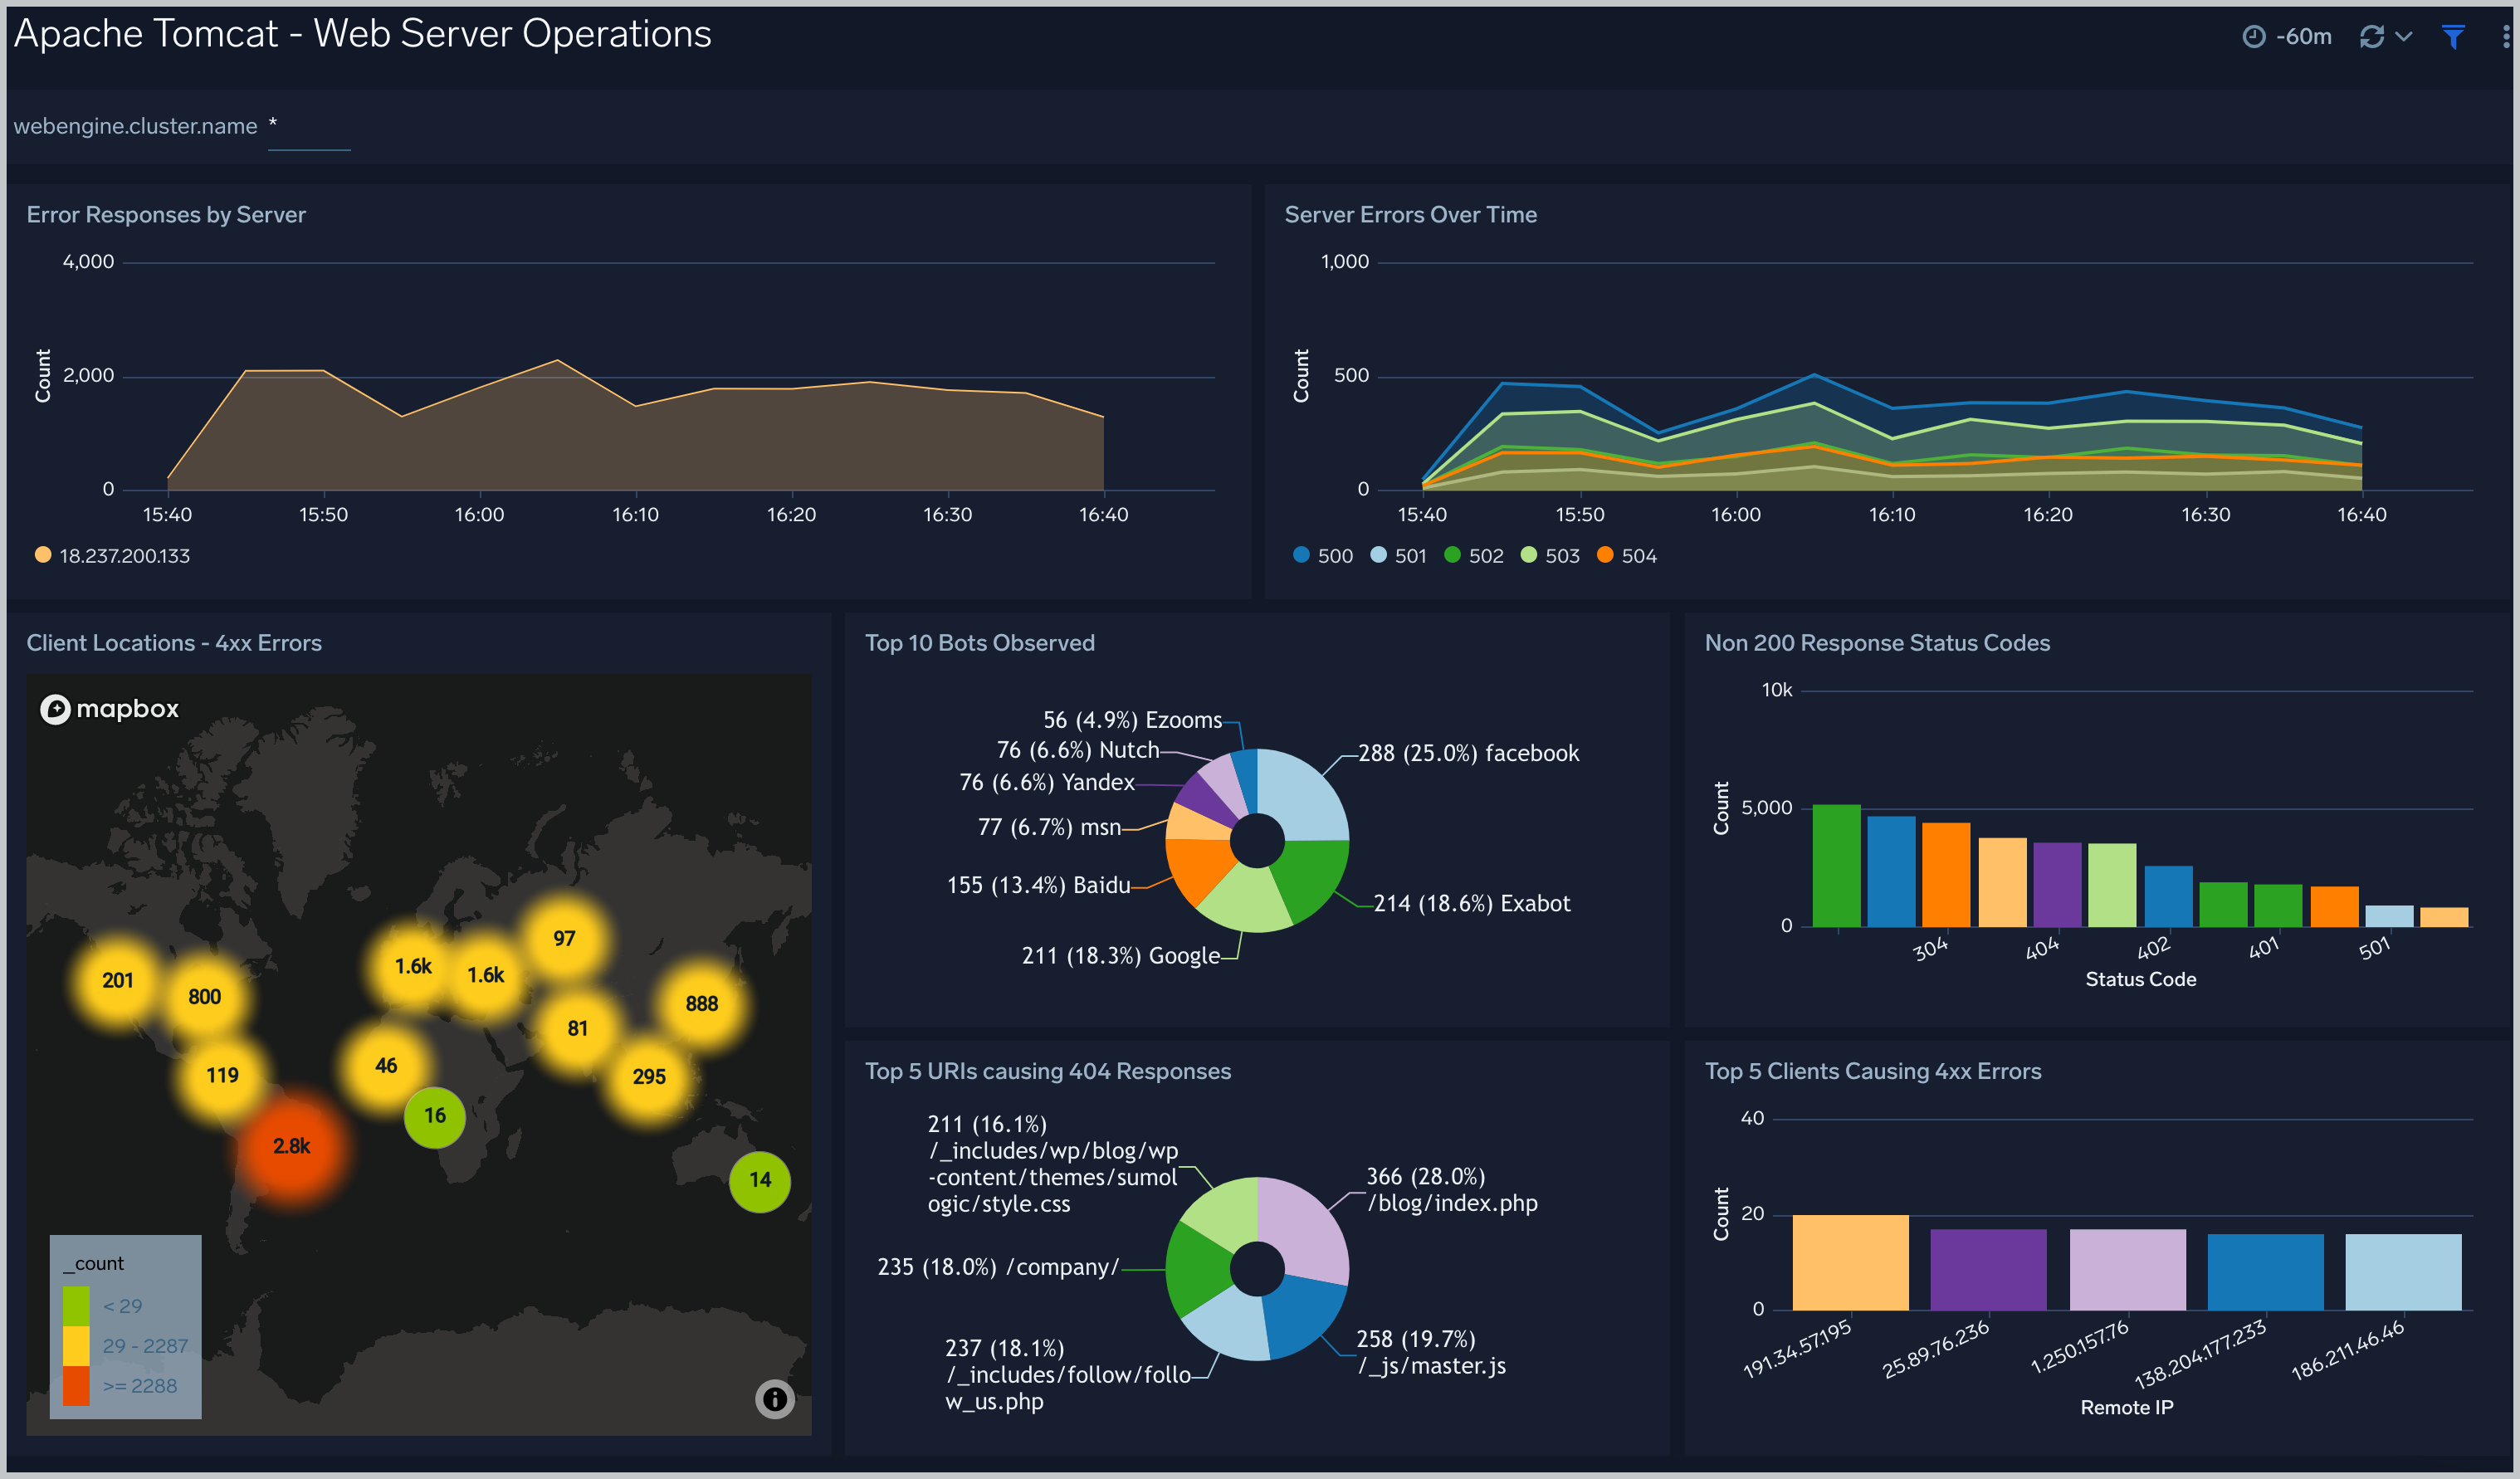
The Apache Tomcat - Web Server Operations dashboard provides a high-level view combined with detailed information on the top ten bots, geographic locations and data for clients with high error rates, server errors over time, and non 200-response code status codes. Dashboard panels also show information on server error logs, error log levels, error responses by server, and the top URIs responsible for 404 responses.
Non 200 Response Status Codes. Displays the number of non-200 response status codes in a bar chart for the past hour.
Client Locations - 4xx Errors. Uses a geo lookup operation to display the location of clients with 4xx errors by IP address on a map of the world, which allows you to see a count of hits per location for the last hour.
Server Errors Over Time. Provides information on the type and number of server errors in a column chart on a line chart for the past hour.
Error Responses by Server. Shows error responses and their distribution by server in a line chart for the past hour.
Top 5 Clients Cause 4xx Errors. Displays a list of the top 5 clients that have 4xx errors in a bar chart for the past hour.
Top 5 URIs Causing 404 Responses. Provides a list of the top 5 URIs with 404 response types in a pie chart for the past hour.
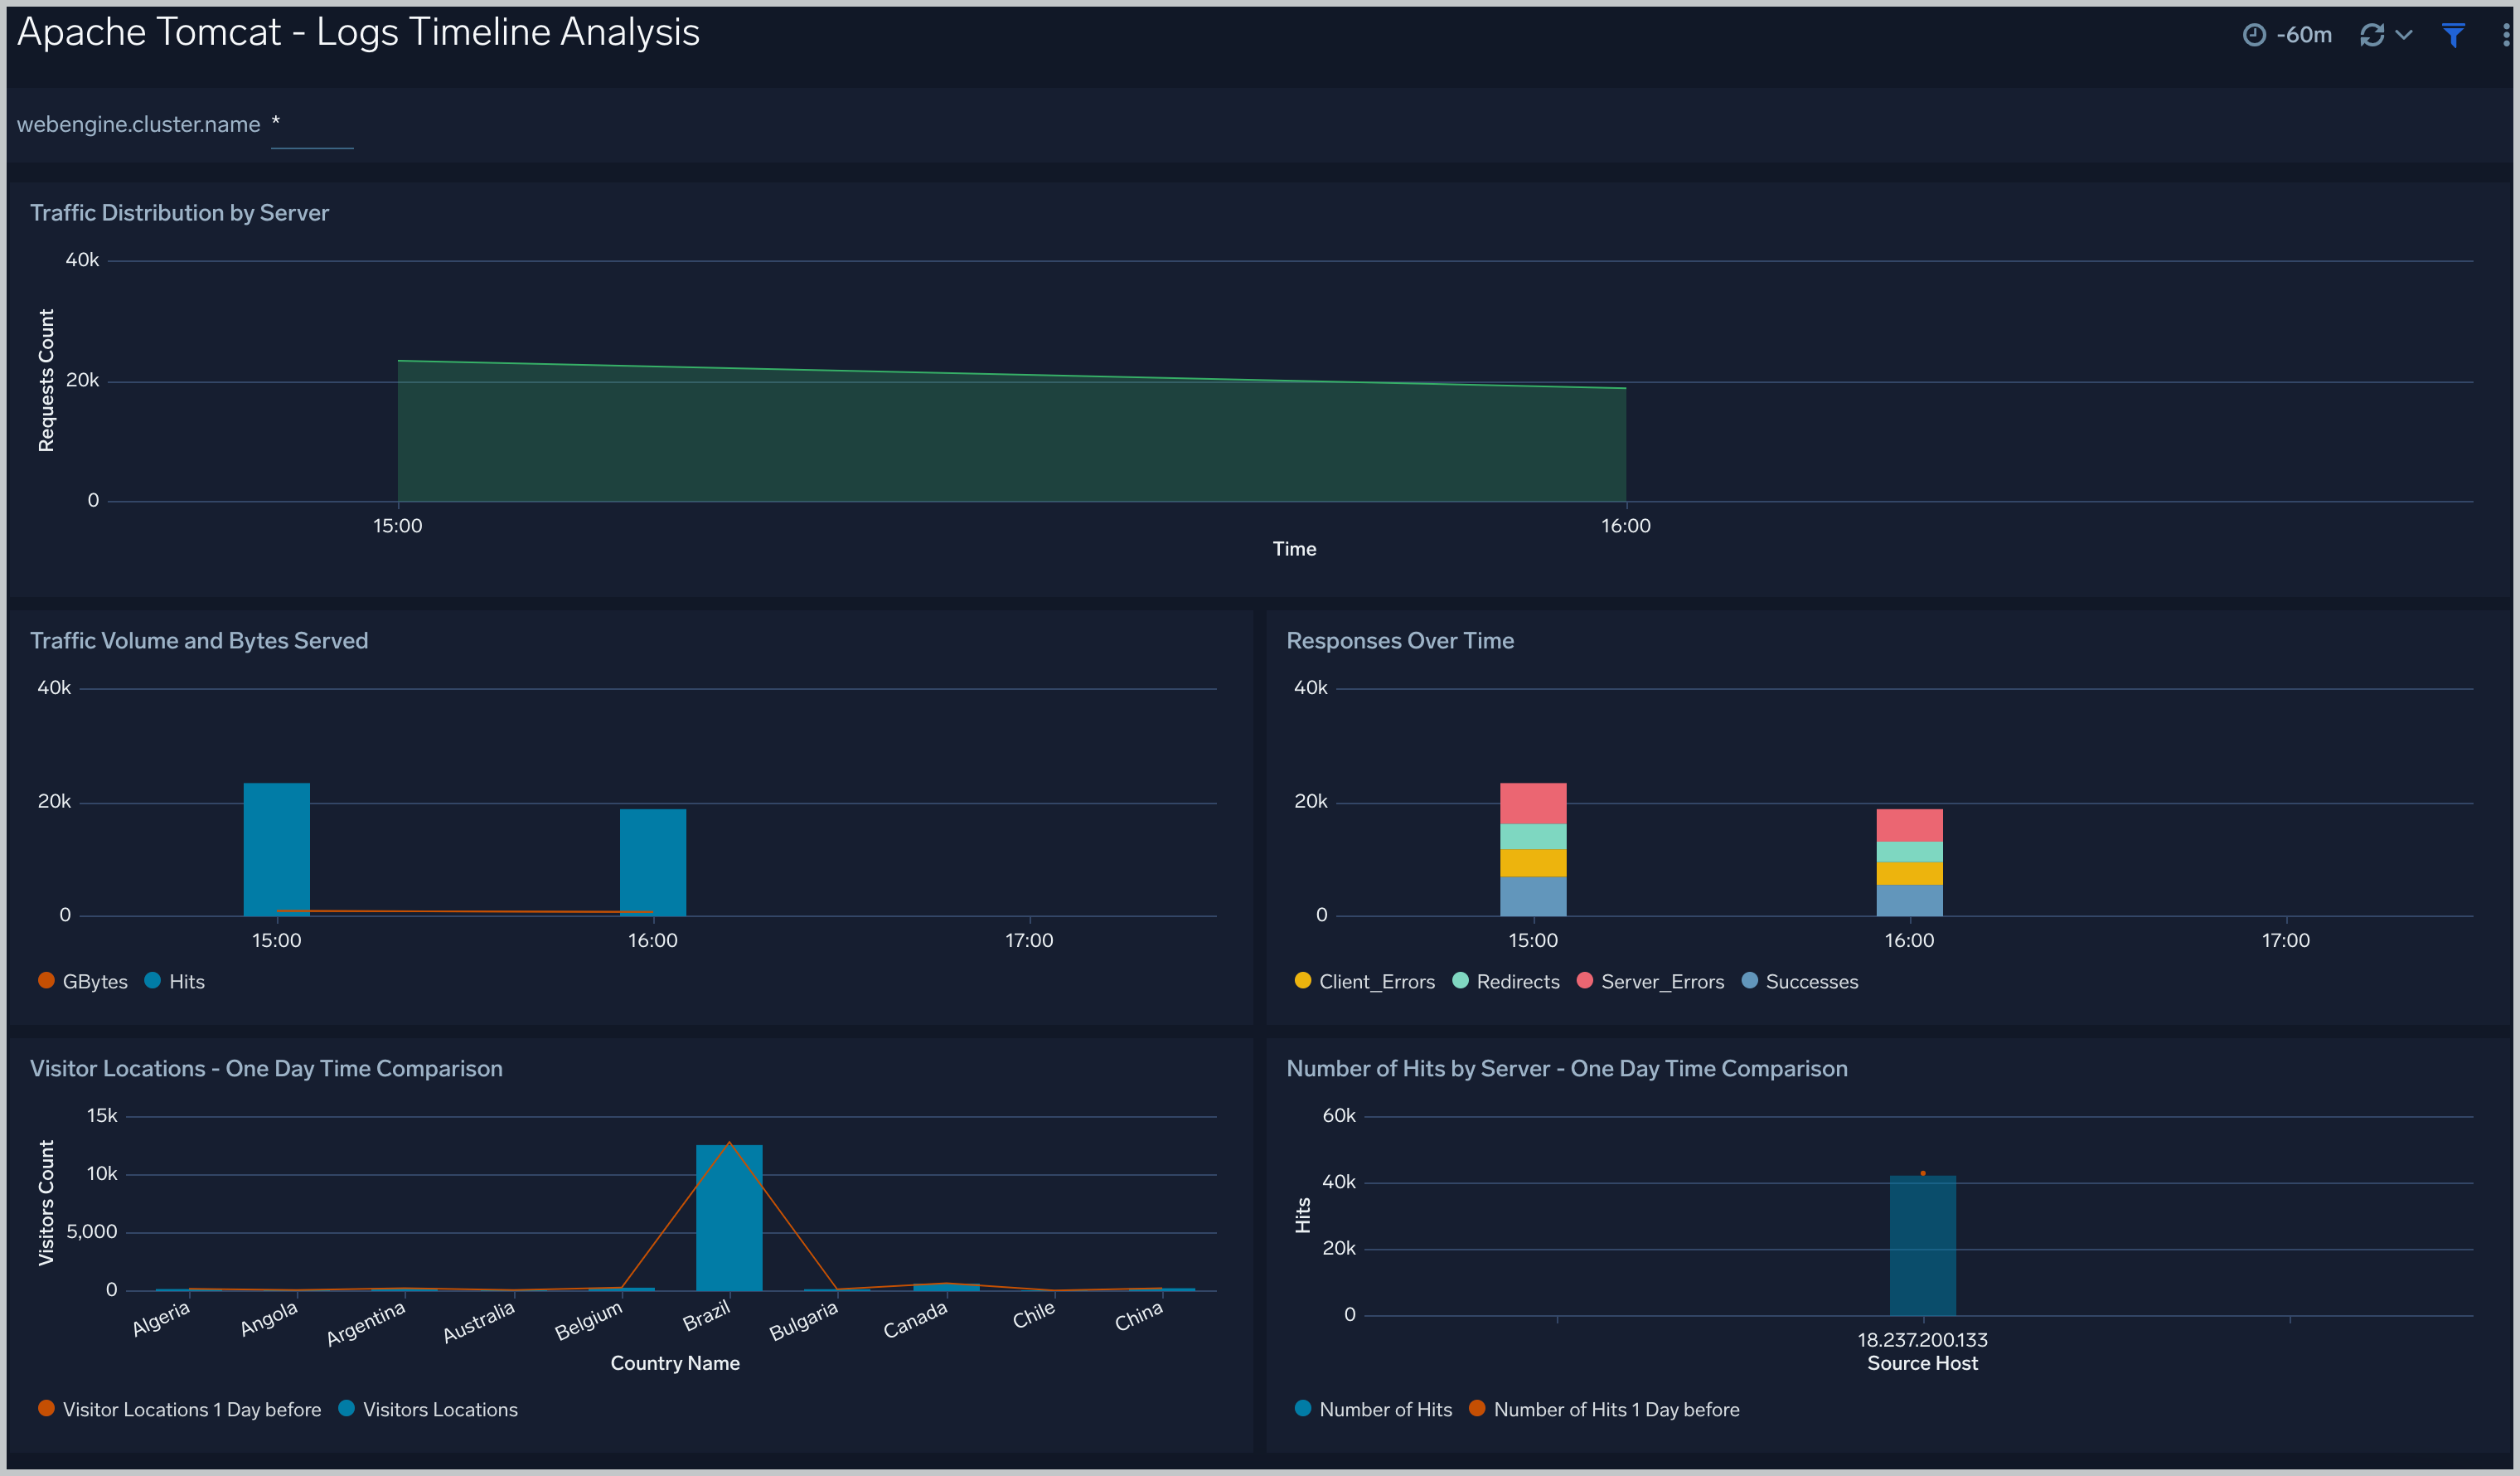
Logs Timeline Analysis
The Apache Tomcat - Logs Timeline Analysis dashboard provides a high-level view of the activity and health of Apache Tomcat servers on your network. Dashboard panels display visual graphs and detailed information on traffic volume and distribution, responses over time, as well as time comparisons for visitor locations and server hits.
Use this dashboard to:
- To understand the traffic distribution across servers, provide insights for resource planning by analyzing data volume and bytes served.
- Gain insights into originated traffic location by region. This can help you allocate compute resources to different regions according to their needs.
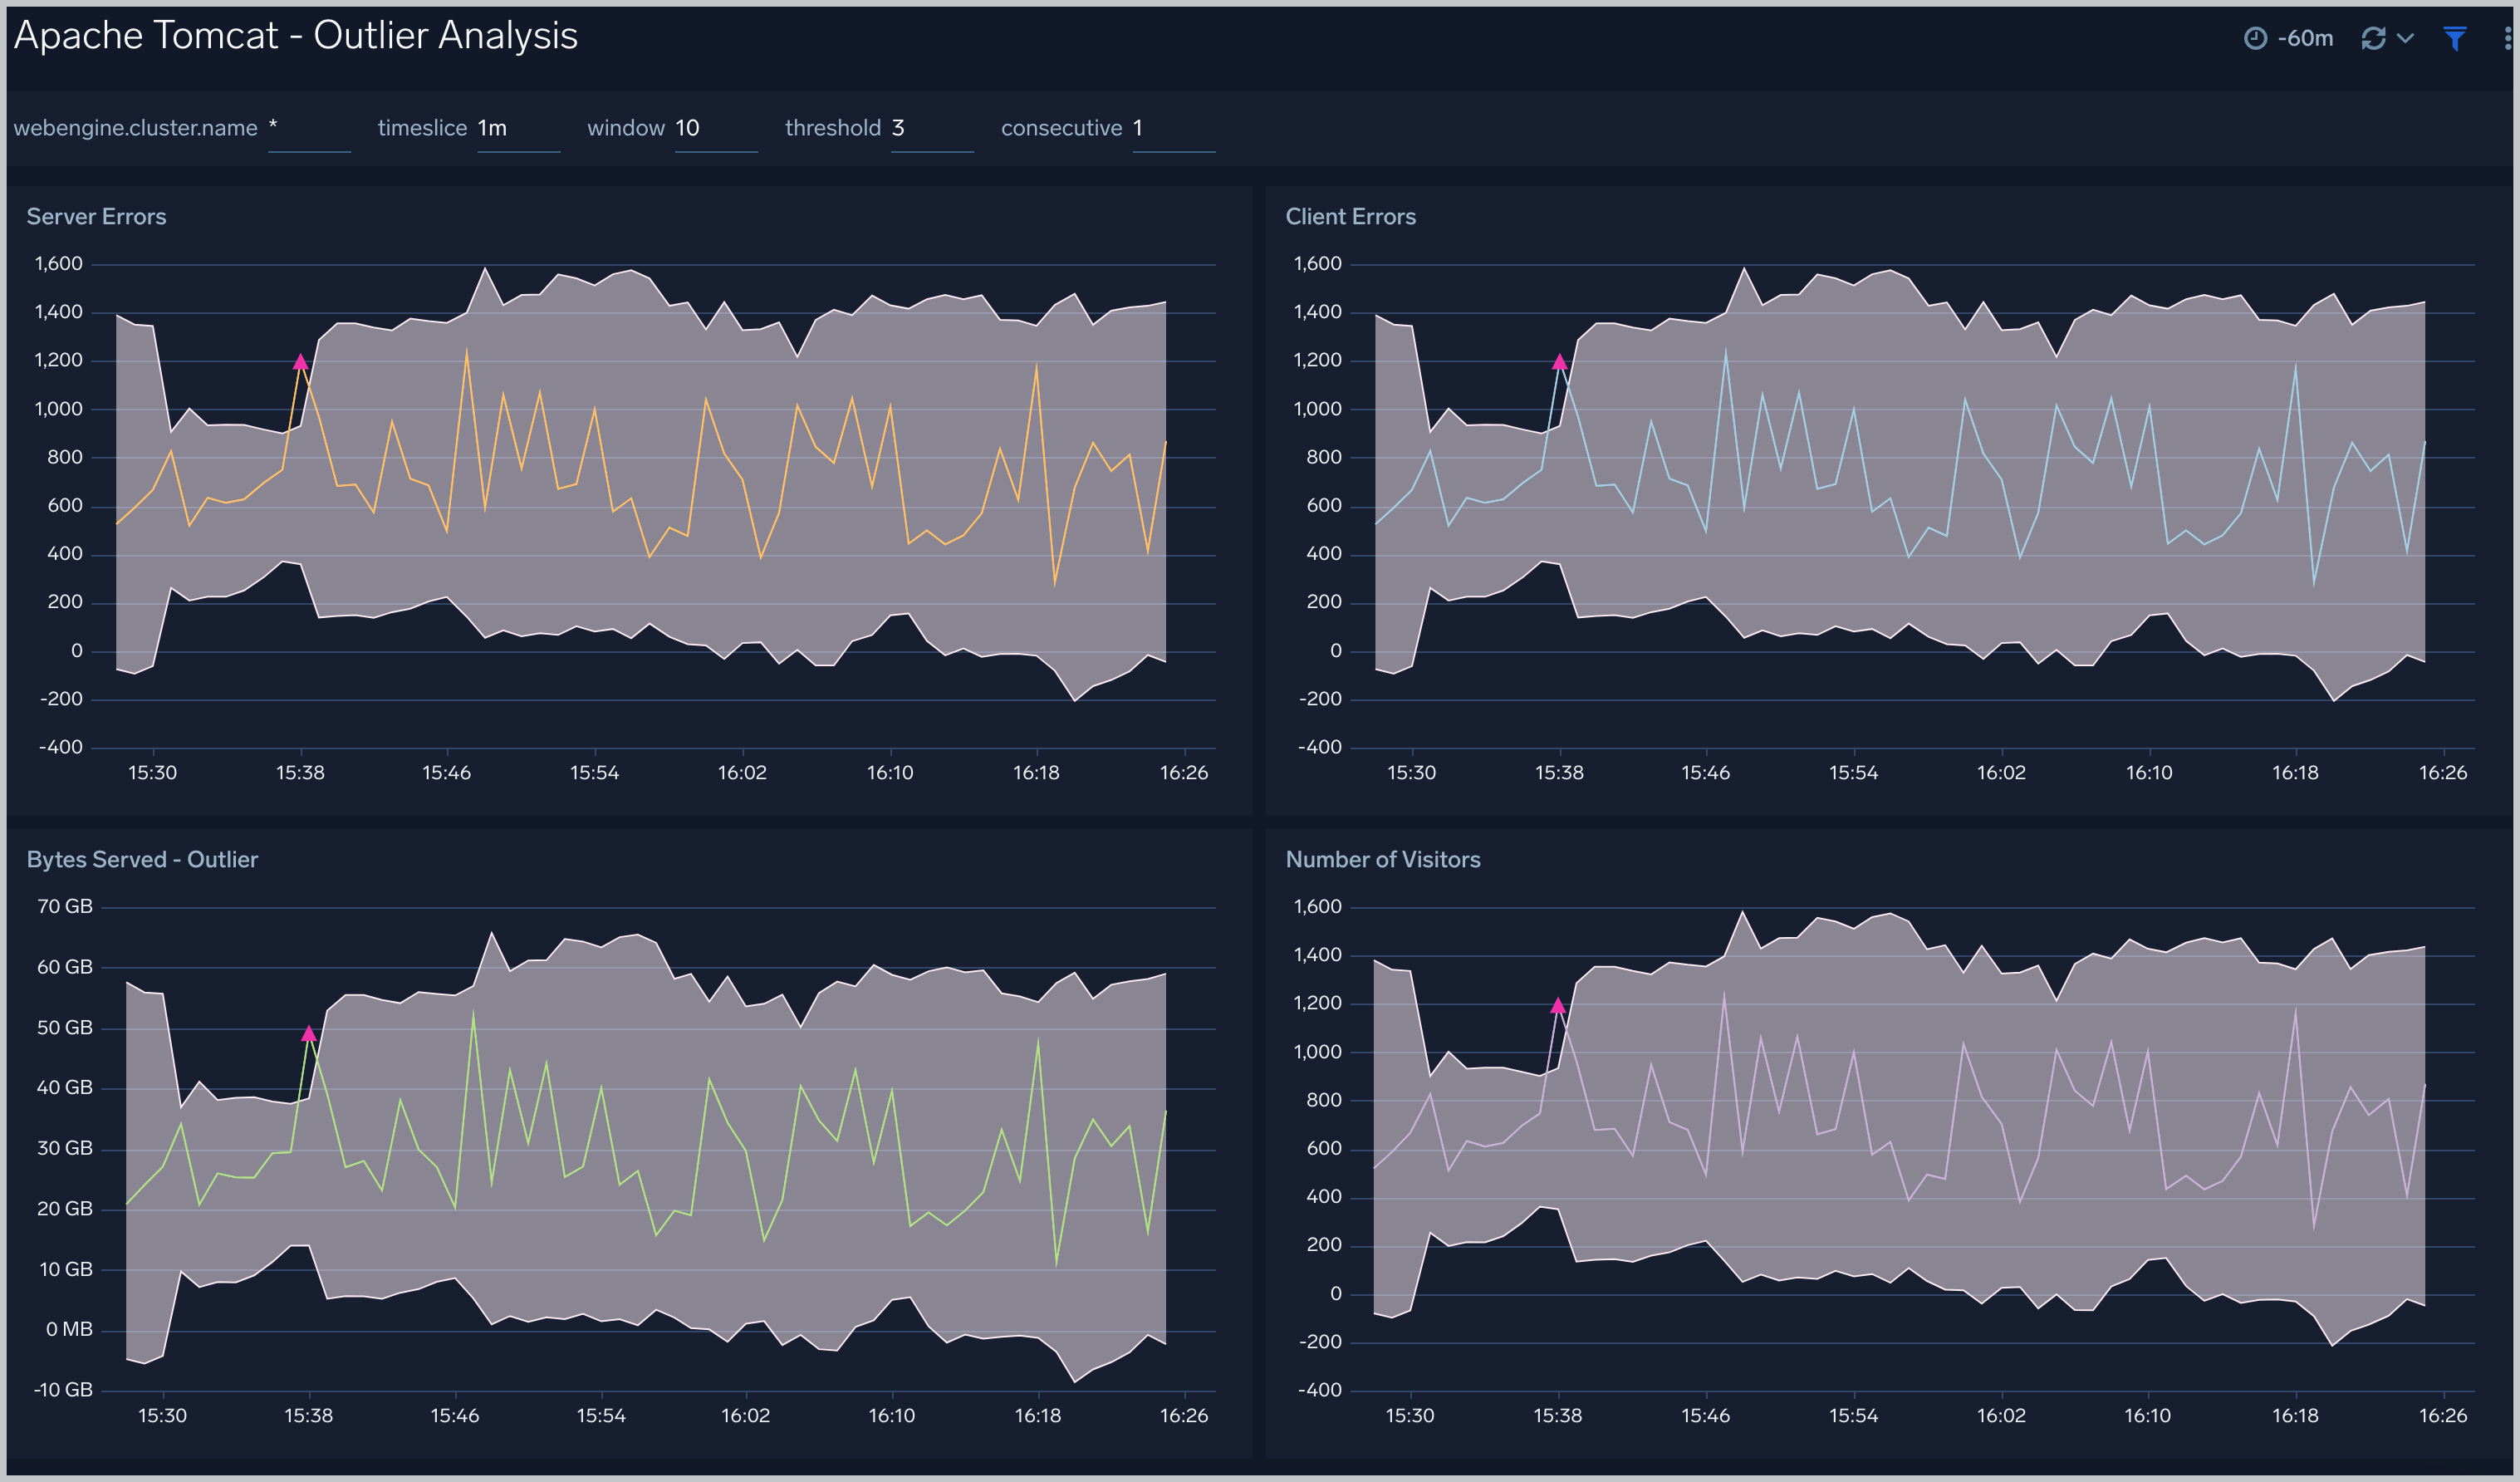
Outlier Analysis
The Apache Tomcat - Outlier Analysis dashboard provides a high-level view of Apache Tomcat server outlier metrics for bytes served, number of visitors, and server errors. You can select the time interval over which outliers are aggregated, then hover the cursor over the graph to display detailed information for that point in time.
Use this dashboard to:
- Detect outliers in your infrastructure with Sumo Logic's machine learning algorithm.
- To identify outliers in incoming traffic and the number of errors encountered by your servers.
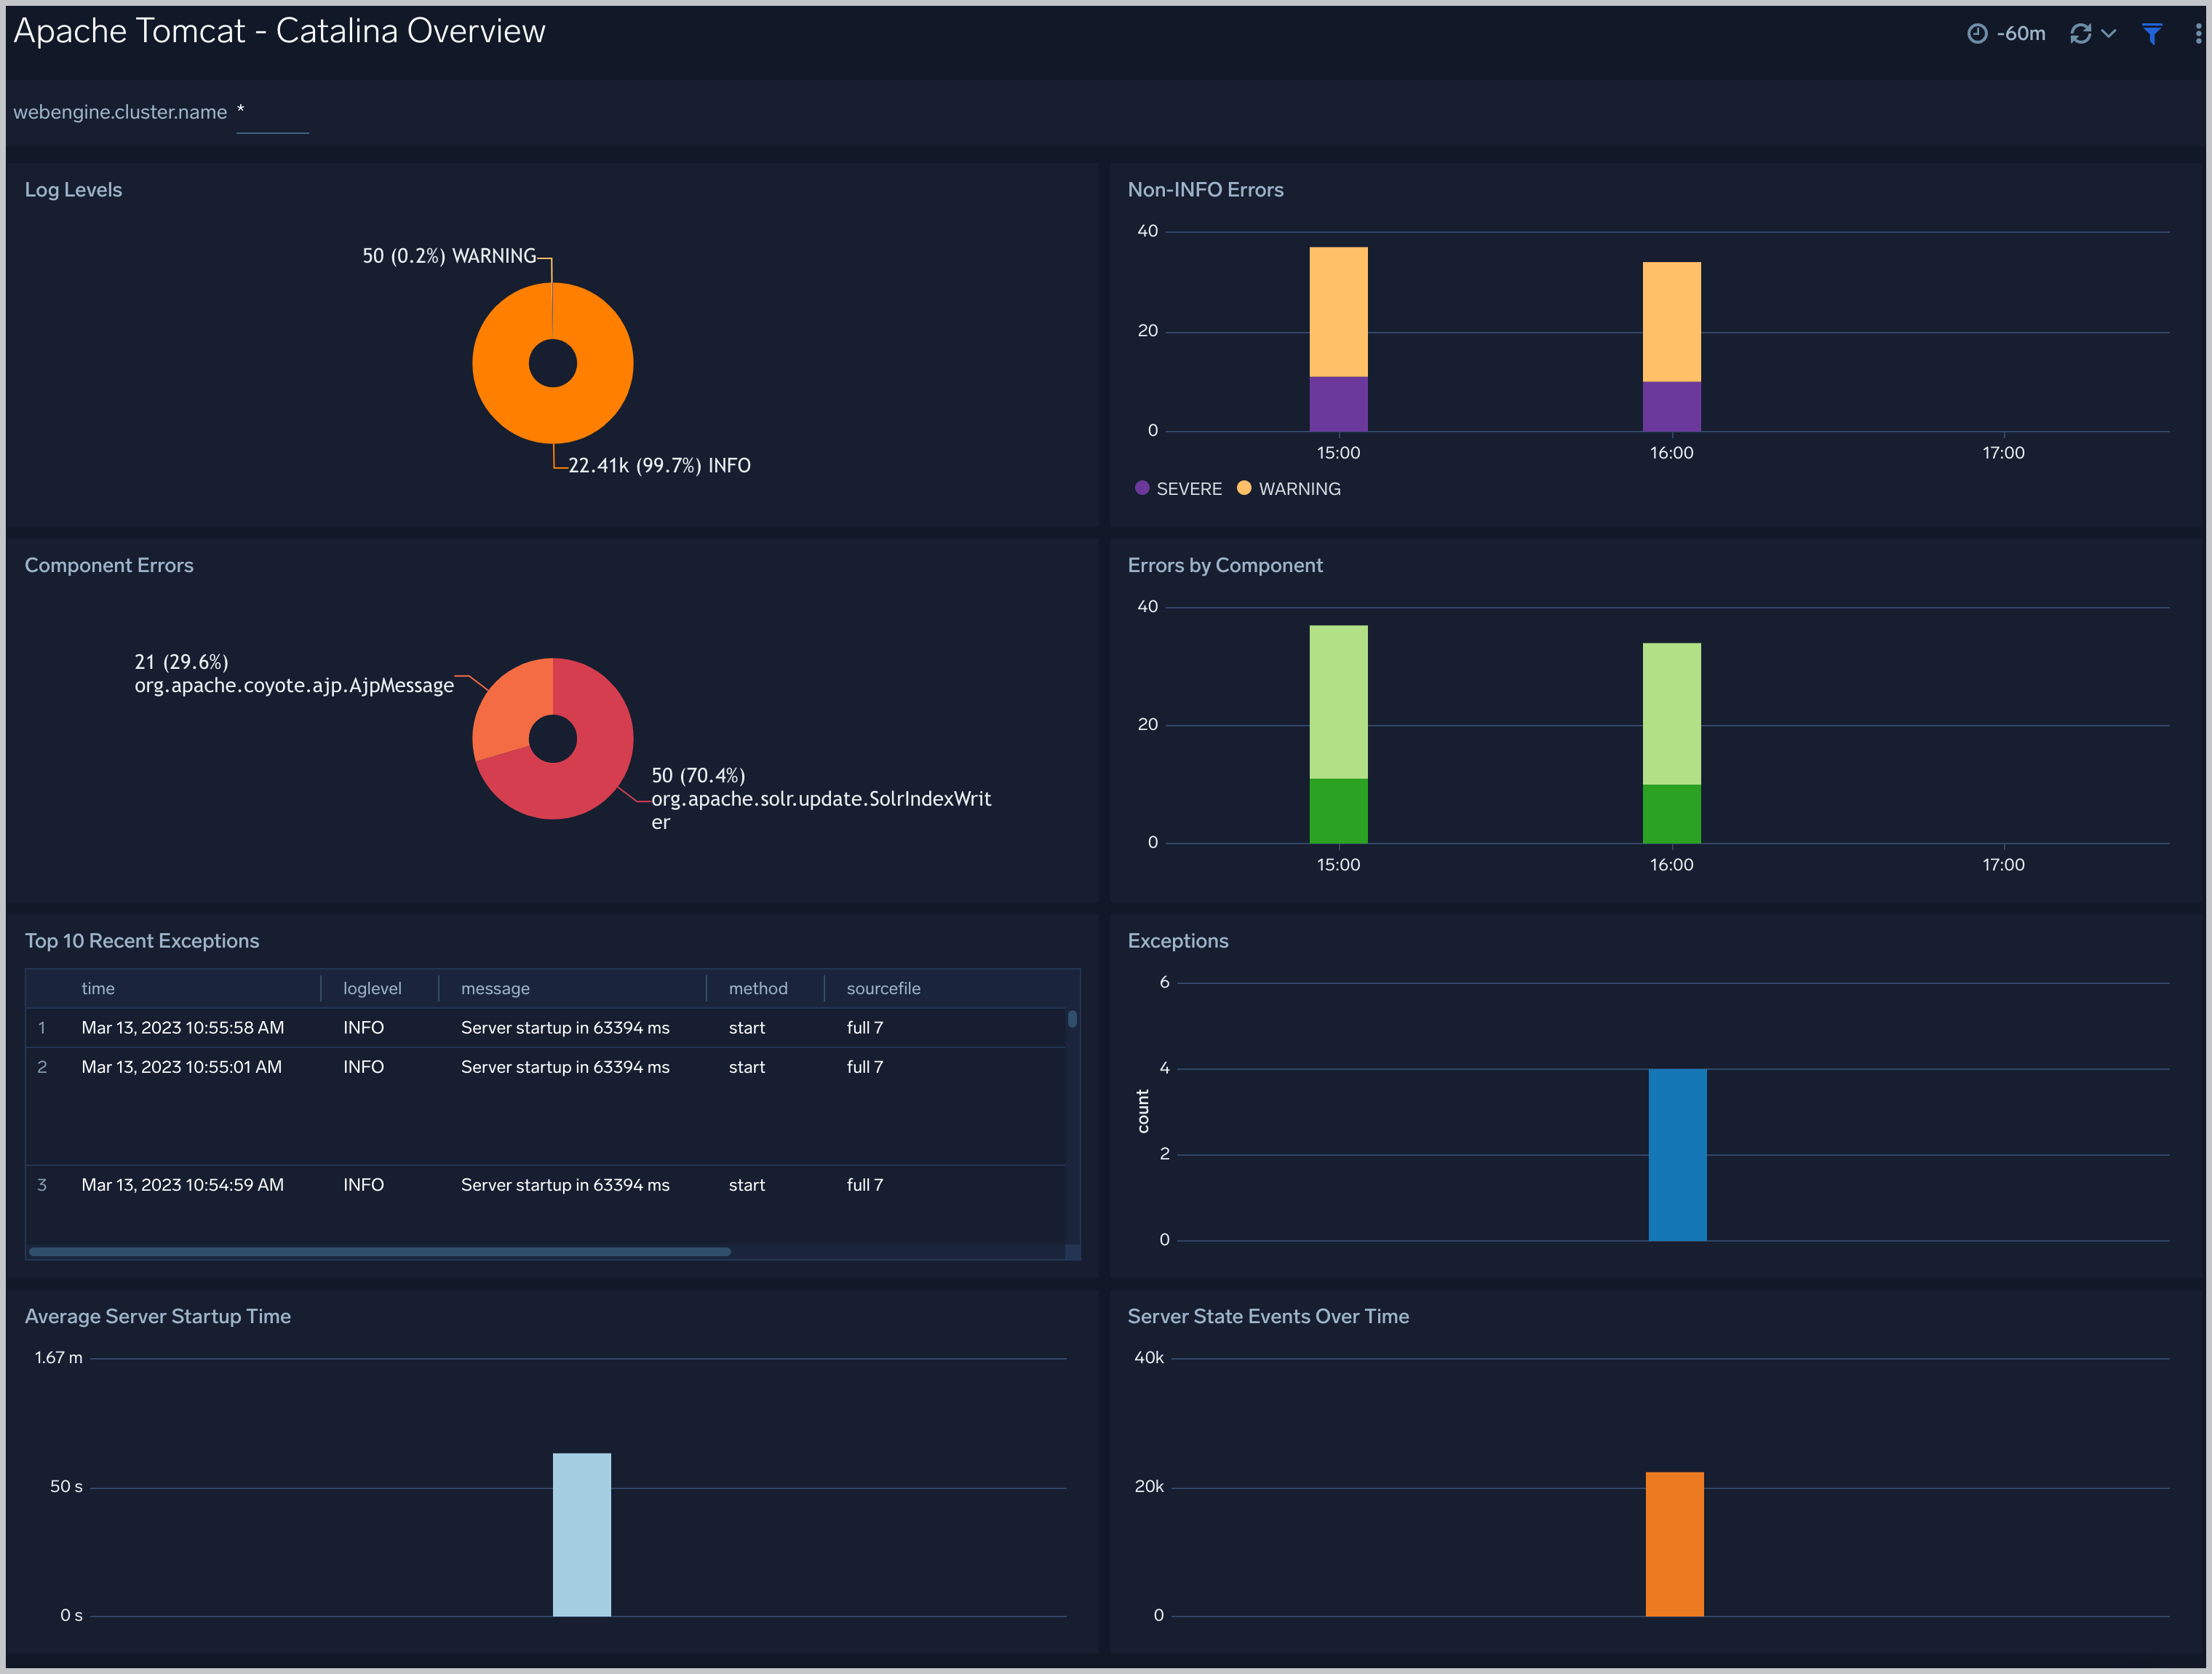
Catalina Overview
The Apache Tomcat - Catalina dashboard provides information about events such as the startup and shutdown of the Apache Tomcat application server, the deployment of new applications, or the failure of one or more subsystems.
Log Levels. Displays log levels types (Info, Severe, and Warning) in a pie chart for the last 24 hours.
Non-INFO Errors. Shows the number and type of errors (Severe or Warning) in a stacked column chart on a timeline for the last 24 hours.
Component Errors. Provides information on errors by component in a pie chart for the last 24 hours.
Errors by Component. Displays Info level errors by component in a stacked column chart on a timeline for the last 24 hours.
Top 10 Recent Exceptions. Shows the top 10 most recent exceptions in an aggregation table with columns for time, log level, message, method, source file, and thrown for the last 24 hours.
Exceptions. Provides the number of exceptions in a column chart on a timeline for the last seven days.
Average Server Startup Time. Displays the average server startup time per second by day as a column chart on a timeline for the last seven days.
Server State Events Over Time. Shows server state events (shutdown or startup) in a stacked column chart on a timeline for the last seven days.
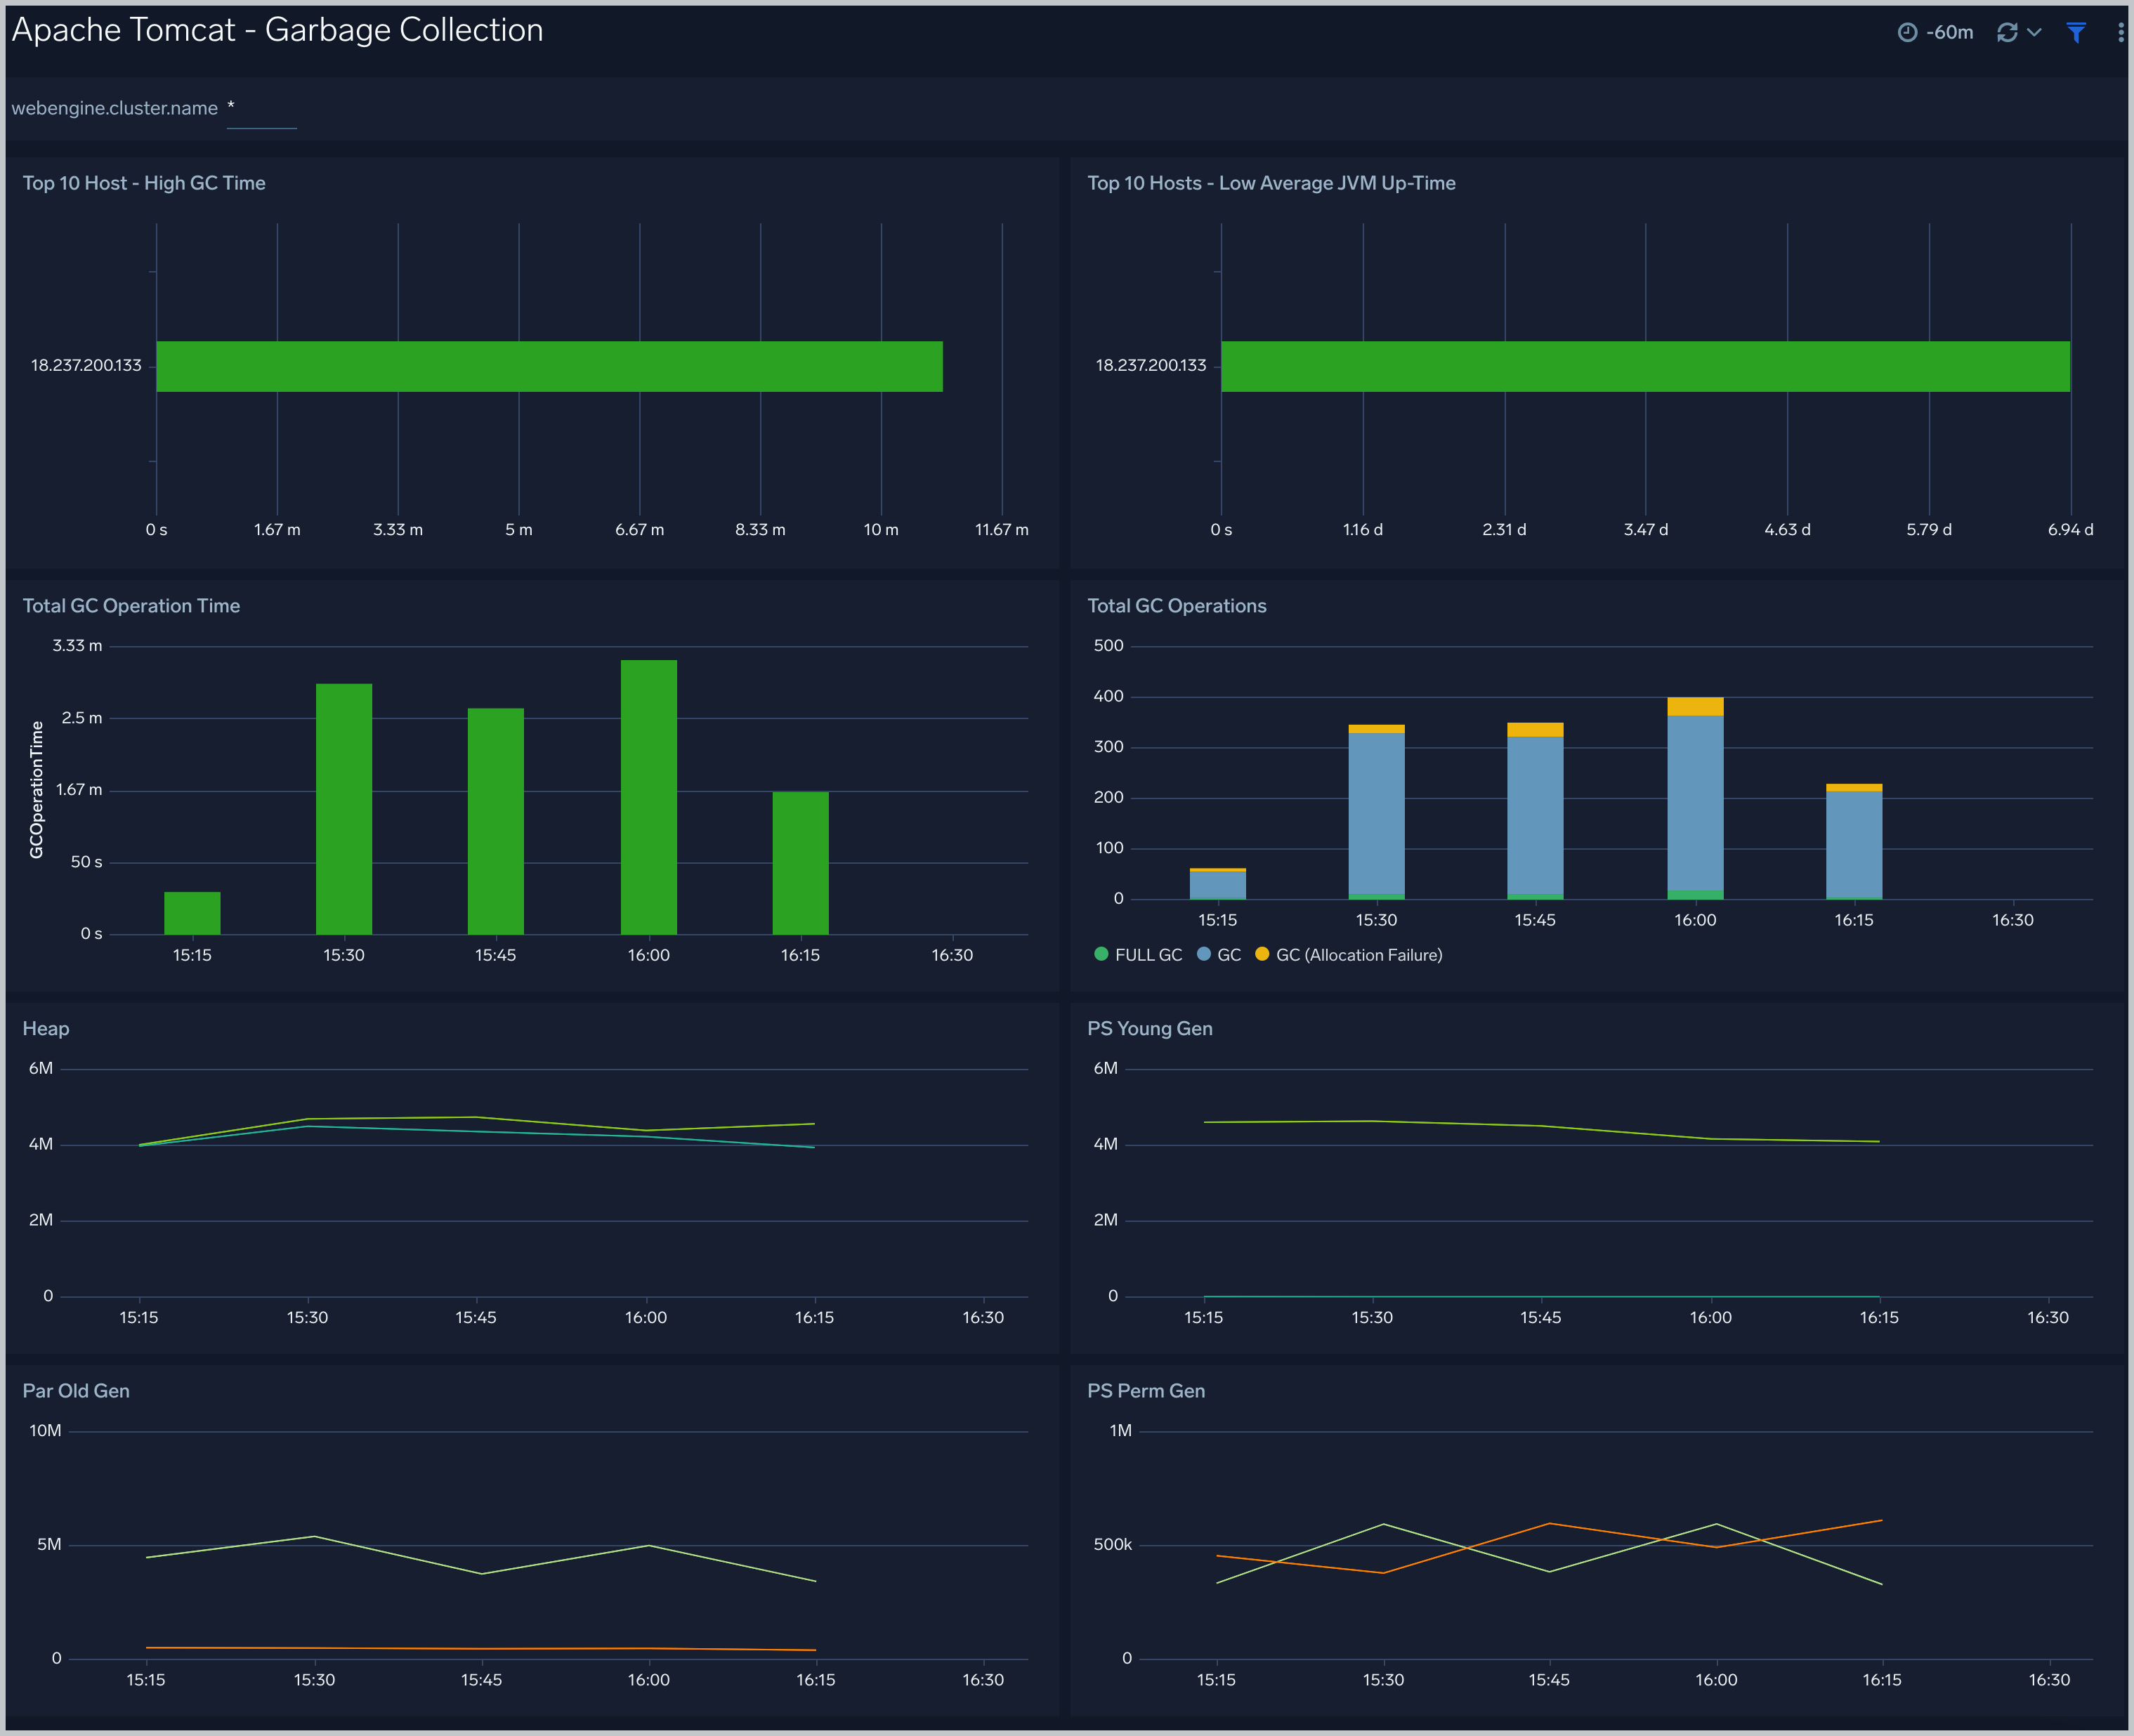
Garbage Collection
The Apache Tomcat - Garbage Collector dashboard provides information on the garbage collection of the Java Virtual Machine.
Top 10 Host - High GC Time. Displays the top 10 hosts with high garbage collection operation time as a bar chart for the last 12 hours.
Top 10 Hosts - Low Average JVM Up-Time. Shows the top 10 hosts by low average JVM up-time as a bar chart for the last 12 hours.
Total GC Operation Time. Provides the total garbage collection operation time by time slices of 15 minutes in a column chart on a timeline for the last 12 hours.
Total GC Operations. Displays the total number of times Full-GC and Minor-GC collection processes are executed in time slices of 15 minutes on a stacked column chart on a timeline for the past 12 hours.
Heap. Shows the total heap memory utilization just before garbage collection was executed vs. total heap memory utilization after garbage collection was executed, in a line chart on a timeline for the last 12 hours.
PS Young Gen. PS Young Gen also refers to "New Space," which is composed of Eden-Space and two Survivor-Spaces of identical size, usually called From and To. This panel shows Young Gen memory utilization just before garbage collection was executed vs. Young Gen memory utilization after garbage collection was executed. This part of the heap always gets garbage collected.
Par Old Gen. Par Old Gen is also referred to as "Tenured Space". This panel shows Old Gen memory utilization just before garbage collection was executed vs. Old Gen memory utilization after garbage collection was executed.
PS Perm Gen. PS Perm Gen is also referred to as "Permanent Space". This panel shows Perm Gen memory utilization just before garbage collection was executed vs. Perm Gen memory utilization after garbage collection was executed.
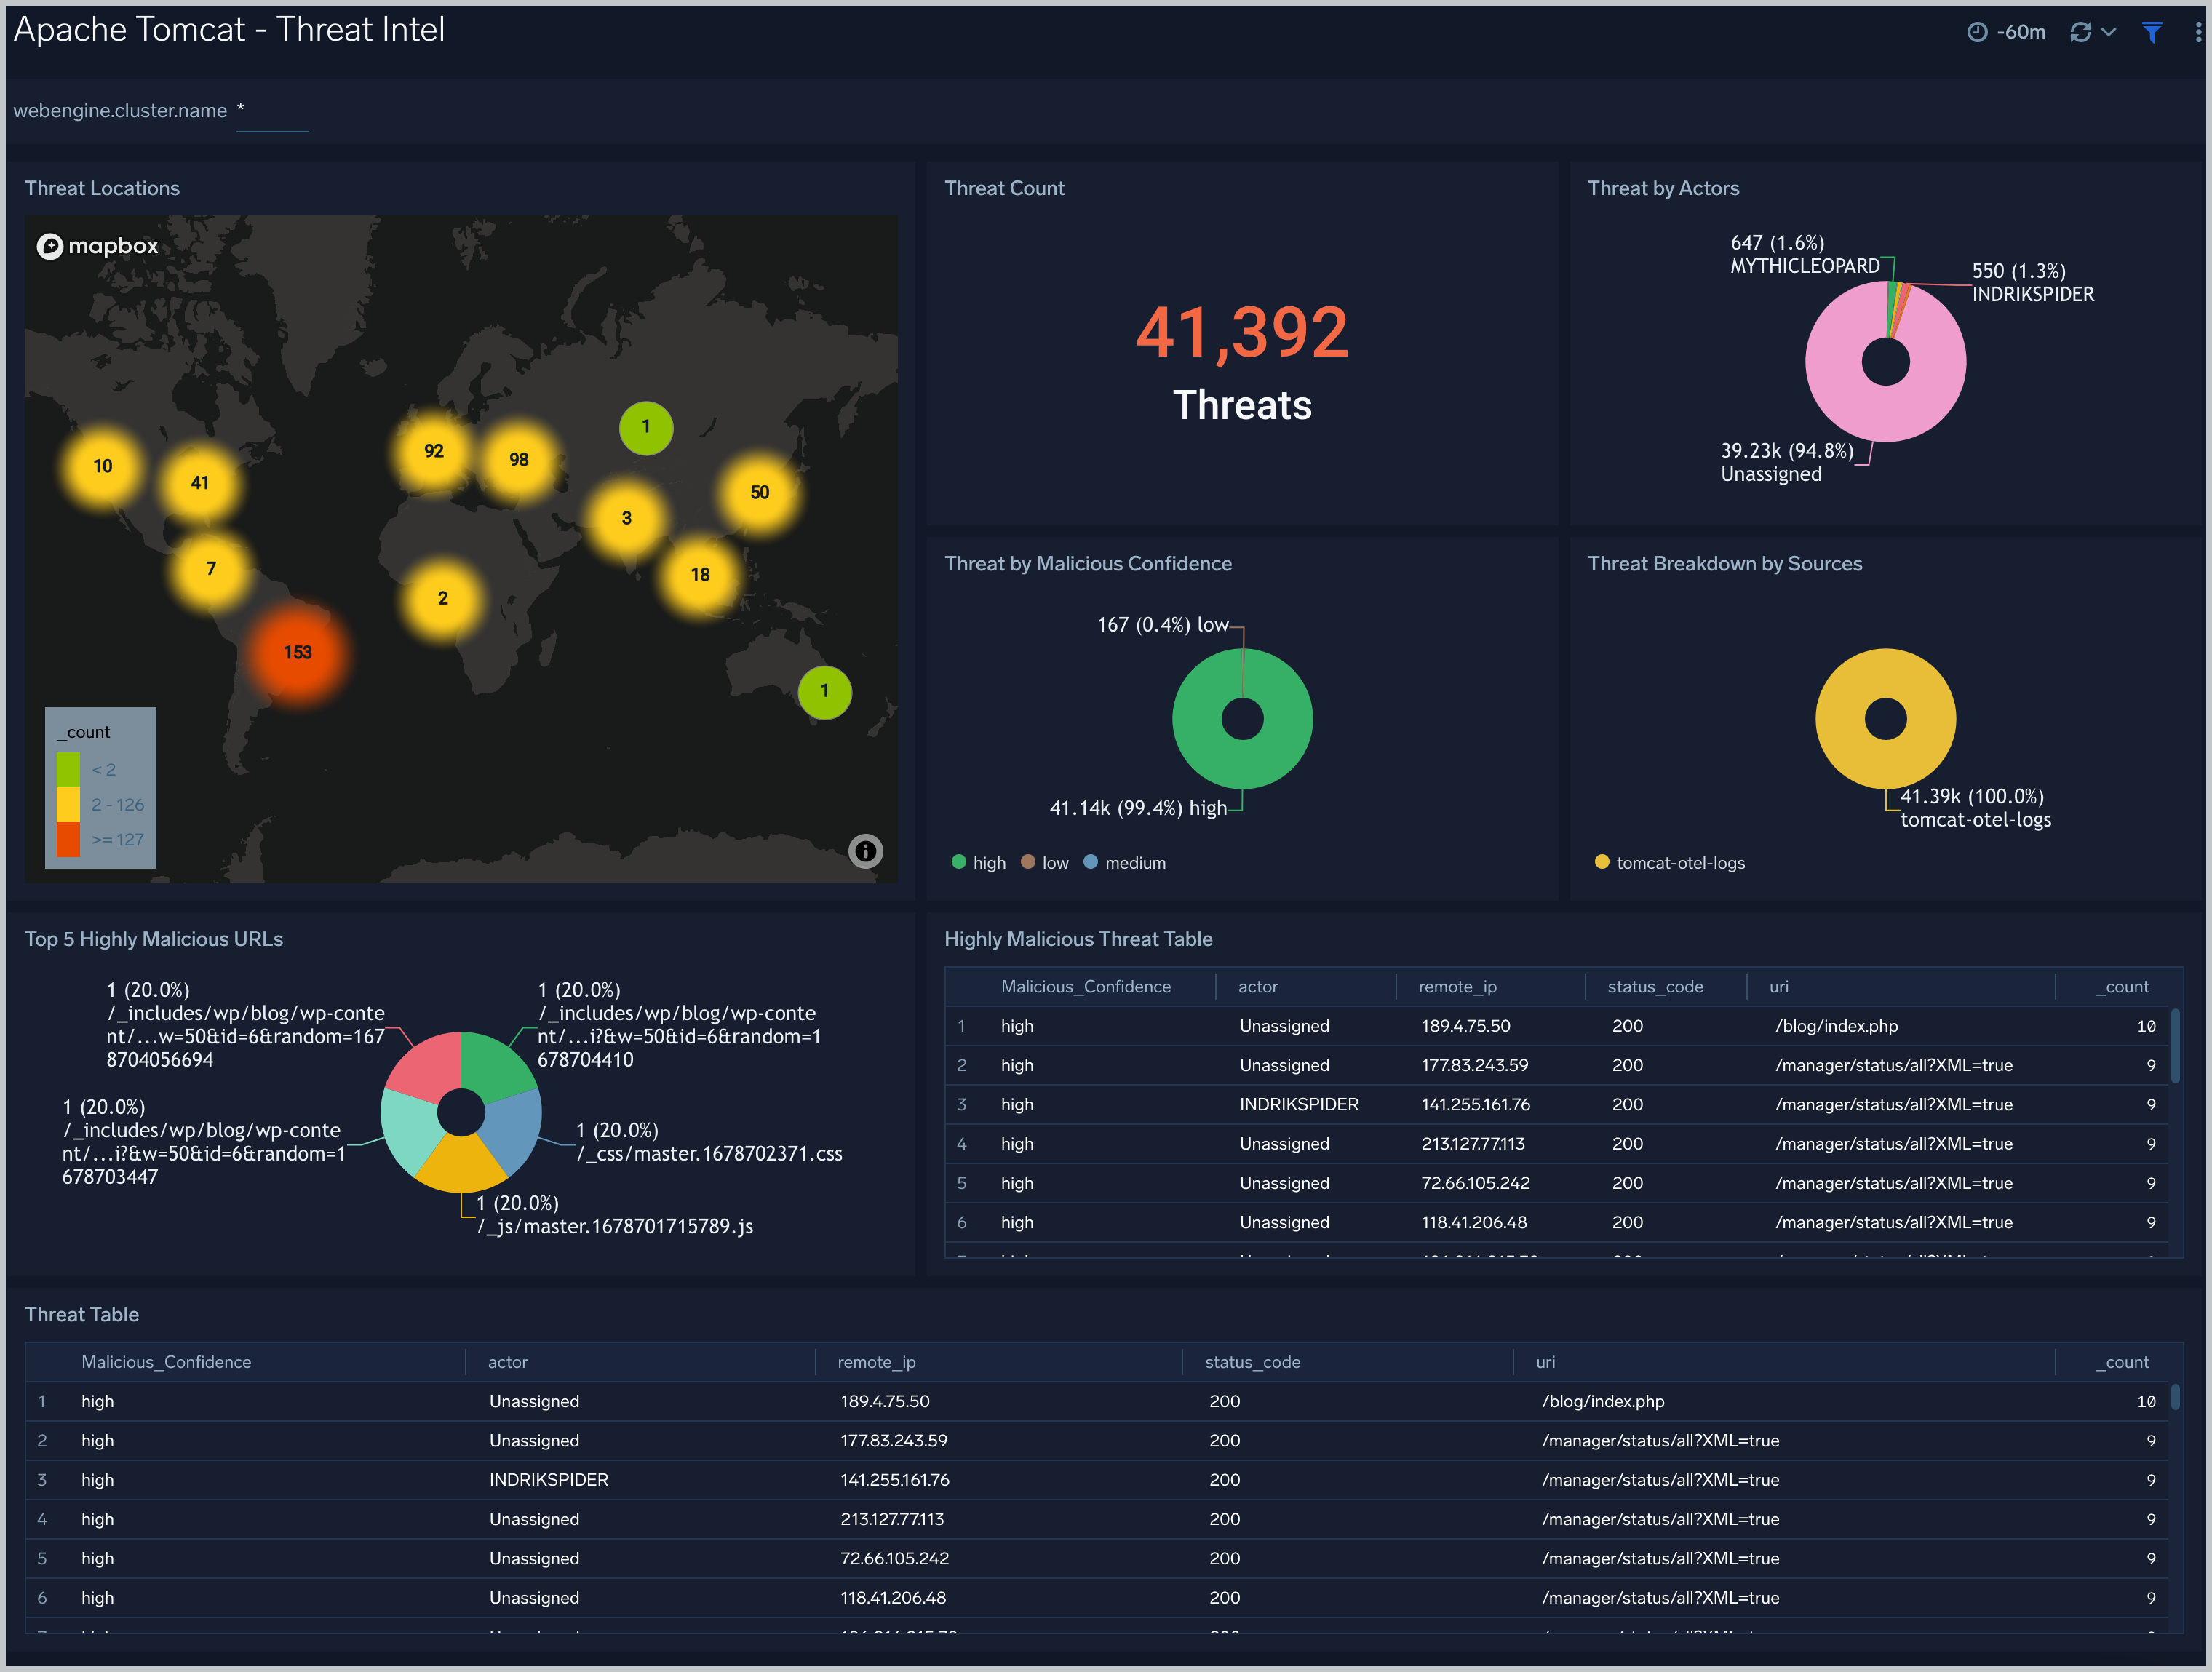
Threat intel
The Apache Tomcat - Threat Intel dashboard provides an at-a-glance view of threats to Apache Tomcat servers on your network. Dashboard panels display the threat count over a selected time period, geographic locations where threats occurred, source breakdown, actors responsible for threats, severity, and a correlation of IP addresses, method, and status code of threats.
Use this dashboard to:
- To gain insights and understand threats in incoming traffic and discover potential IOCs. Incoming traffic requests are analyzed using the Sumo Logic - CrowdStrike threat feed.
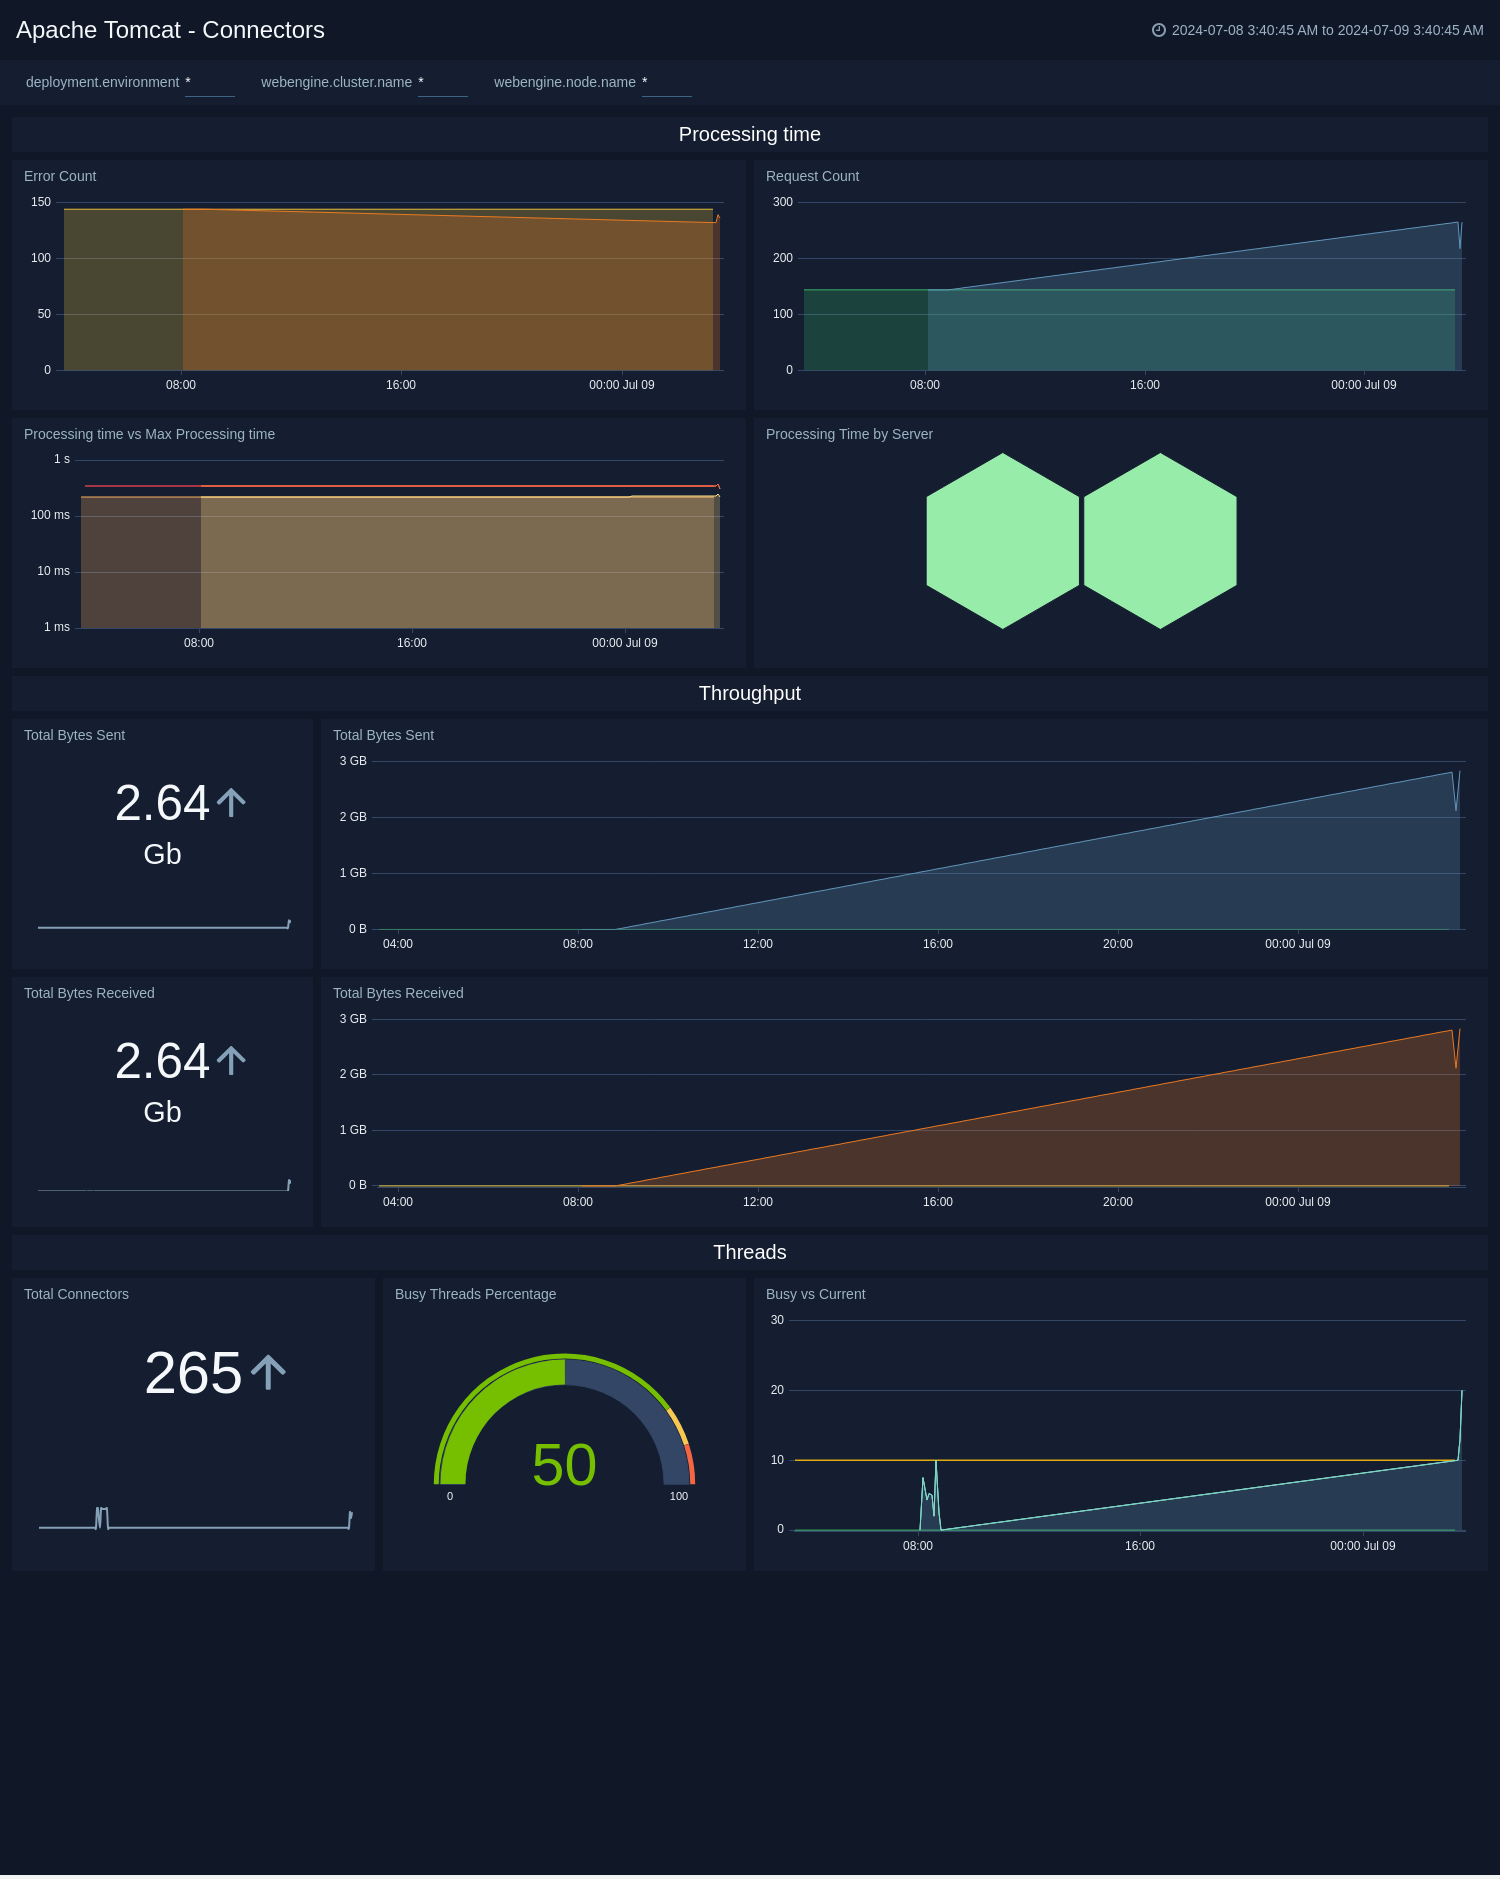
Connectors (metrics)
The Apache Tomcat - Connectors dashboard provides an at-a-glance view of error count, request count, request processing time, total bytes sent/received, total connections, and thread (bust and ideal) information.