Nginx - OpenTelemetry Collector

Nginx is a web server used as a reverse proxy, load balancer, mail proxy, and HTTP cache. The Sumo Logic app for Nginx helps you monitor activity in Nginx. The preconfigured dashboards provide information about site visitors, including the location of visitors, devices/operating systems, and browsers used, and information about server activity, including bots, observed, and error information.
The app has been tested with Nginx version: 1.19.8, 1.21.4, 1.23.1.
We use the OpenTelemetry collector for Nginx metric collection and for collecting Nginx logs.
The diagram below illustrates the components of the Nginx collection for each web server.
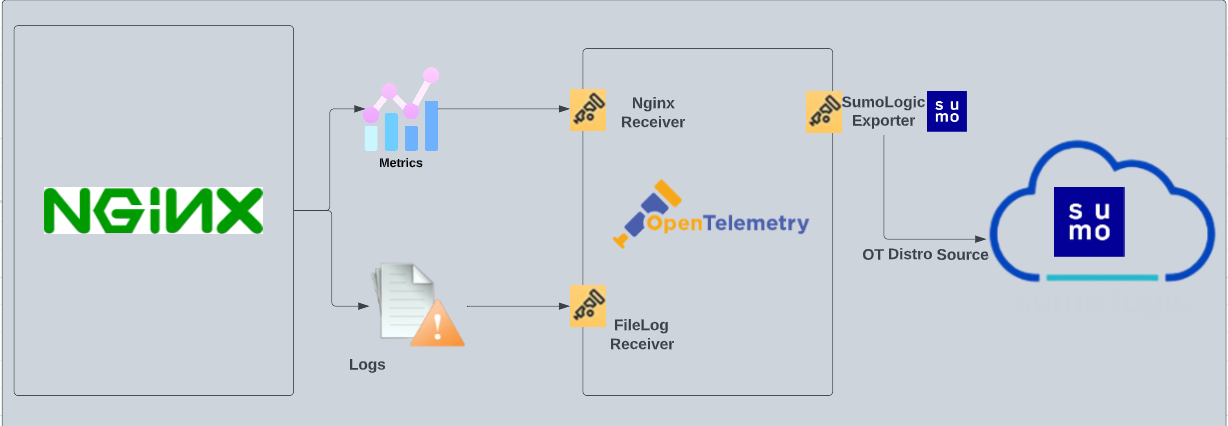
OpenTelemetry collector runs on the same host as Nginx, and uses the Nginx Receiver to obtain Nginx metrics, and the Sumo Logic OpenTelemetry Exporter to send the metrics to Sumo Logic. Nginx logs are sent to Sumo Logic through a filelog receiver.
Log and metrics types
The Sumo Logic app for Nginx assumes:
- Nginx app supports the default access logs and error logs format.
- For a list of metrics that are collected and used by the app, see Nginx Metrics.
Fields Creation in Sumo Logic for Nginx
Following are the Fields which will be created as part of Nginx App install if not already present.
webengine.cluster.name. User configured.Enter a name to uniquely identify your Nginx web server cluster. This cluster name will be shown in the Sumo Logic dashboards.webengine.node.name. Has value of host name.webengine.system. Has fixed value of nginx.sumo.datasource. Has fixed value of nginx.
Prerequisites
For metrics collection
-
This collection fetches stats from a Nginx Web Server instance using the
/statusendpoint. The app has been tested with Nginx versions 1.19.8, 1.21.4, and 1.23.1. -
You must configure NGINX to expose status information by editing the NGINX configuration. Refer to ngx_http_stub_status_module guide to configure the NGINX stats module ngx_http_stub_status_module.
For logs collection
- Configure your Nginx server to expose status endpoint for collecting metrics: The receiver used gets stats from an Nginx Web Server instance using the status endpoint. In order to receive server statistics, you must configure the server's nginx.conf file to enable status support.
- Configure and retrieve access and error log files: Before you can configure Sumo Logic to ingest logs, you must configure the logging of errors and processed requests in NGINX Open Source and NGINX Plus. For instructions, refer to the following documentation.
For Linux systems with ACL Support, the otelcol install process should have created the ACL grants necessary for the otelcol system user to access default log locations. You can verify the active ACL grants using the getfacl command. Install the ACL in your Linux environment, if not installed.
The required ACL may not be supported for some rare cases, for example, Linux OS Distro, which is officially not supported by Sumo Logic. In this case, you can run the following command to explicitly grant the permissions.
sudo setfacl -R -m d:u:otelcol-sumo:r-x,d:g:otelcol-sumo:r-x,u:otelcol-sumo:r-x,g:otelcol-sumo:r-x <PATH_TO_LOG_FILE>
Run the above command for all the log files in the directory that need to be ingested, which are not residing in the default location.
If Linux ACL Support is not available, traditional Unix-styled user and group permission must be modified. It should be sufficient to add the otelcol system user to the specific group that has access to the log files.
For Windows systems, log files which are collected should be accessible by the SYSTEM group. Use the following set of PowerShell commands if the SYSTEM group does not have access.
$NewAcl = Get-Acl -Path "<PATH_TO_LOG_FILE>"
# Set properties
$identity = "NT AUTHORITY\SYSTEM"
$fileSystemRights = "ReadAndExecute"
$type = "Allow"
# Create new rule
$fileSystemAccessRuleArgumentList = $identity, $fileSystemRights, $type
$fileSystemAccessRule = New-Object -TypeName System.Security.AccessControl.FileSystemAccessRule -ArgumentList $fileSystemAccessRuleArgumentList
# Apply new rule
$NewAcl.SetAccessRule($fileSystemAccessRule)
Set-Acl -Path "<PATH_TO_LOG_FILE>" -AclObject $NewAcl
Collection configuration and app installation
As part of data collection setup and app installation, you can select the App from App Catalog and click on Install App. Follow the steps below.
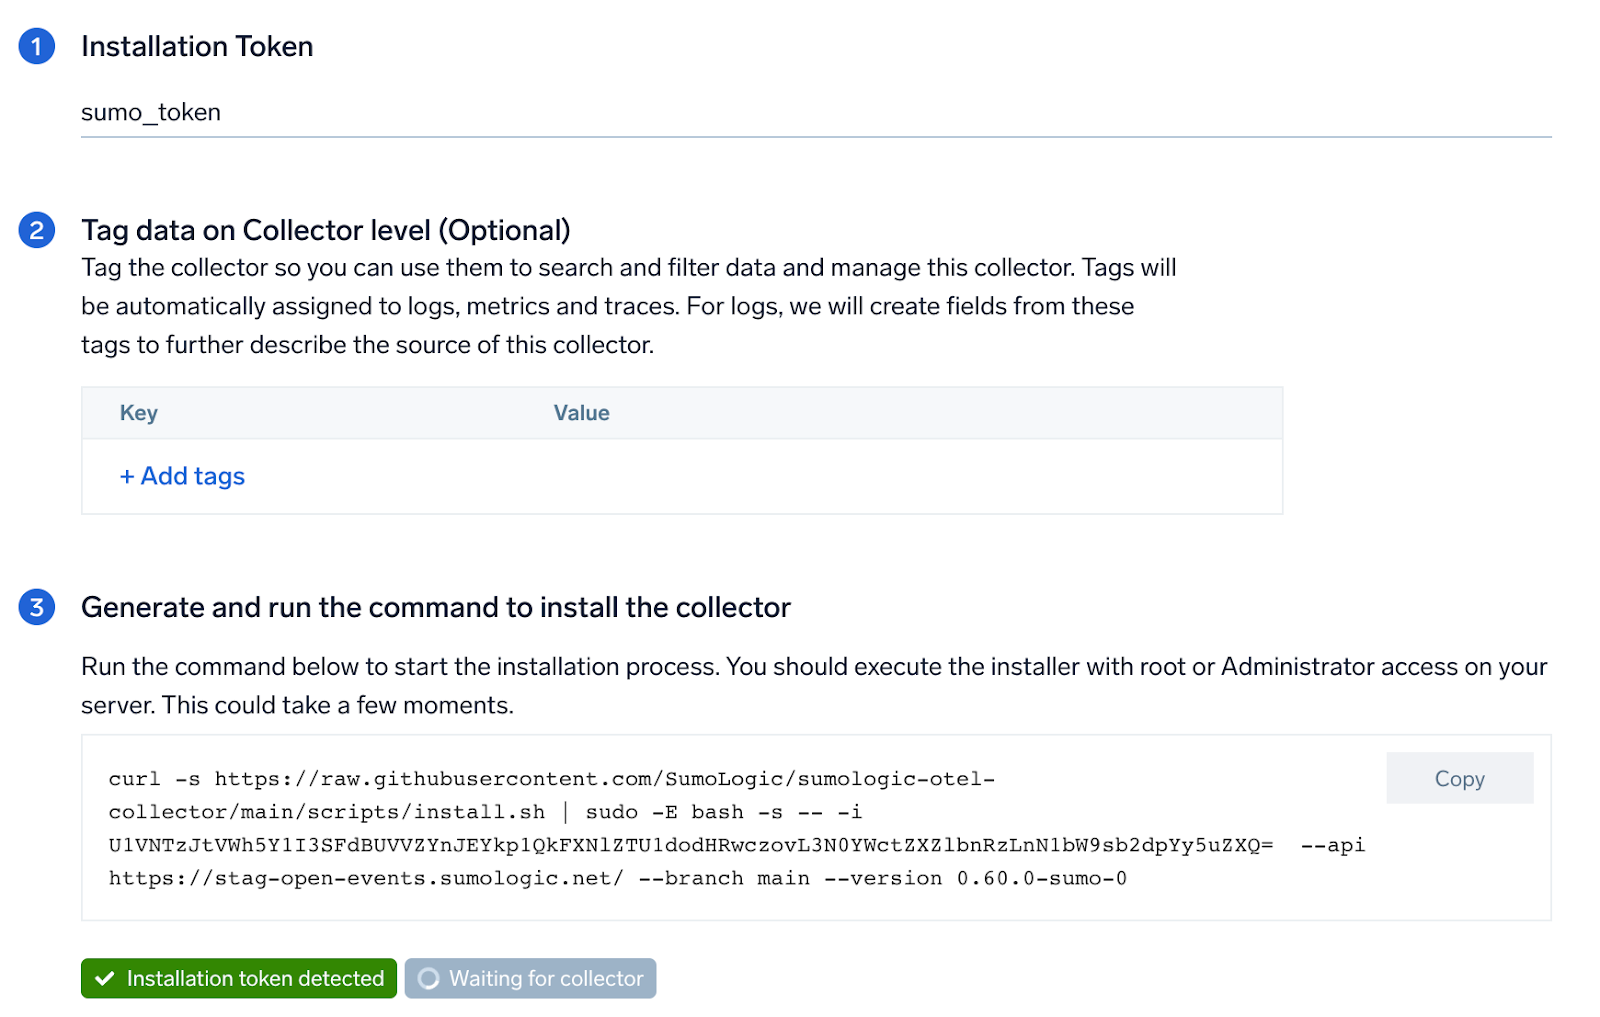
Step 1: Set up OpenTelemetry Collector
If you want to use an existing OpenTelemetry Collector, you can skip this step by selecting the Use an existing Collector option.
To create a new Collector:
- Select the Add a new Collector option.
- Select the platform where you want to install the Sumo Logic OpenTelemetry Collector.
This will generate a command that you can execute in the machine environment you need to monitor. Once executed, it will install the Sumo Logic OpenTelemetry Collector.
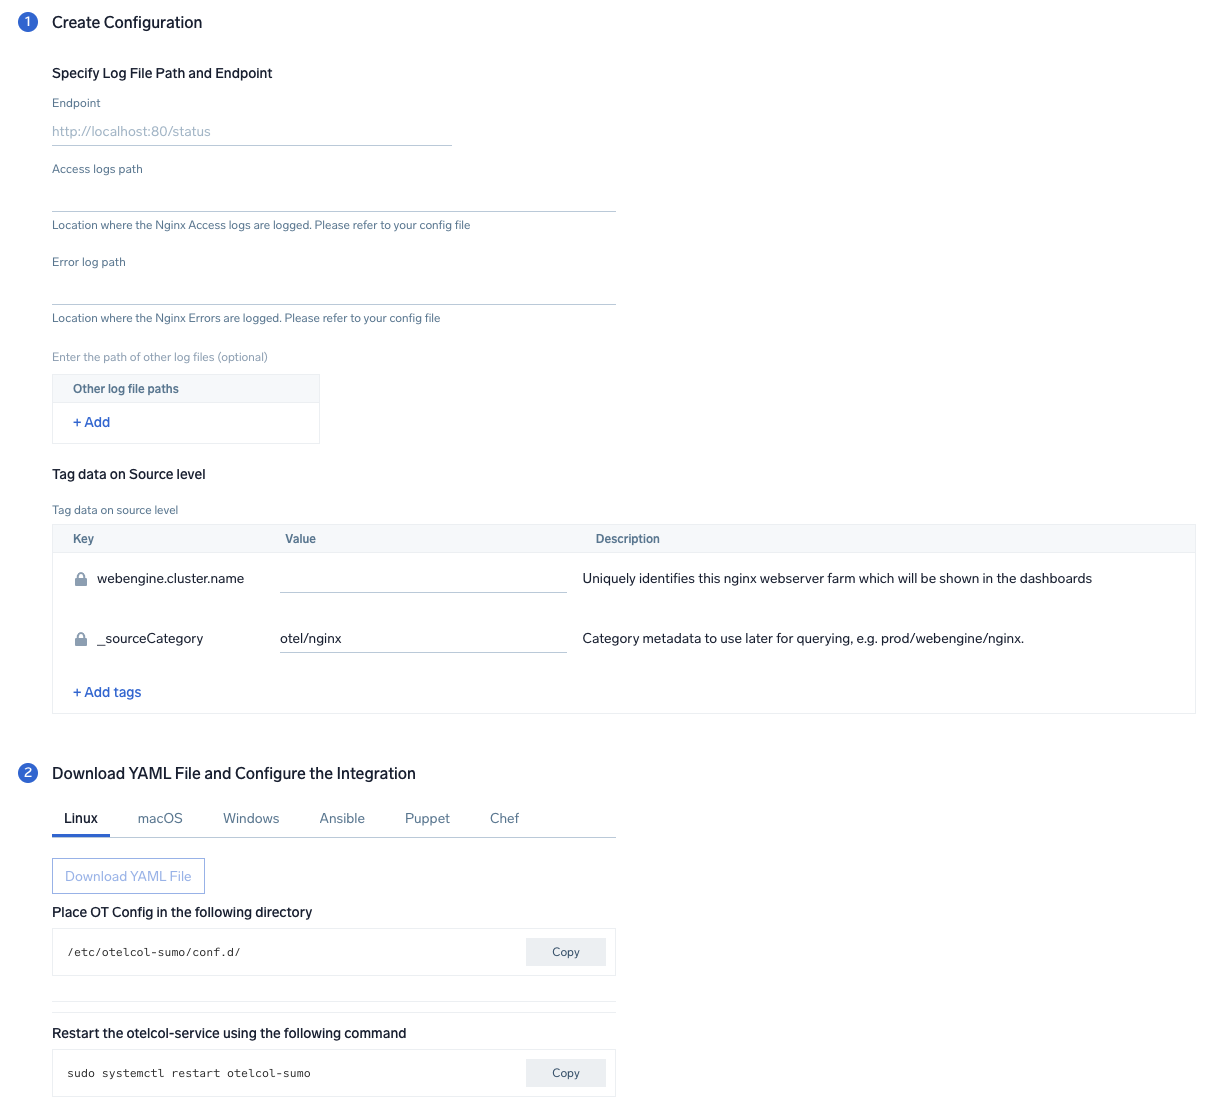
Step 2: Configure integration
In this step, you will configure the yaml required for Nginx Collection.
Below are the inputs required:
- Endpoint. The URL of the status endpoint (default:
http://localhost:80/status). - Access File log Path. Enter the path to the Access log file for your nginx instance.
- Error file log path. Enter the path to the error log file for your nginx instance.
- Fields.
webengine.cluster.nameUser configured. Enter a name to identify this nginx cluster. This cluster name will be shown in the Sumo Logic dashboards.
Click on the Download YAML File button to get the yaml file.
Step 3: Send logs and metrics to Sumo Logic
Once you have downloaded the YAML file as described in the previous step, follow the below steps based on your platform.
- Linux
- Windows
- macOS
- Chef
- Ansible
- Puppet
- Copy the yaml to the
/etc/otelcol-sumo/conf.d/folder for the Nginx instance which needs to be monitored. - Restart the collector using:
sudo systemctl restart otelcol-sumo
- Copy the yaml to the
C:\ProgramData\Sumo Logic\OpenTelemetry Collector\config\conf.dfolder in the machine which needs to be monitored. - Restart the collector using
Restart-Service -Name OtelcolSumo
- Copy the yaml to the
/etc/otelcol-sumo/conf.d/folder in the Nginx instance which needs to be monitored. - Restart the otelcol-sumo process using the below command:
otelcol-sumo --config /etc/otelcol-sumo/sumologic.yaml --config "glob:/etc/otelcol-sumo/conf.d/*.yaml"
- Copy the yaml file into your Chef cookbook files directory
files/<downloaded_yaml_file>. - Use a Chef file resource in a recipe to manage it.
cookbook_file '/etc/otelcol-sumo/conf.d/<downloaded_yaml_file>' do mode 0644 notifies :restart, 'service[otelcol-sumo]', :delayed end - Add the recipe to your collector setup to start collecting the data. Every team typically has their established way of applying the Chef recipe. The resulting Chef recipe should look something like:
cookbook_file '/etc/otelcol-sumo/conf.d/<downloaded_yaml_file>' do
mode 0644
notifies :restart, 'service[otelcol-sumo]', :delayed
end
- Place the file into your Ansible playbook files directory.
- Run the Ansible playbook.
ansible-playbook -i inventory install_sumologic_otel_collector.yaml
-e '{"installation_token": "<YOUR_TOKEN>", "collector_tags": {<YOUR_TAGS>}, "src_config_path": "files/conf.d"}'
- Place the file into your Puppet module files directory
modules/install_otel_collector/files/<downloaded_yaml>. - Use a Puppet file resource to manage it.
file { '/etc/otelcol-sumo/conf.d/<downloaded_yaml_file>':
    ensure => present,
    source => 'puppet:///modules/install_otel_collector/<downloaded_yaml_file>',
    mode => '0644',
    notify => Service[otelcol-sumo],
} - Apply the Puppet manifest. Every team typically has their established way of applying the Puppet manifest. The resulting Puppet manifest should look something like:
node 'default' {
    class { 'install_otel_collector'
      installation_token => '<YOUR_TOKEN>',
      collector_tags => { <YOUR_TAGS> },
    }

    service { 'otelcol-sumo':
      provider => 'systemd',
      ensure => running,
      enable => true,
      require => Class['install_otel_collector'],
    }

    file { '/etc/otelcol-sumo/conf.d/<downloaded_yaml_file>':
      ensure => present,
      source => 'puppet:///modules/install_otel_collector/<downloaded_yaml_file>',
      mode => '0644',
      notify => Service[otelcol-sumo],
    }
  }
After successfully executing the above command, Sumo Logic will start receiving data from your host machine.
Click Next. This will install the app (dashboards and monitors) to your Sumo Logic Org.
Dashboard panels will start to fill automatically. It's important to note that each panel fills with data matching the time range query and received since the panel was created. Results won't immediately be available, but within 20 minutes, you'll see full graphs and maps.
Viewing Nginx dashboards
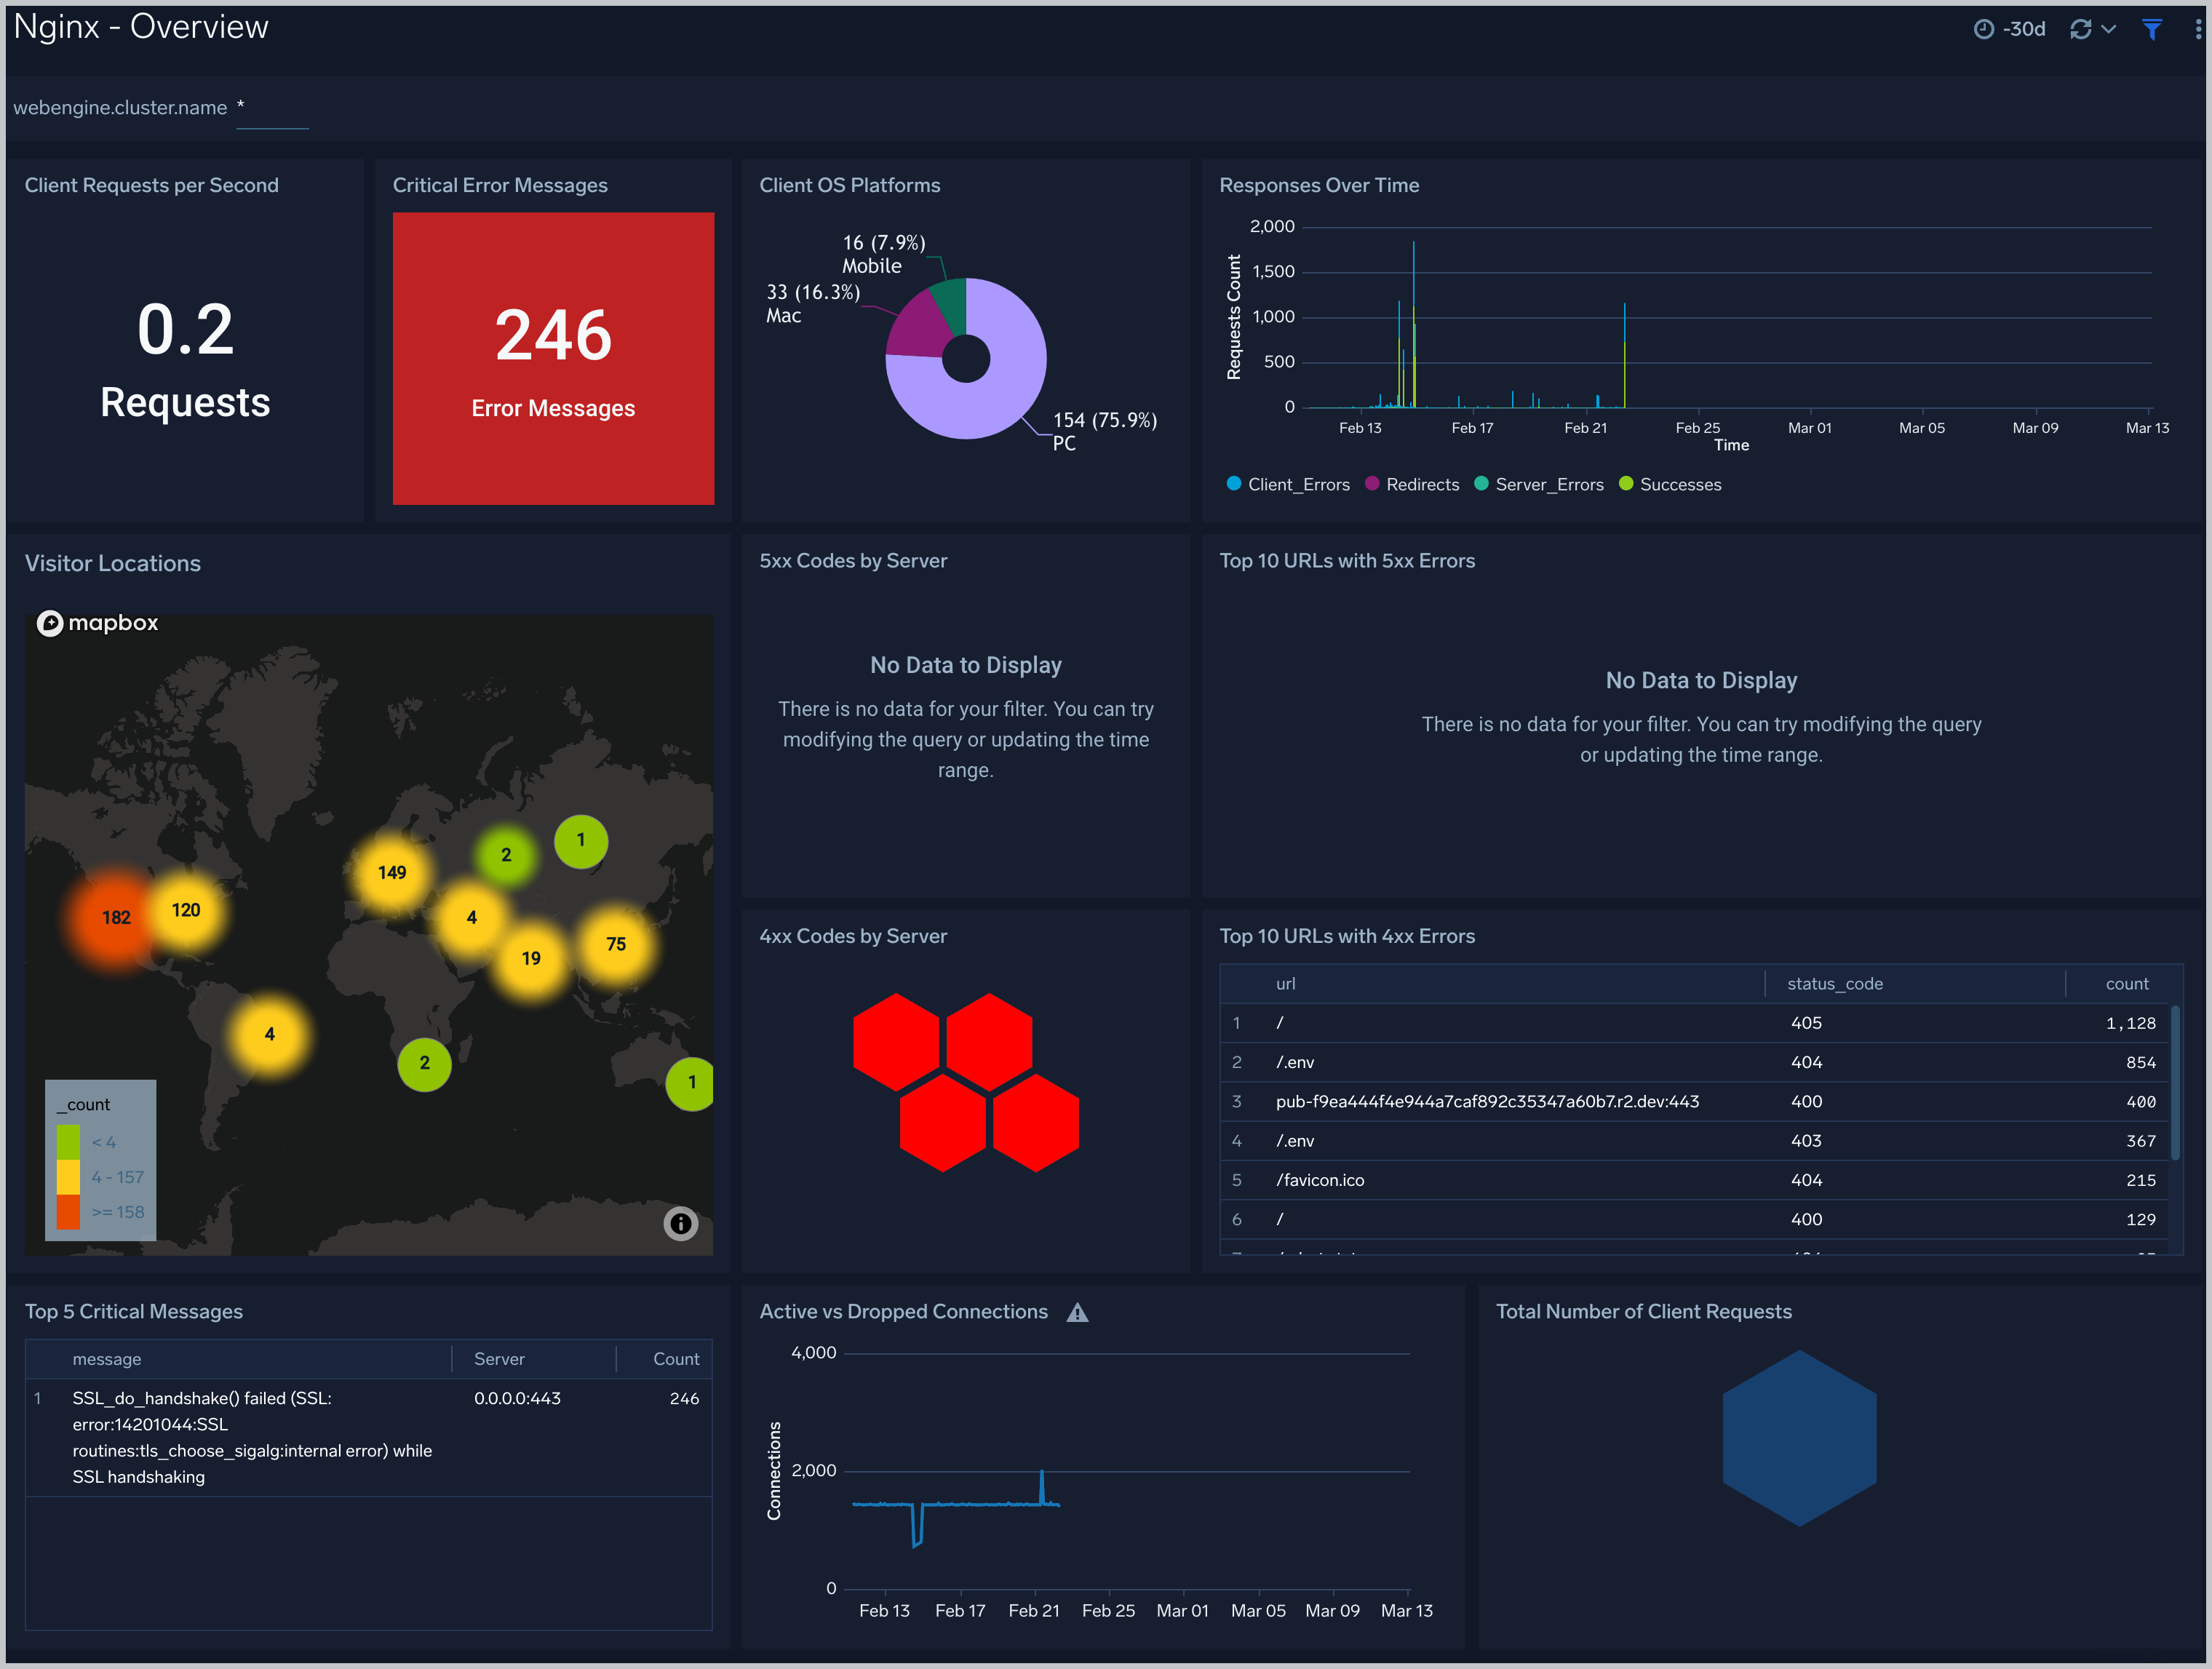
Overview
The Nginx - Overview dashboard provides an at-a-glance view of the NGINX server access locations, error logs along with connection metrics.
Use this dashboard to:
- Gain insights into originated traffic location by region. This can help you allocate computer resources to different regions according to their needs.
- Gain insights into your Nginx health using Critical Errors and Status of Nginx Server.
- Get insights into Active and dropped connection.
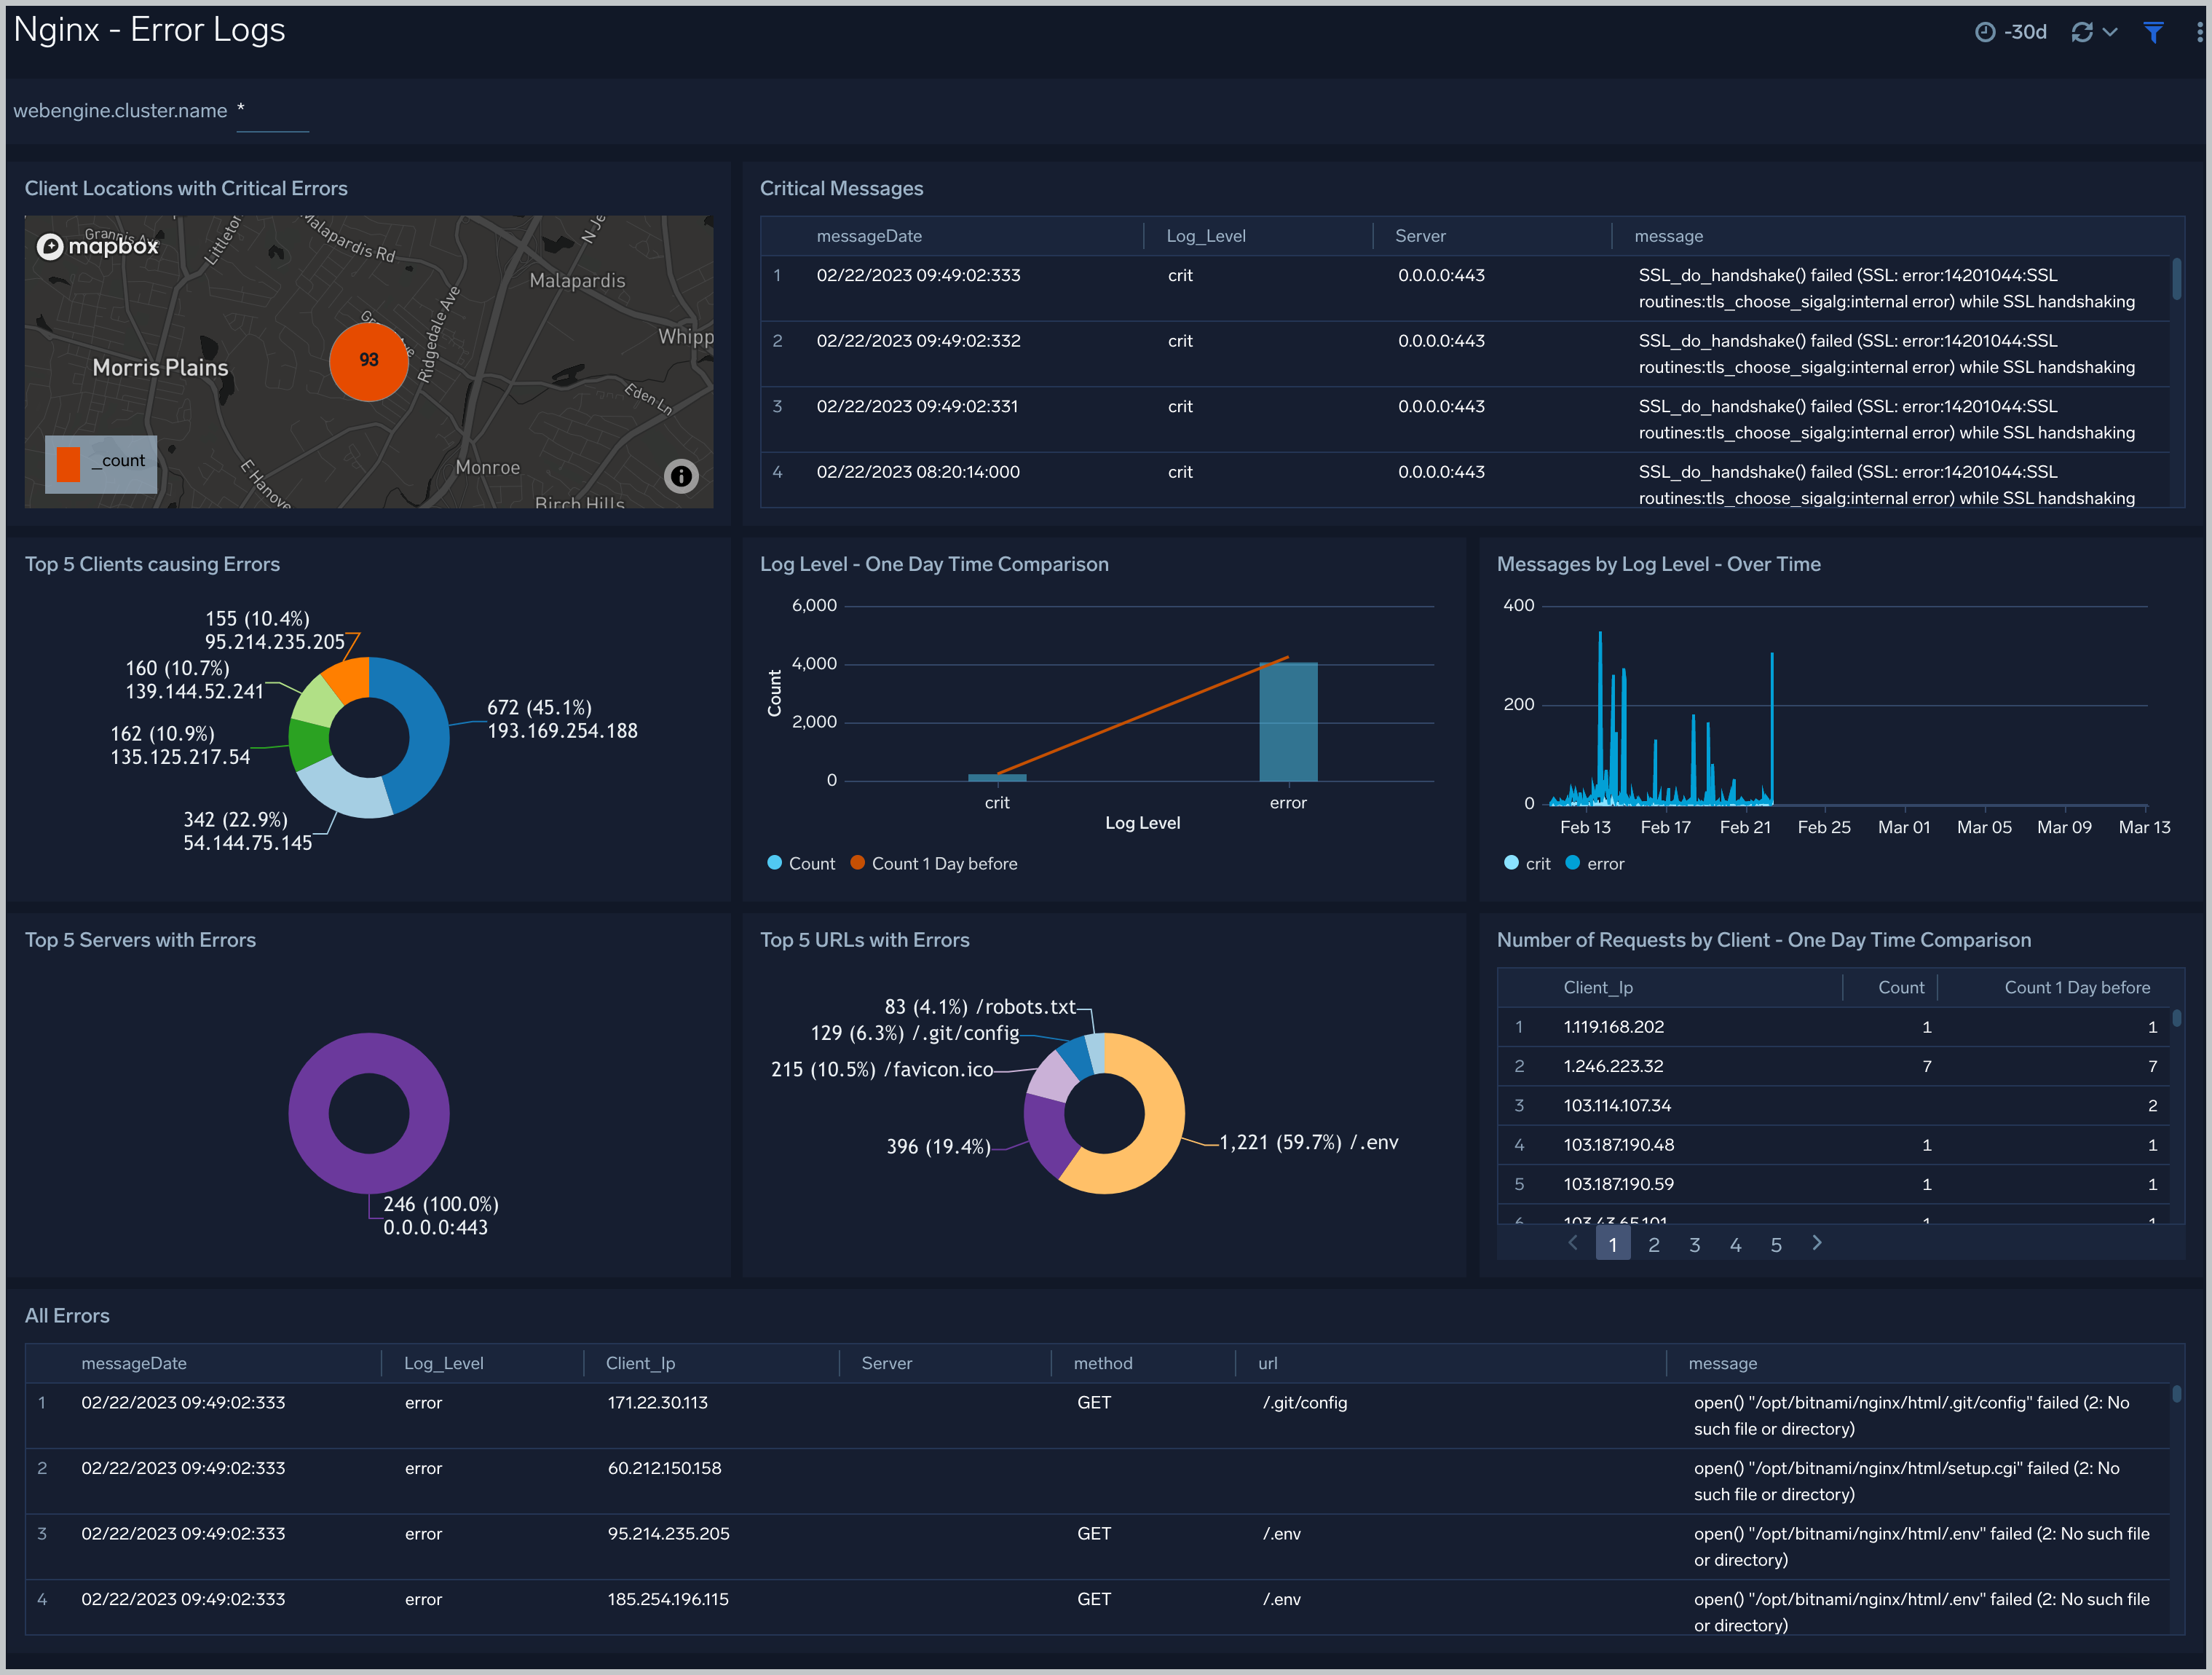
Error Logs
The Nginx - Error Logs Analysis dashboard provides a high-level view of log level breakdowns, comparisons, and trends. The panels also show the geographic locations of clients and clients with critical messages, new connections and outliers, client requests, request trends, and request outliers.
Use this dashboard to:
- Track requests from clients. A request is a message asking for a resource, such as a page or an image.
- Track and view client geographic locations generating errors.
- Track critical alerts and emergency error alerts.
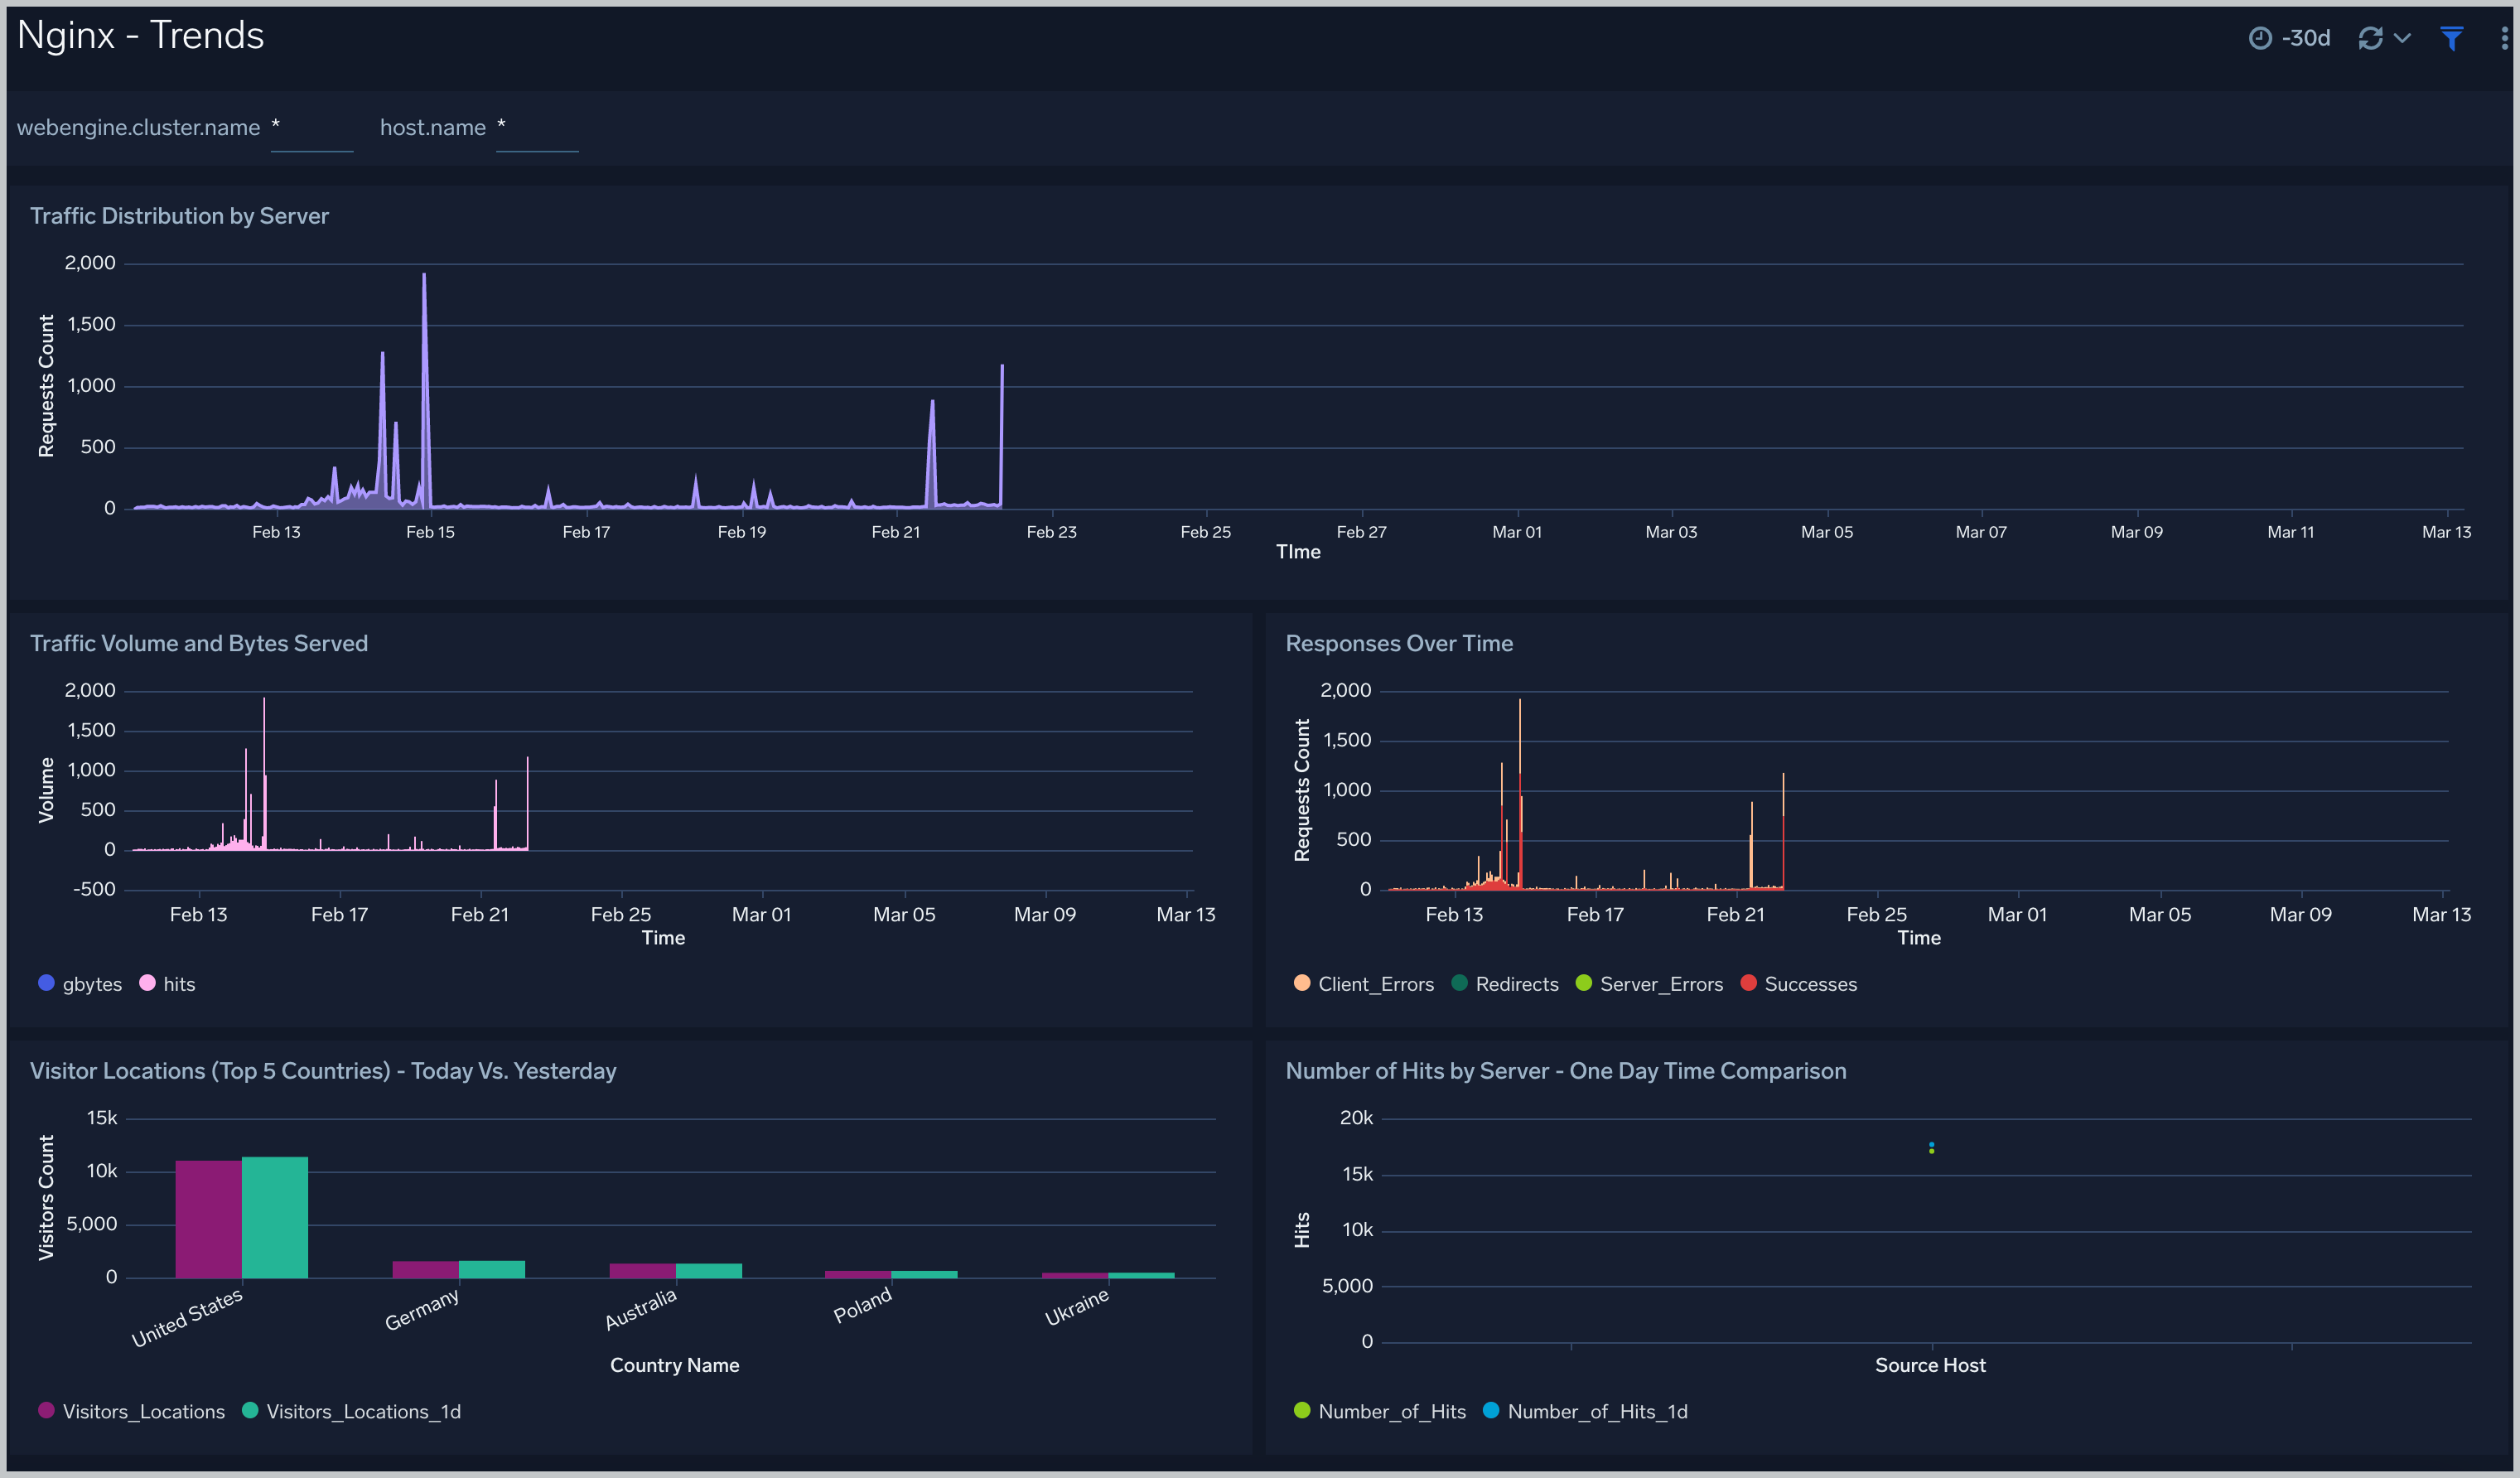
Trends
The Nginx - Trends dashboard provides a high-level view of the activity and health of Nginx servers on your network. Dashboard panels display visual graphs and detailed information on traffic volume and distribution, responses over time, as well as time comparisons for visitor locations and server hits.
Use this dashboard to:
- Understand the traffic distribution across servers, provide insights for resource planning by analyzing data volume and bytes served.
- Gain insights into originated traffic location by region. This can help you allocate compute resources to different regions according to their needs.
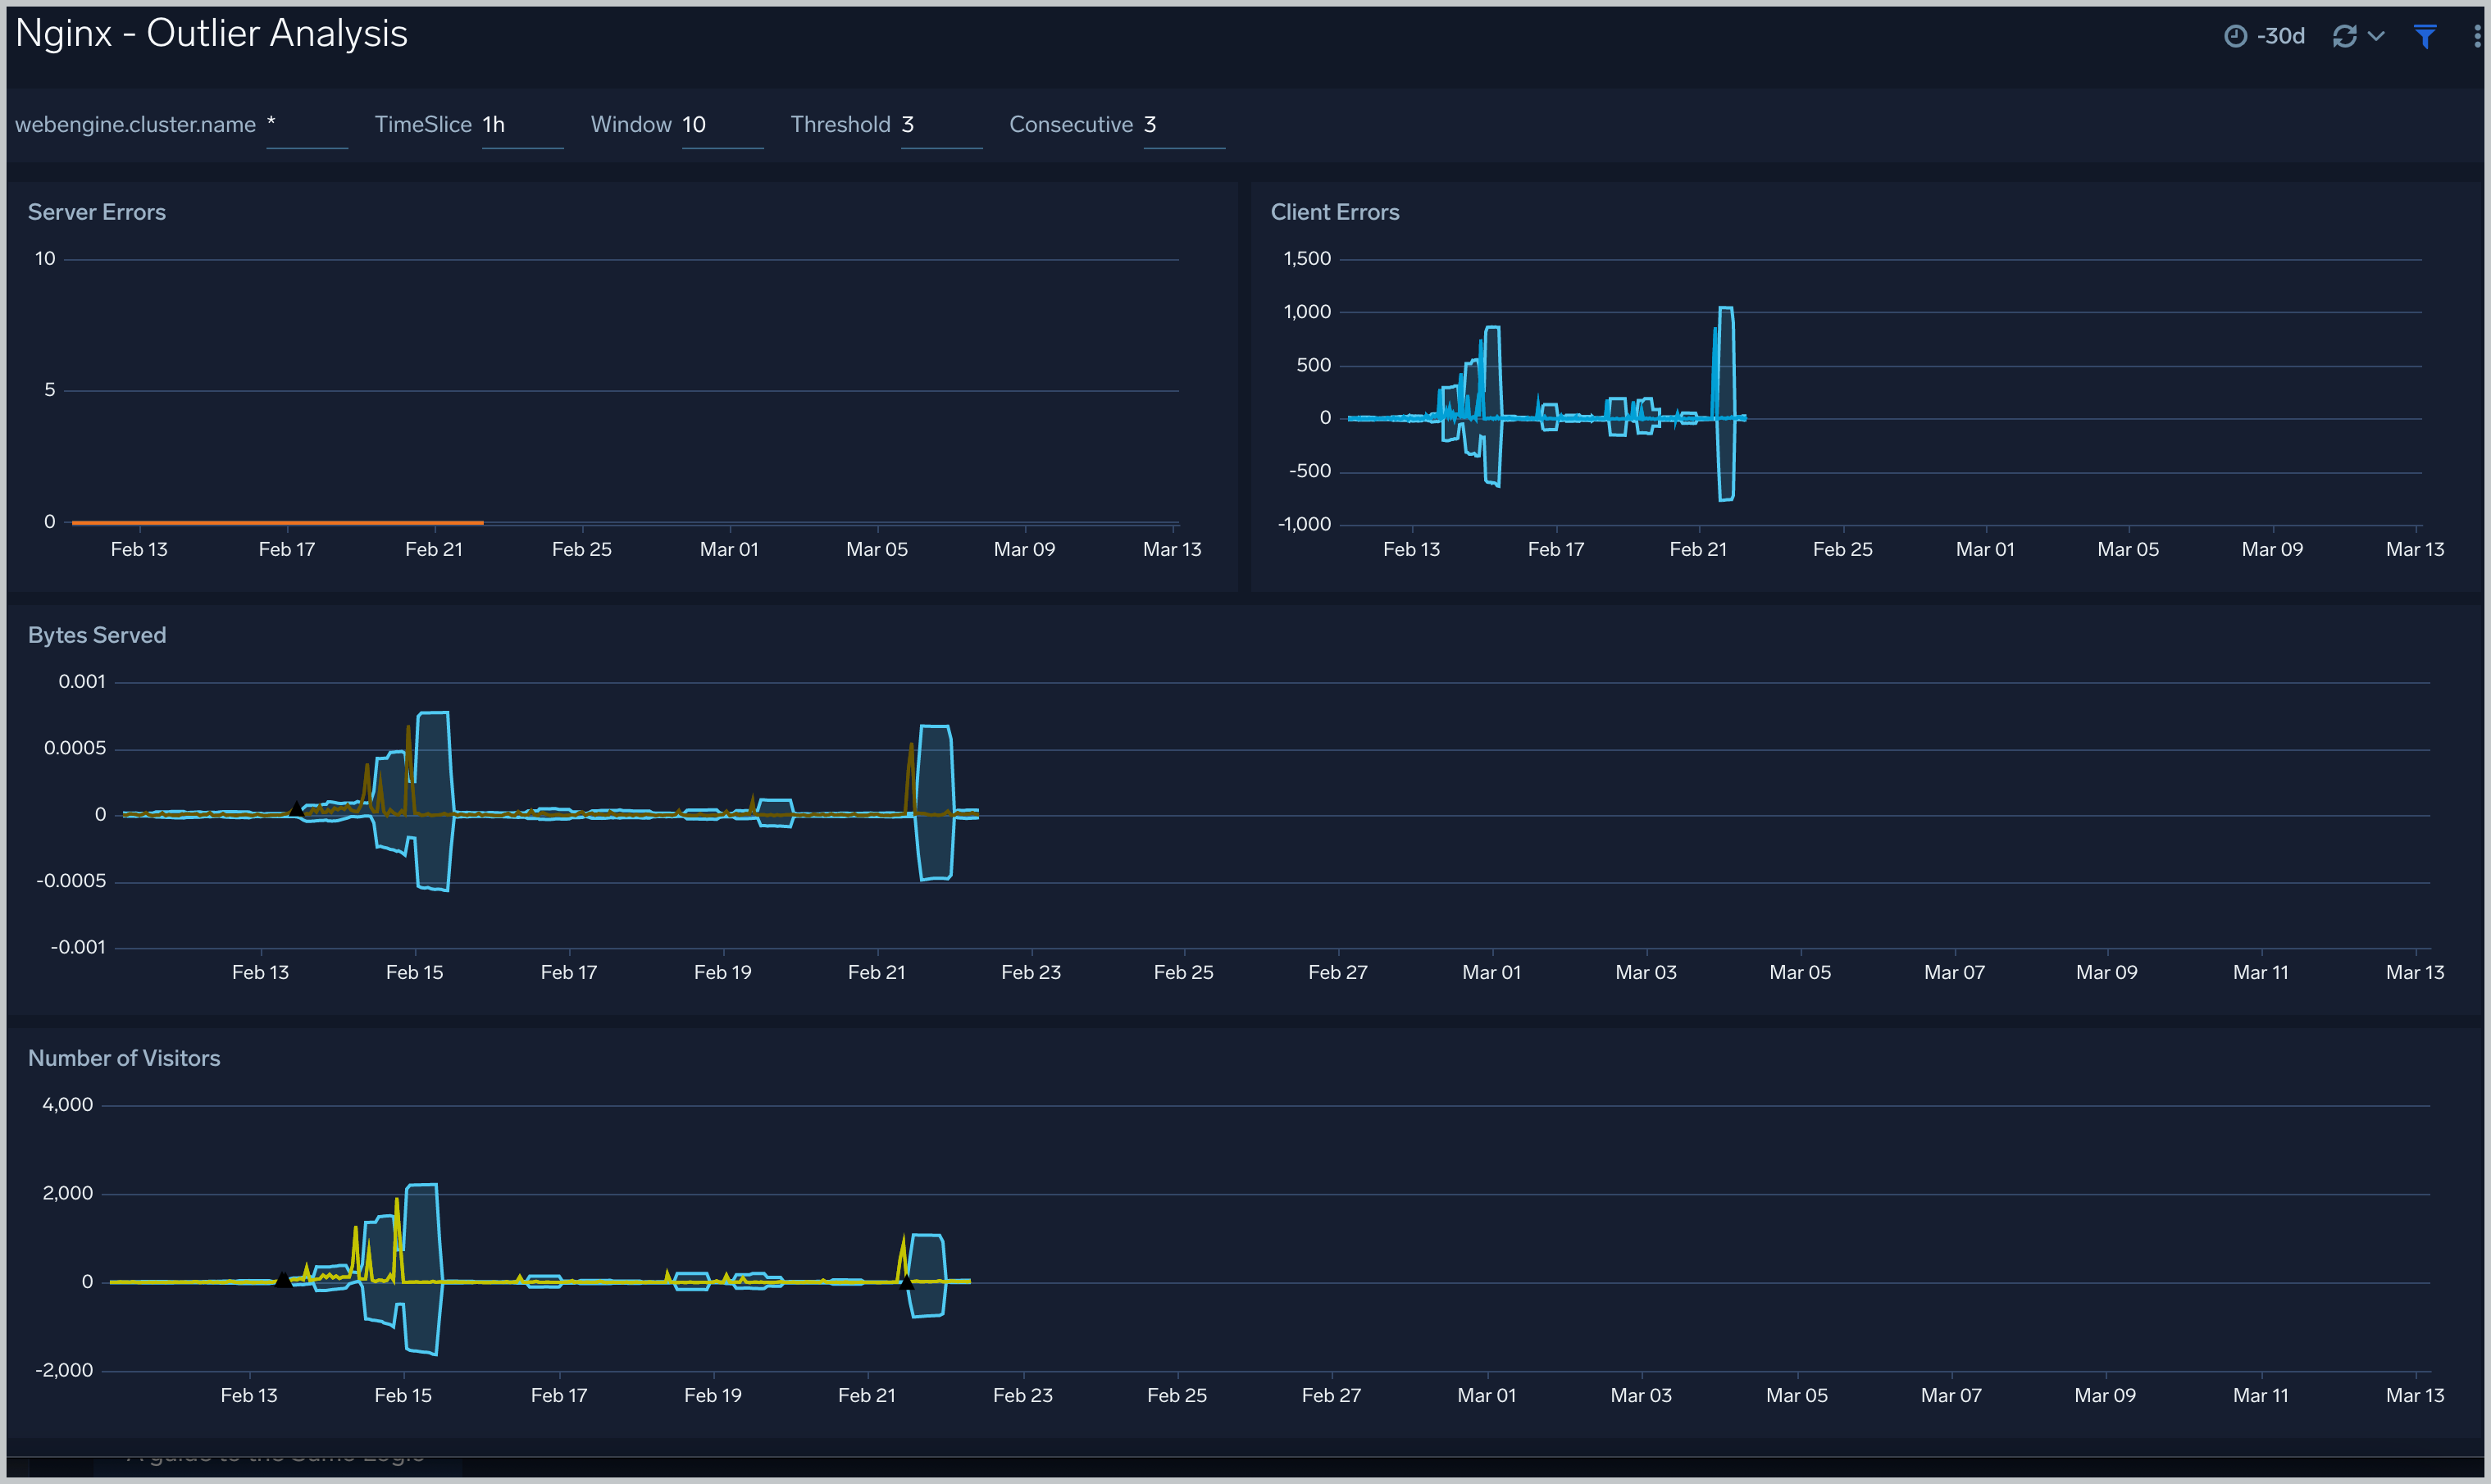
Outlier Analysis
The Nginx - Outlier Analysis dashboard provides a high-level view of Nginx server outlier metrics for bytes served, number of visitors, and server errors. You can select the time interval over which outliers are aggregated, then hover the cursor over the graph to display detailed information for that point in time.
Use this dashboard to:
- Detect outliers in your infrastructure with Sumo Logic's machine learning algorithm.
- Identify outliers in incoming traffic and the number of errors encountered by your servers.
You can use schedule searches to send alerts to yourself whenever there is an outlier detected by Sumo Logic.
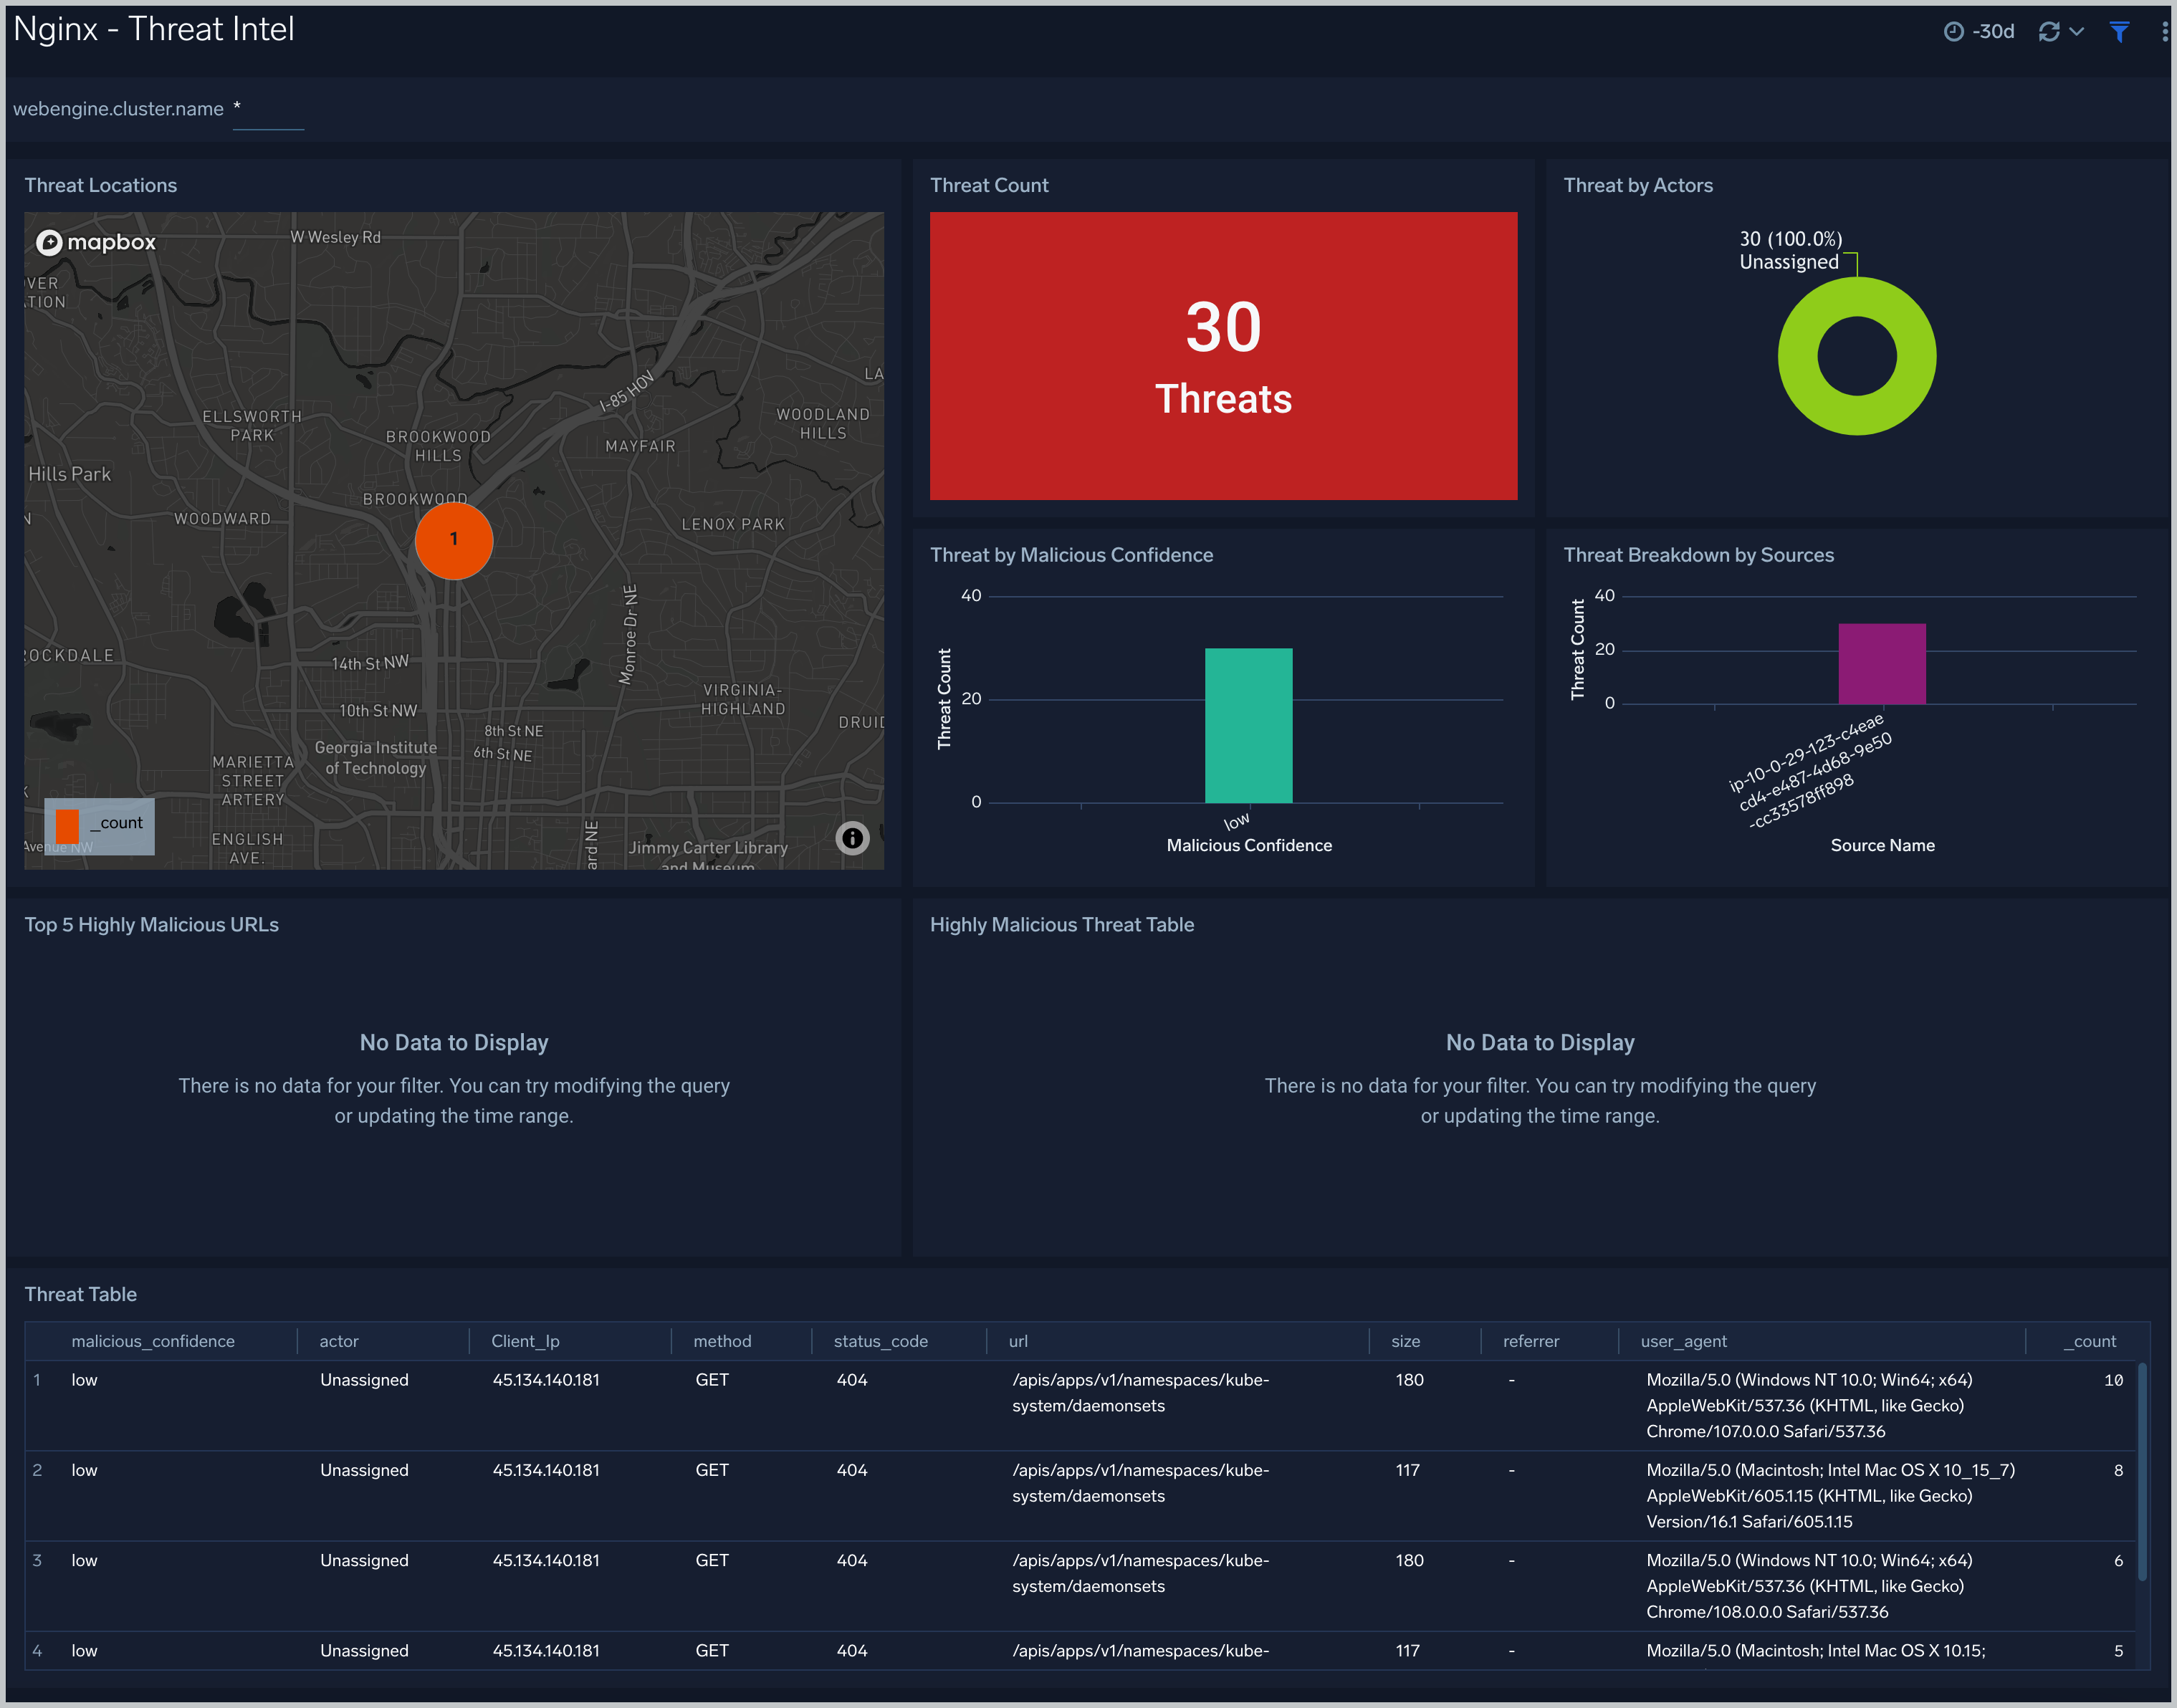
Threat Intel
The Nginx - Threat Intel dashboard provides an at-a-glance view of threats to Nginx servers on your network. Dashboard panels display the threat count over a selected time period, geographic locations where threats occurred, source breakdown, actors responsible for threats, severity, and a correlation of IP addresses, method, and status code of threats.
Use this dashboard to:
- Gain insights and understand threats in incoming traffic and discover potential IOCs. Incoming traffic requests are analyzed using the Sumo - Crowdstrikes threat feed.
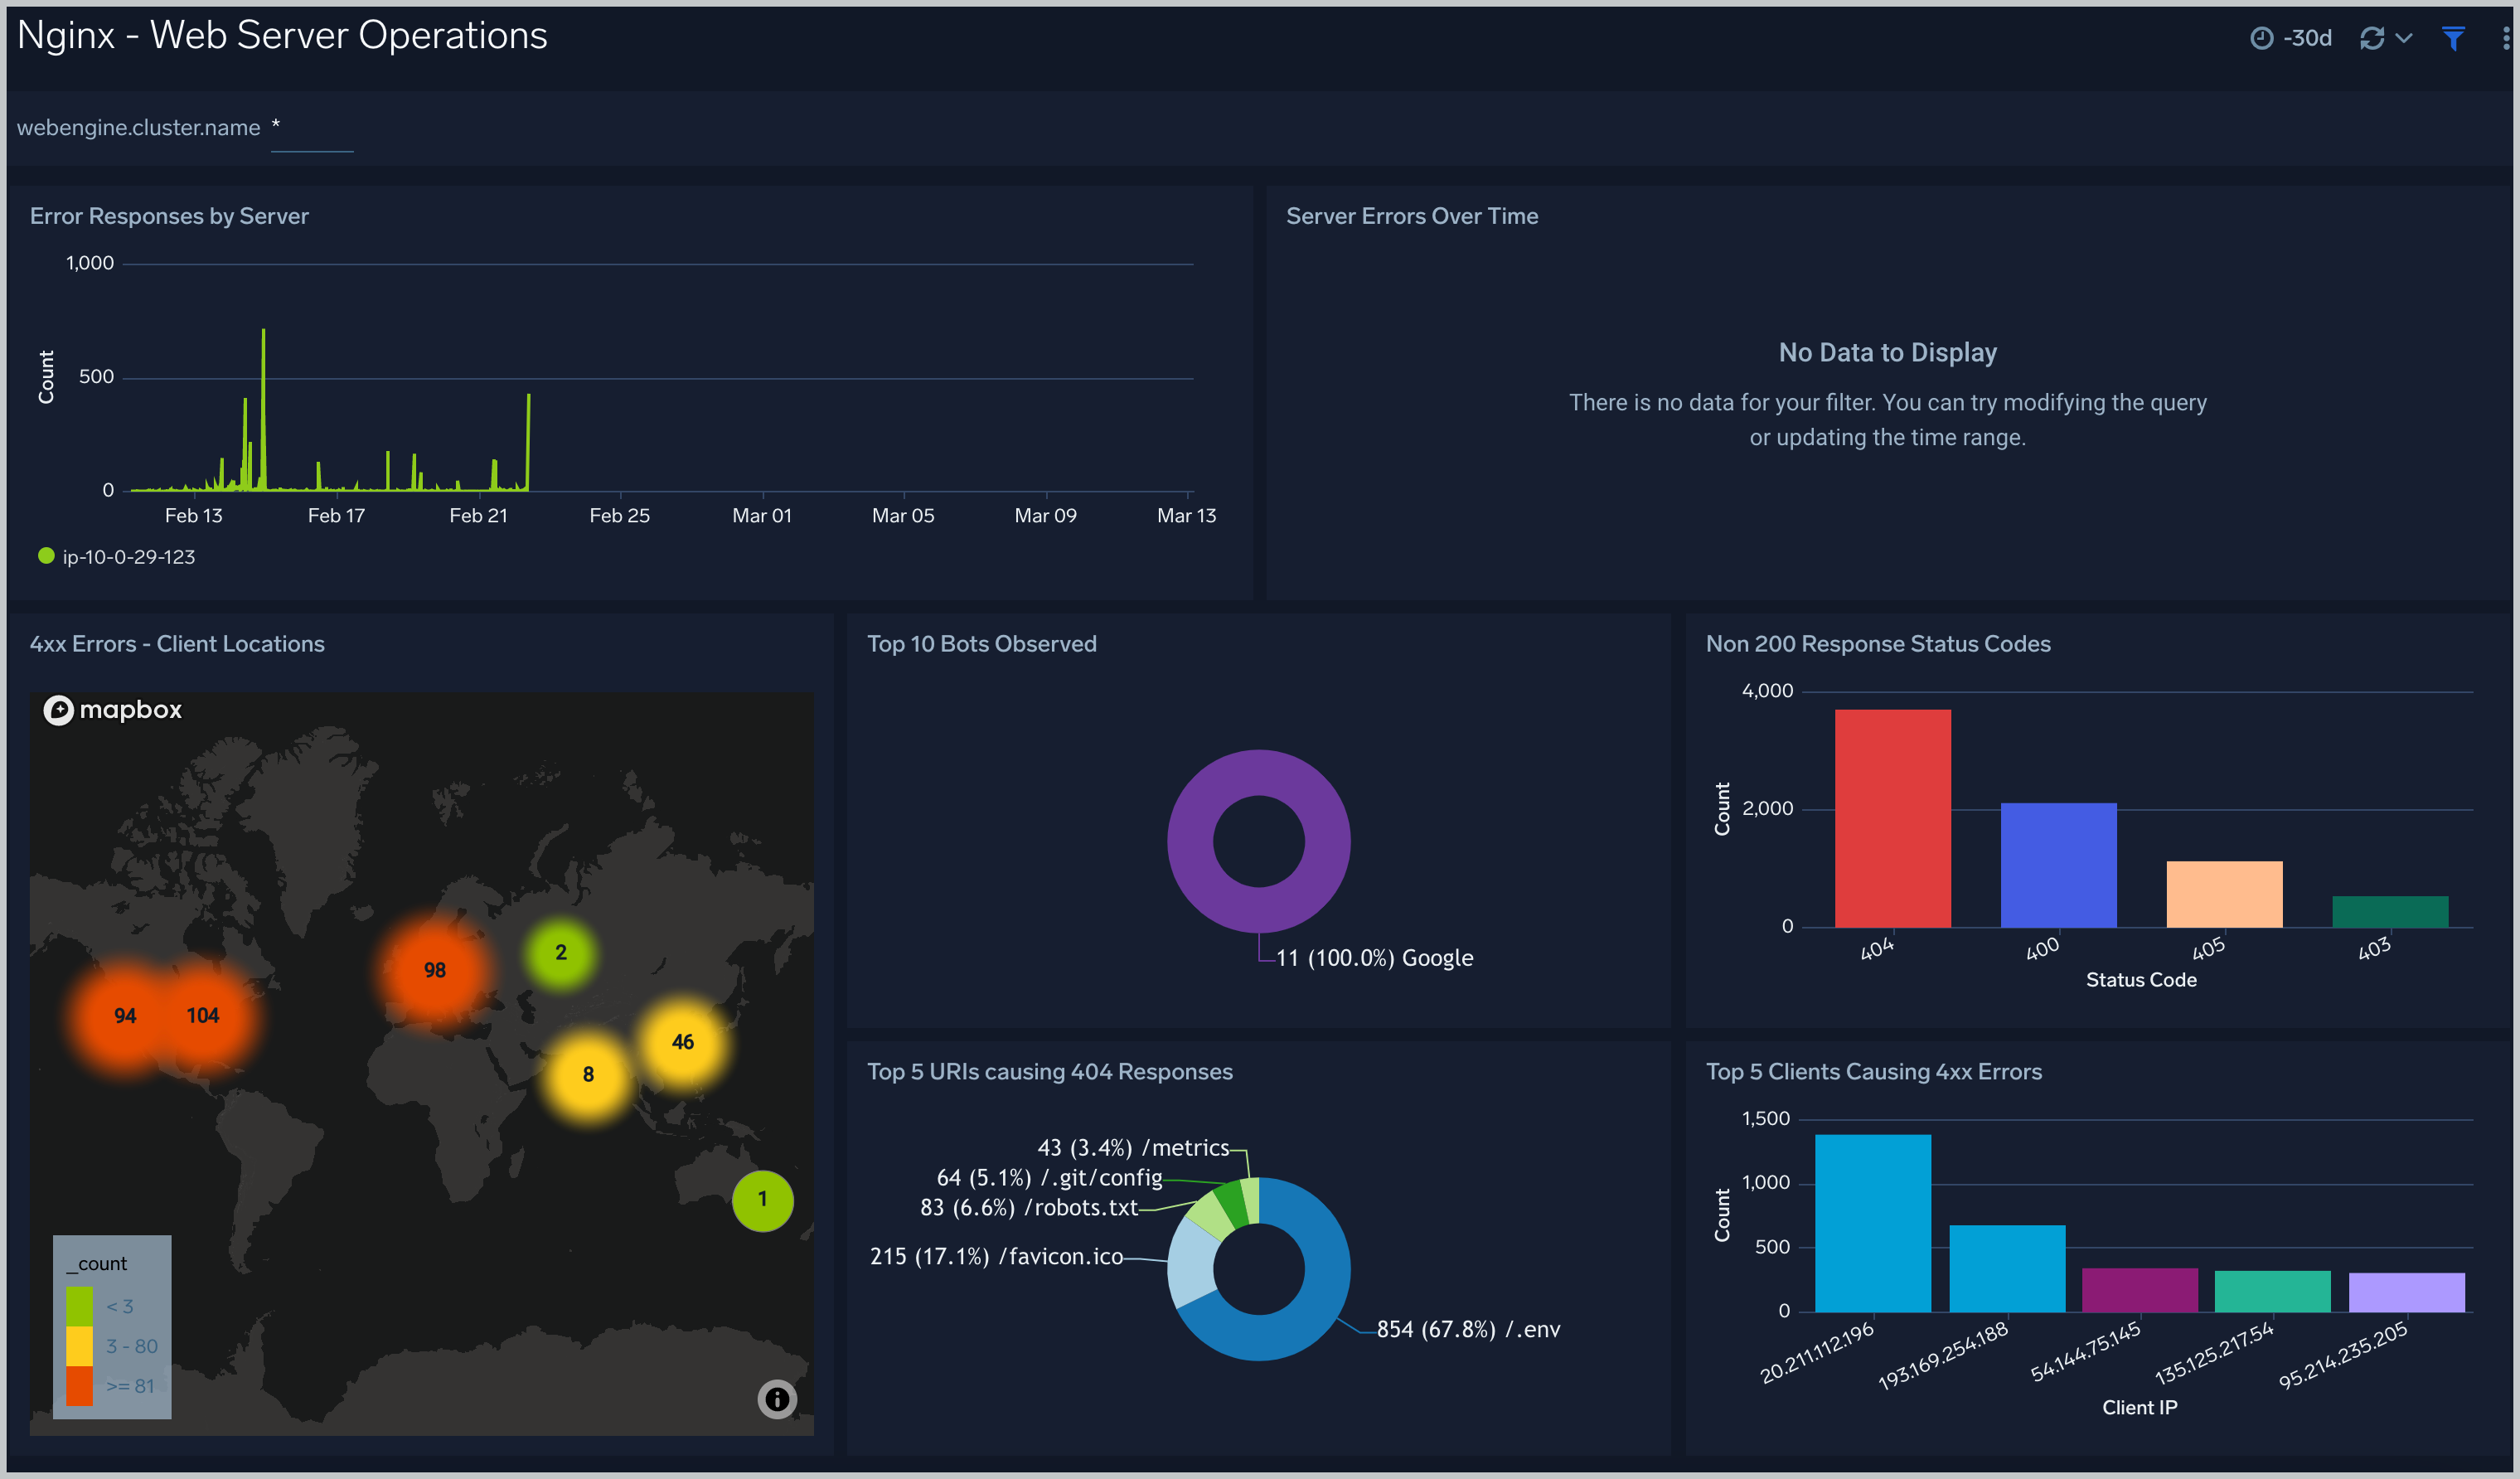
Web Server Operations
The Nginx - Web Server Operations dashboard provides a high-level view combined with detailed information on the top ten bots, geographic locations, and data for clients with high error rates, server errors over time, and non 200 response code status codes. Dashboard panels also show information on server error logs, error log levels, error responses by a server, and the top URIs responsible for 404 responses.
Use this dashboard to:
- Gain insights into Client, Server Responses on Nginx Server. This helps you identify errors in Nginx Server.
- Identify geo-locations of all Client errors. This helps you identify client location causing errors and helps you to block client IPs.
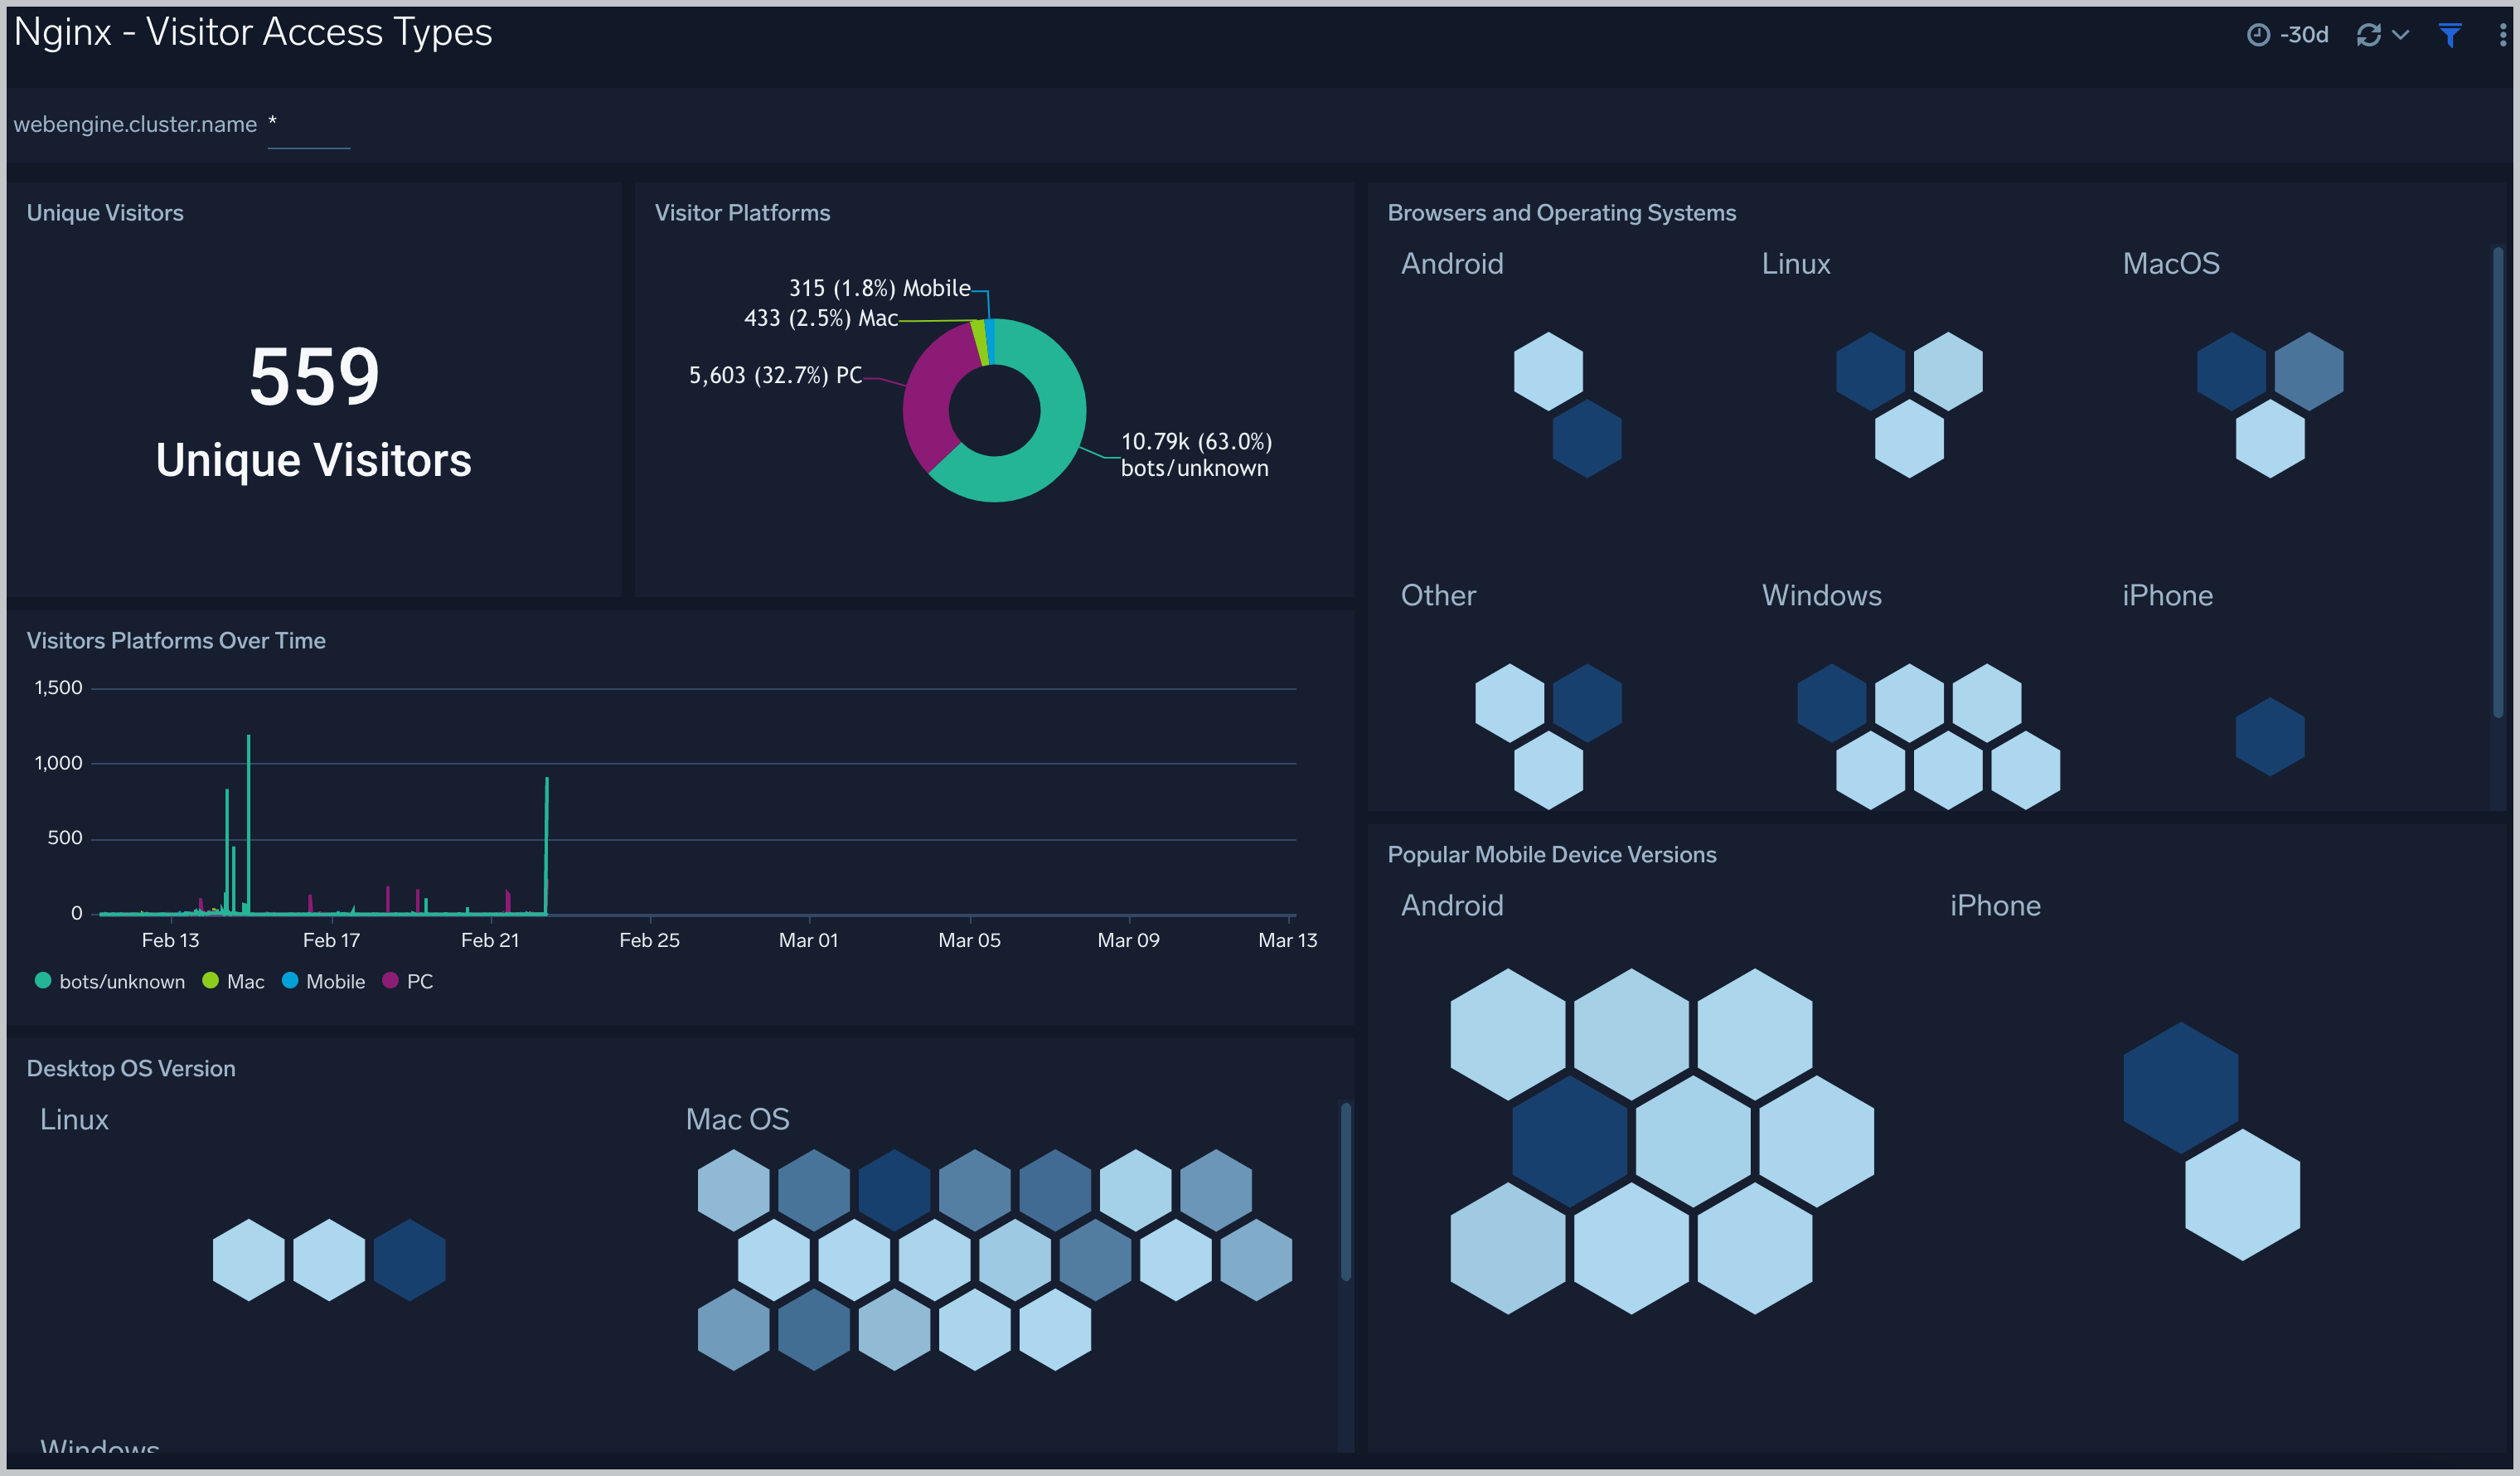
Visitor Access Types
The Nginx - Visitor Access Types dashboard provides insights into visitor platform types, browsers, and operating systems, as well as the most popular mobile devices, PC and Mac versions used.
Use this dashboard to:
- Understand which platform and browsers are used to gain access to your infrastructure.
- These insights can be useful for planning in which browsers, platforms, and operating systems (OS) should be supported by different software services.
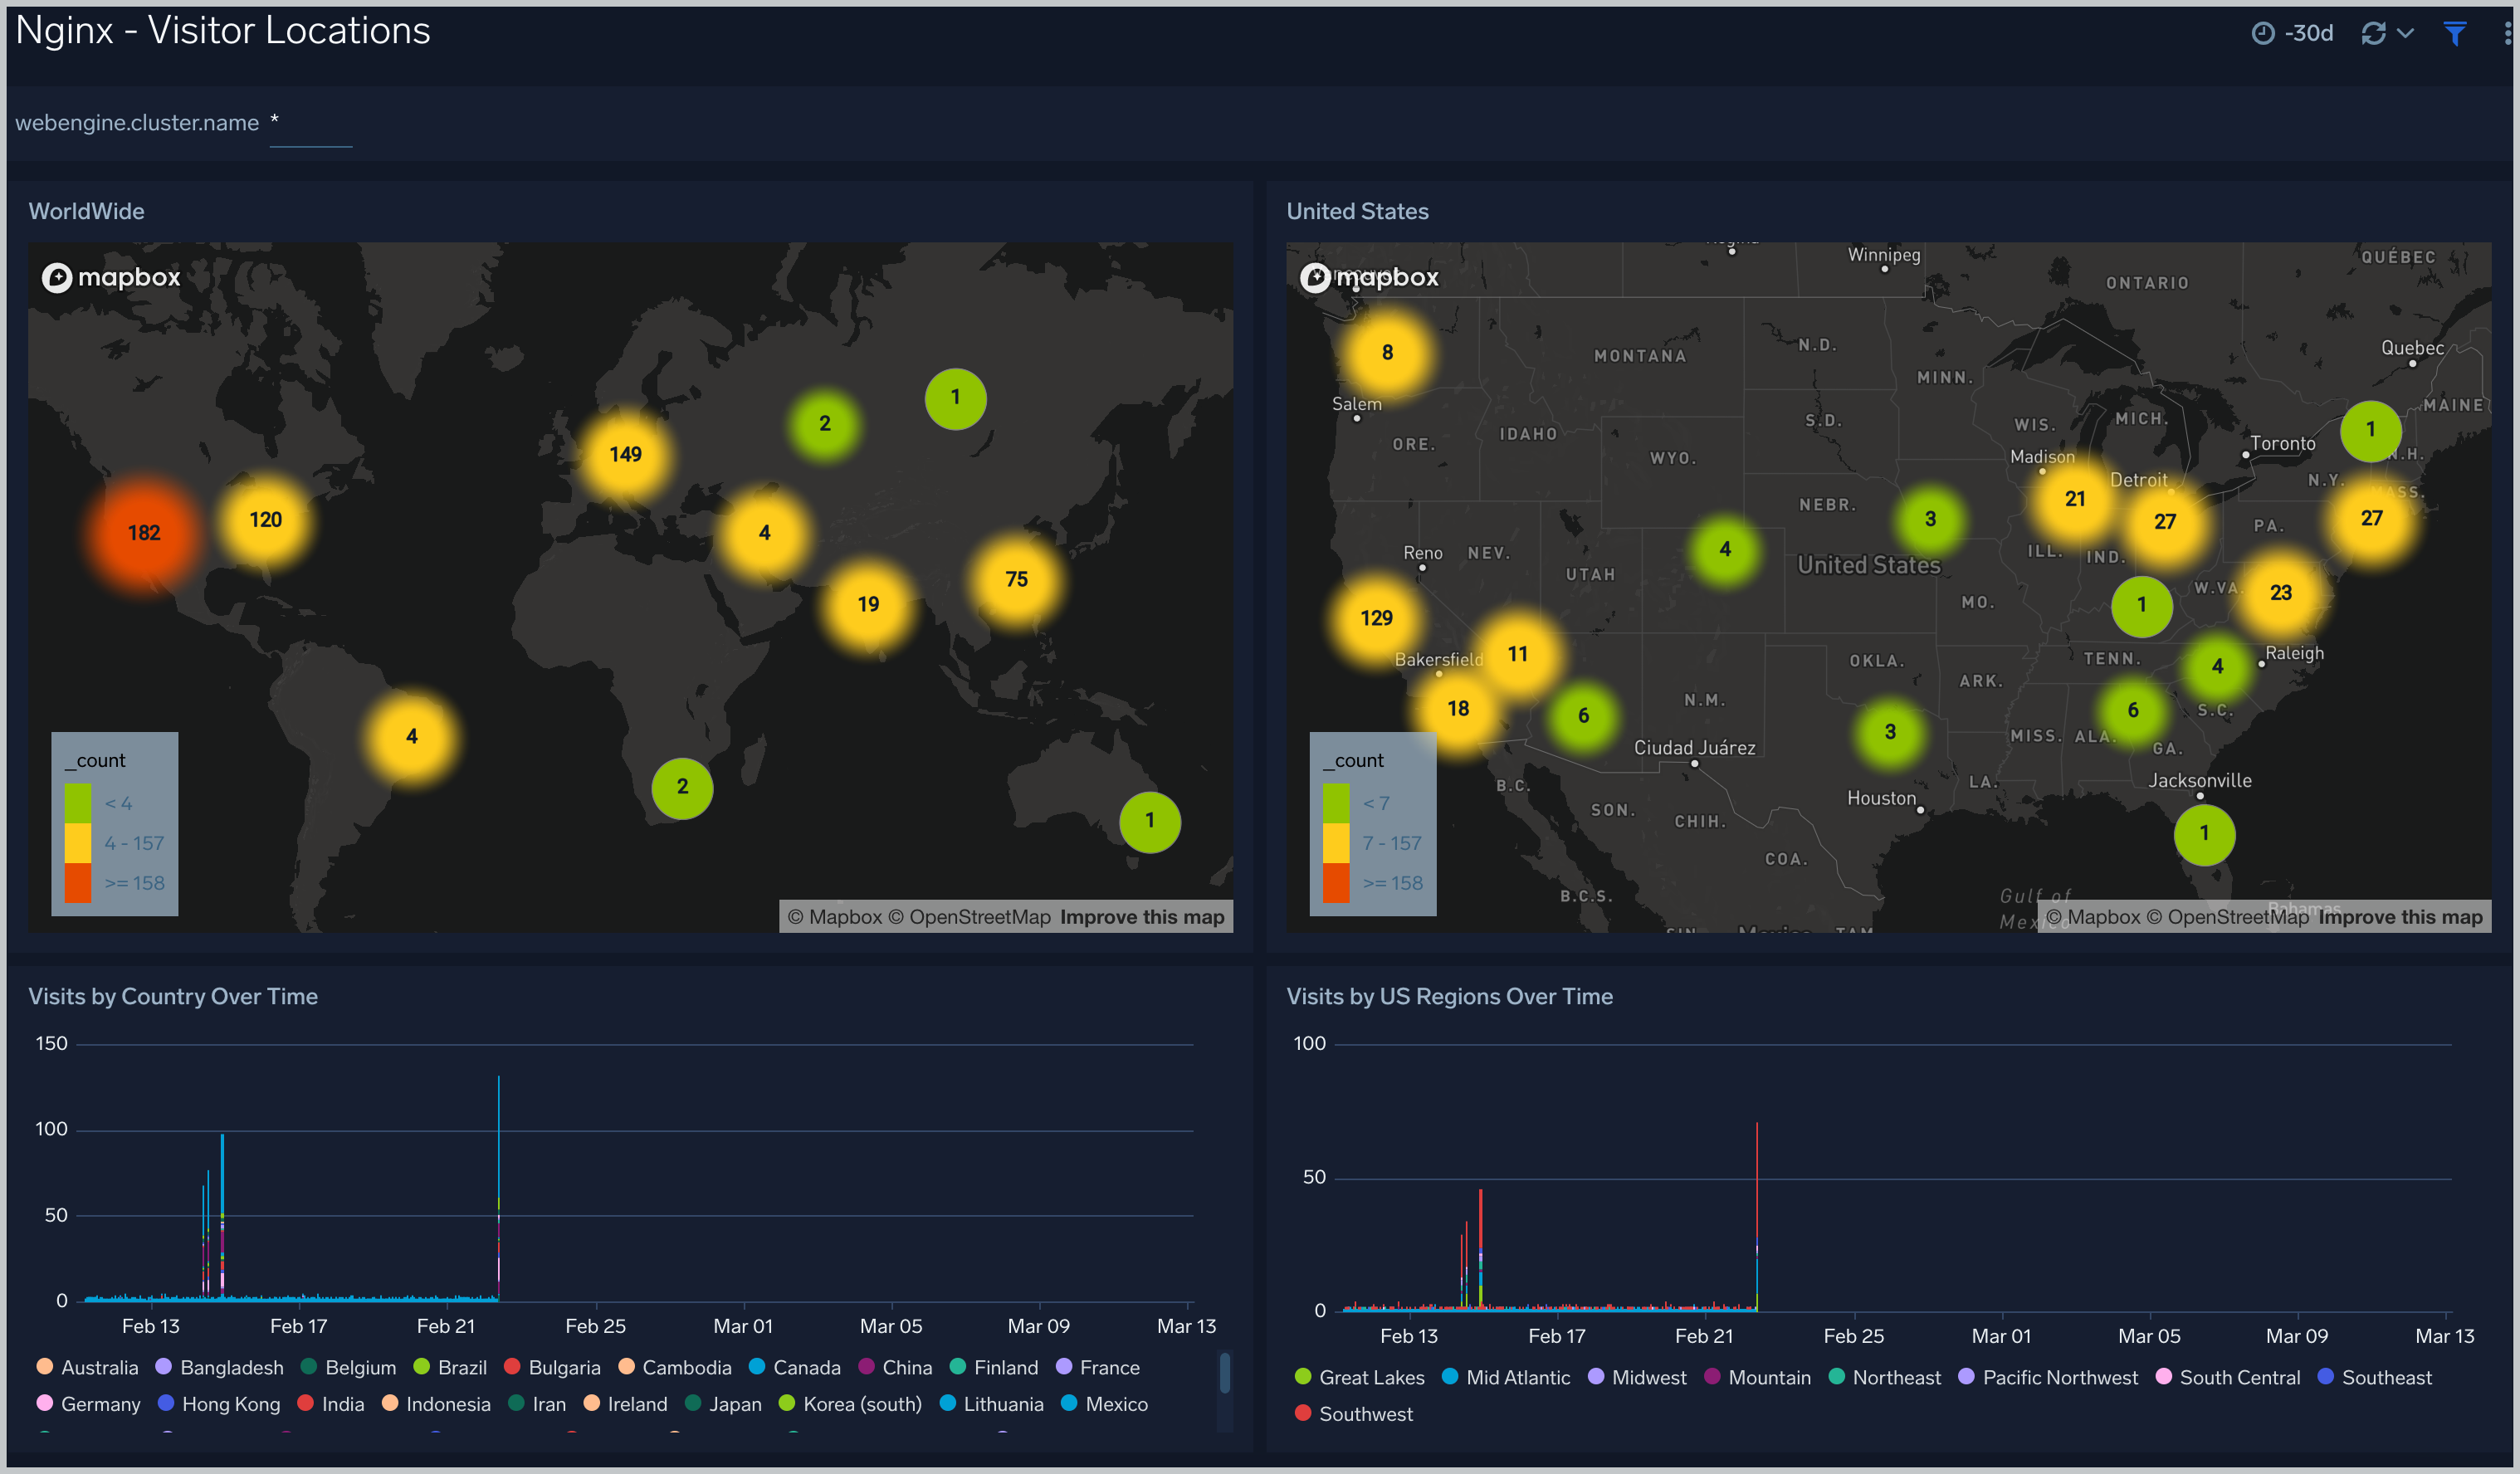
Visitor Locations
The Nginx - Visitor Locations dashboard provides a high-level view of Nginx visitor geographic locations both worldwide and in the United States. Dashboard panels also show graphic trends for visits by country over time and visits by US region over time.
Use this dashboard to:
- Gain insights into geographic locations of your user base. This is useful for resource planning in different regions across the globe.
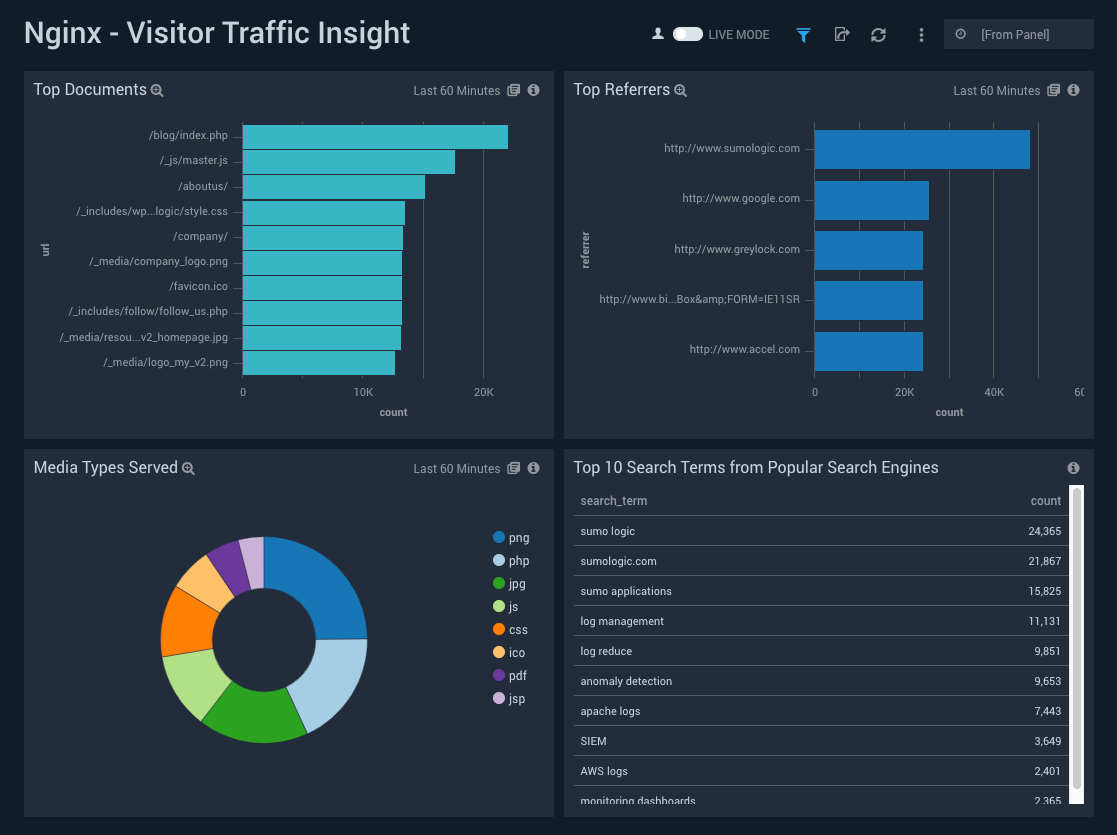
Visitor Traffic Insight
The Nginx - Visitor Traffic Insight dashboard provides detailed information on the top documents accessed, top referrers, top search terms from popular search engines, and the media types served.
Use this dashboard to:
- Understand the type of content that is frequently requested by users.
- It helps in allocating IT resources according to the content types.
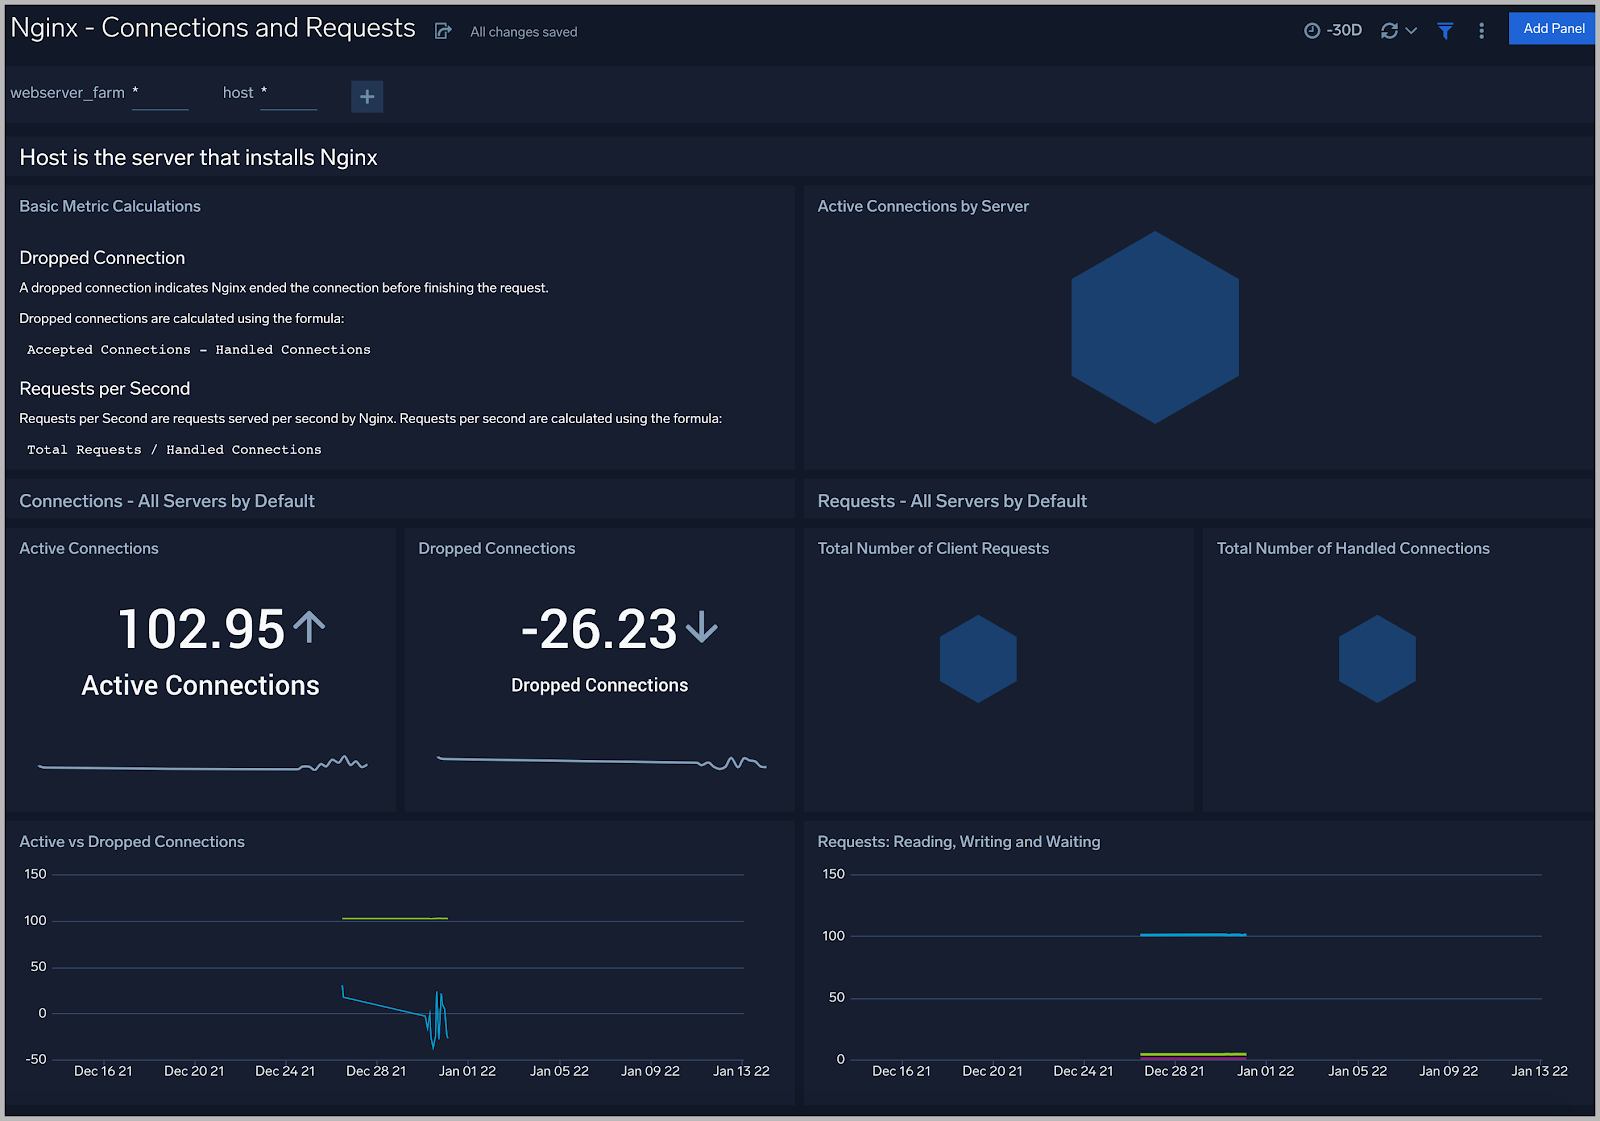
Connections and Requests Metrics
The Nginx - Connections and Requests Metrics dashboard provides insight into active, dropped connections, reading, writing, and waiting requests.
Use this dashboard to:
- Gain information about active and dropped connections. This helps you identify the connection rejected by Nginx Server.
- Gain information about the total requests handled by Nginx Server per second. This helps you understand read, write requests on Nginx Server.