Azure Kubernetes Service Control Plane
The Sumo Logic app for Azure Kubernetes Service (AKS) - Control Plane provides visibility into the AKS control plane with operational insights into the API server, scheduler, control manager, and worker nodes. The app's preconfigured dashboards display resource-related metrics for Kubernetes deployments, clusters, namespaces, pods, containers, and daemonsets.
Azure Kubernetes Service (AKS) is a Kubernetes environment with clusters managed by Azure. AKS simplifies deploying and managing container-based applications, while automatically provisioning, upgrading, and scaling resources as needed.
Supported versions
The following are the minimum supported requirements for this application:
| Name | Supported versions |
| Kubernetes | 1.10 and later |
| AKS | 1.12.8 |
Log types
The AKS - Control Plane app collects logs for the following Azure Kubernetes Services:
- kube-apiserver - The API server exposes the underlying Kubernetes APIs. This component provides the interaction for management tools, such as kubectl or the Kubernetes dashboard.
- kube-scheduler - The Scheduler determines what nodes can run the workload when you create or scale applications and then starts them.
- kube-controller-manager - The Controller Manager oversees a number of smaller controllers that perform actions, such as replicating pods and handling node operations.
Sample log messages
{
  "operationName":"Microsoft.ContainerService/managedClusters/diagnosticLogs/Read",
  "category":"kube-apiserver",
  "resourceId":"/SUBSCRIPTIONS/C111111-DXXX-4XXX-AXXX-900000000/RESOURCEGROUPS/AG-AKS-RG/PROVIDERS/MICROSOFT.CONTAINERSERVICE/MANAGEDCLUSTERS/AG-AKS-CLUSTER",
  "properties":
  {
    "log":"I0624 20:14:59.855669       1 wrap.go:47] PUT /api/v1/namespaces/kube-system/endpoints/kube-scheduler?timeout=10s:(9.05251ms) 200 [hyperkube/v1.12.8 (linux/amd64) kubernetes/a89f8c1/leader-election 172.31.1.1:48110]",
    "stream":"stderr",
    "pod":"kube-apiserver-796bd9b775-xqk5s",
    "containerID":"2d6cac1300da3226323fd1b936fe8278b87cba2b7a1bbd9c8401da6f8e786f5e"
  },
  "time":"2019-06-24T20:14:59.000Z"
}
{
"operationName":"Microsoft.ContainerService/managedClusters/diagnosticLogs/Read",
"category":"kube-controller-manager",
"resourceId":"/SUBSCRIPTIONS/C111111-DXXX-4XXX-AXXX-900000000/RESOURCEGROUPS/AG-AKS-RG/PROVIDERS/MICROSOFT.CONTAINERSERVICE/MANAGEDCLUSTERS/AG-AKS-CLUSTER",
"properties":
{
  "log":"I0624 07:27:25.9763861 event.go:221] Event(v1.ObjectReference{Kind:\"DaemonSet\",Namespace:\"kube-system\", Name:\"kube-proxy\", UID:\"2dfb3905-7dac-11e9-b60d-0a58ac1f01f6\",APIVersion:\"apps/v1\", ResourceVersion:\"4150266\", FieldPath:\"\"}): type: 'Normal'reason: 'SuccessfulCreate' Created pod: kube-proxy-xhmv7",
  "stream":"stderr",
  "pod":"kube-controller-manager-59fd65c5bd-694kh",
  "containerID":"667b540db41b66e914ca2ed496e0bef6d4a0b73fc832f5d5eba958d8a56a5e93"
},
"time":"2019-06-24T07:27:25.000Z"
}
{
"operationName":"Microsoft.ContainerService/managedClusters/diagnosticLogs/Read",
"category":"kube-scheduler",
"resourceId":"/SUBSCRIPTIONS/C111111-DXXX-4XXX-AXXX-900000000/RESOURCEGROUPS/AG-AKS-RG/PROVIDERS/MICROSOFT.CONTAINERSERVICE/MANAGEDCLUSTERS/AG-AKS-CLUSTER",
"properties":
{
  "log":"W0622 22:50:25.377565       1 reflector.go:256] k8s.io/client-go/informers/factory.go:131:watch of *v1.StorageClass ended with: too old resource version: 3828720 (3970094)",
  "stream":"stderr",
  "pod":"kube-scheduler-744886667c-cxnvk",
  "containerID":"6093b28d82e1f850fb5a9f59ed8c31aa7179e8a3907449dcd2450a6605341a60"
},
"time":"2019-06-22T22:50:25.000Z"
}
Sample queries
_sourceCategory="azure/aks" "kube-apiserver"
| json "properties.log", "category", "time", "properties.pod", "resourceId" as log, category, time, pod, resourceId
| where category ="kube-apiserver"
| parse regex field=log "(?<severity>W|I|F|E)(?<tt>[\S]+) (?<times>[\d:.]+)[\s]+(?<log_msg>.*)"
| parse regex field=resourceId "RESOURCEGROUPS\/(?<resource_grp>[\S]+)\/PROVIDERS\/MICROSOFT\.CONTAINERSERVICE\/MANAGEDCLUSTERS\/(?<cluster>[\S]+)"
| timeslice 1h
| count by _timeslice, severity
| transpose row _timeslice column severity
| fillmissing timeslice(1h)
_sourceCategory="azure/aks" ("kube-controller-manager")
| json "properties.log", "category", "time", "properties.pod", "resourceId" as log, category, time, pod, resourceId
| where category ="kube-controller-manager"
| parse regex field=log "(?<severity>W|I|F|E)(?<tt>[\S]+) (?<times>[\d:.]+)[\s]+(?<log_msg>.*)"
| parse regex field=resourceId "RESOURCEGROUPS\/(?<resource_grp>[\S]+)\/PROVIDERS\/MICROSOFT\.CONTAINERSERVICE\/MANAGEDCLUSTERS\/(?<cluster>[\S]+)"
| timeslice 1h
| count by _timeslice, severity
| transpose row _timeslice column severity
| fillmissing timeslice(1h)
_sourceCategory="azure/aks" "kube-scheduler"
| json "properties.log", "category", "time", "properties.pod", "resourceId" as log, category, time, pod, resourceId
| where category ="kube-scheduler"
| parse regex field=log "(?<severity>W|I|F|E)(?<tt>[\S]+) (?<times>[\d:.]+)[\s]+(?<log_msg>.*)"
| parse regex field=resourceId "RESOURCEGROUPS\/(?<resource_grp>[\S]+)\/PROVIDERS\/MICROSOFT\.CONTAINERSERVICE\/MANAGEDCLUSTERS\/(?<cluster>[\S]+)"
| timeslice 1h
| count by _timeslice, severity
| transpose row _timeslice column severity
| fillmissing timeslice(1h)
Collecting logs for the Kubernetes and AKS - Control Plane
The Sumo Logic Kubernetes app works in conjunction with the AKS - Control Plane app and allows you to monitor worker node logs, as well as metrics for the Azure monitor and worker nodes.
Collecting logs and installing the Kubernetes app
The Sumo Logic Kubernetes app provides the services for managing and monitoring Kubernetes worker nodes. You must set up collection and install the Kubernetes app before configuring collection for the AKS - Control Plane app. You will configure log and metric collection during this process.
To set up collection and install the Kubernetes app, follow the instructions in this document.
Collecting logs for the AKS - Control Plane app
This section walks you through the process of configuring a pipeline to send logs from Azure Monitor to Sumo Logic.
-
To set up the logs collection in Sumo Logic, refer to Azure Event Hubs Source for Logs.
When you configure the event hubs source, plan your source category to ease the querying process. A hierarchical approach allows you to make use of wildcards. For example:
Azure/AKS/ControlPlane/Logs.Enable the Kubernetes master node logs in Azure Kubernetes Service to send logs to an event hub created in the previous step.
-
Push logs from Azure Monitor to Event Hub.
- Sign in to Azure Portal.
- Go to Kubernetes Services. Select your AKS cluster from which you want to collect logs.
- In the Monitoring Section, the Diagnostic Settings blade displays any existing settings. Click Edit Setting if you want to change your existing settings, or click Add diagnostic setting to add a new one. You can have a maximum of three settings.
- Enter a name.
- Check the Stream to an event hub box and click Event hub / Configure.
- Select an Azure subscription.
- Event bub namespace. If you have chosen Method 1 (Azure Event Hubs Source) for collecting logs, select the EventHubNamespace created manually, or else if you have chosen Method 2 (Collect logs from Azure monitor using Azure functions), then select
SumoAzureLogsNamespace<UniqueSuffix>namespace created by the ARM template. - Event hub name (optional). If you have chosen Method 1 (Azure Event Hub Source) for collecting logs, select the event hub name, which you created manually, or if you have chosen Method 2 (Collect logs from Azure monitor using Azure functions), then select insights-operational-logs.
- Select RootManageSharedAccessKey from Select event hub policy name dropdown.
- Select the checkbox for log types under Categories which you want to ingest.
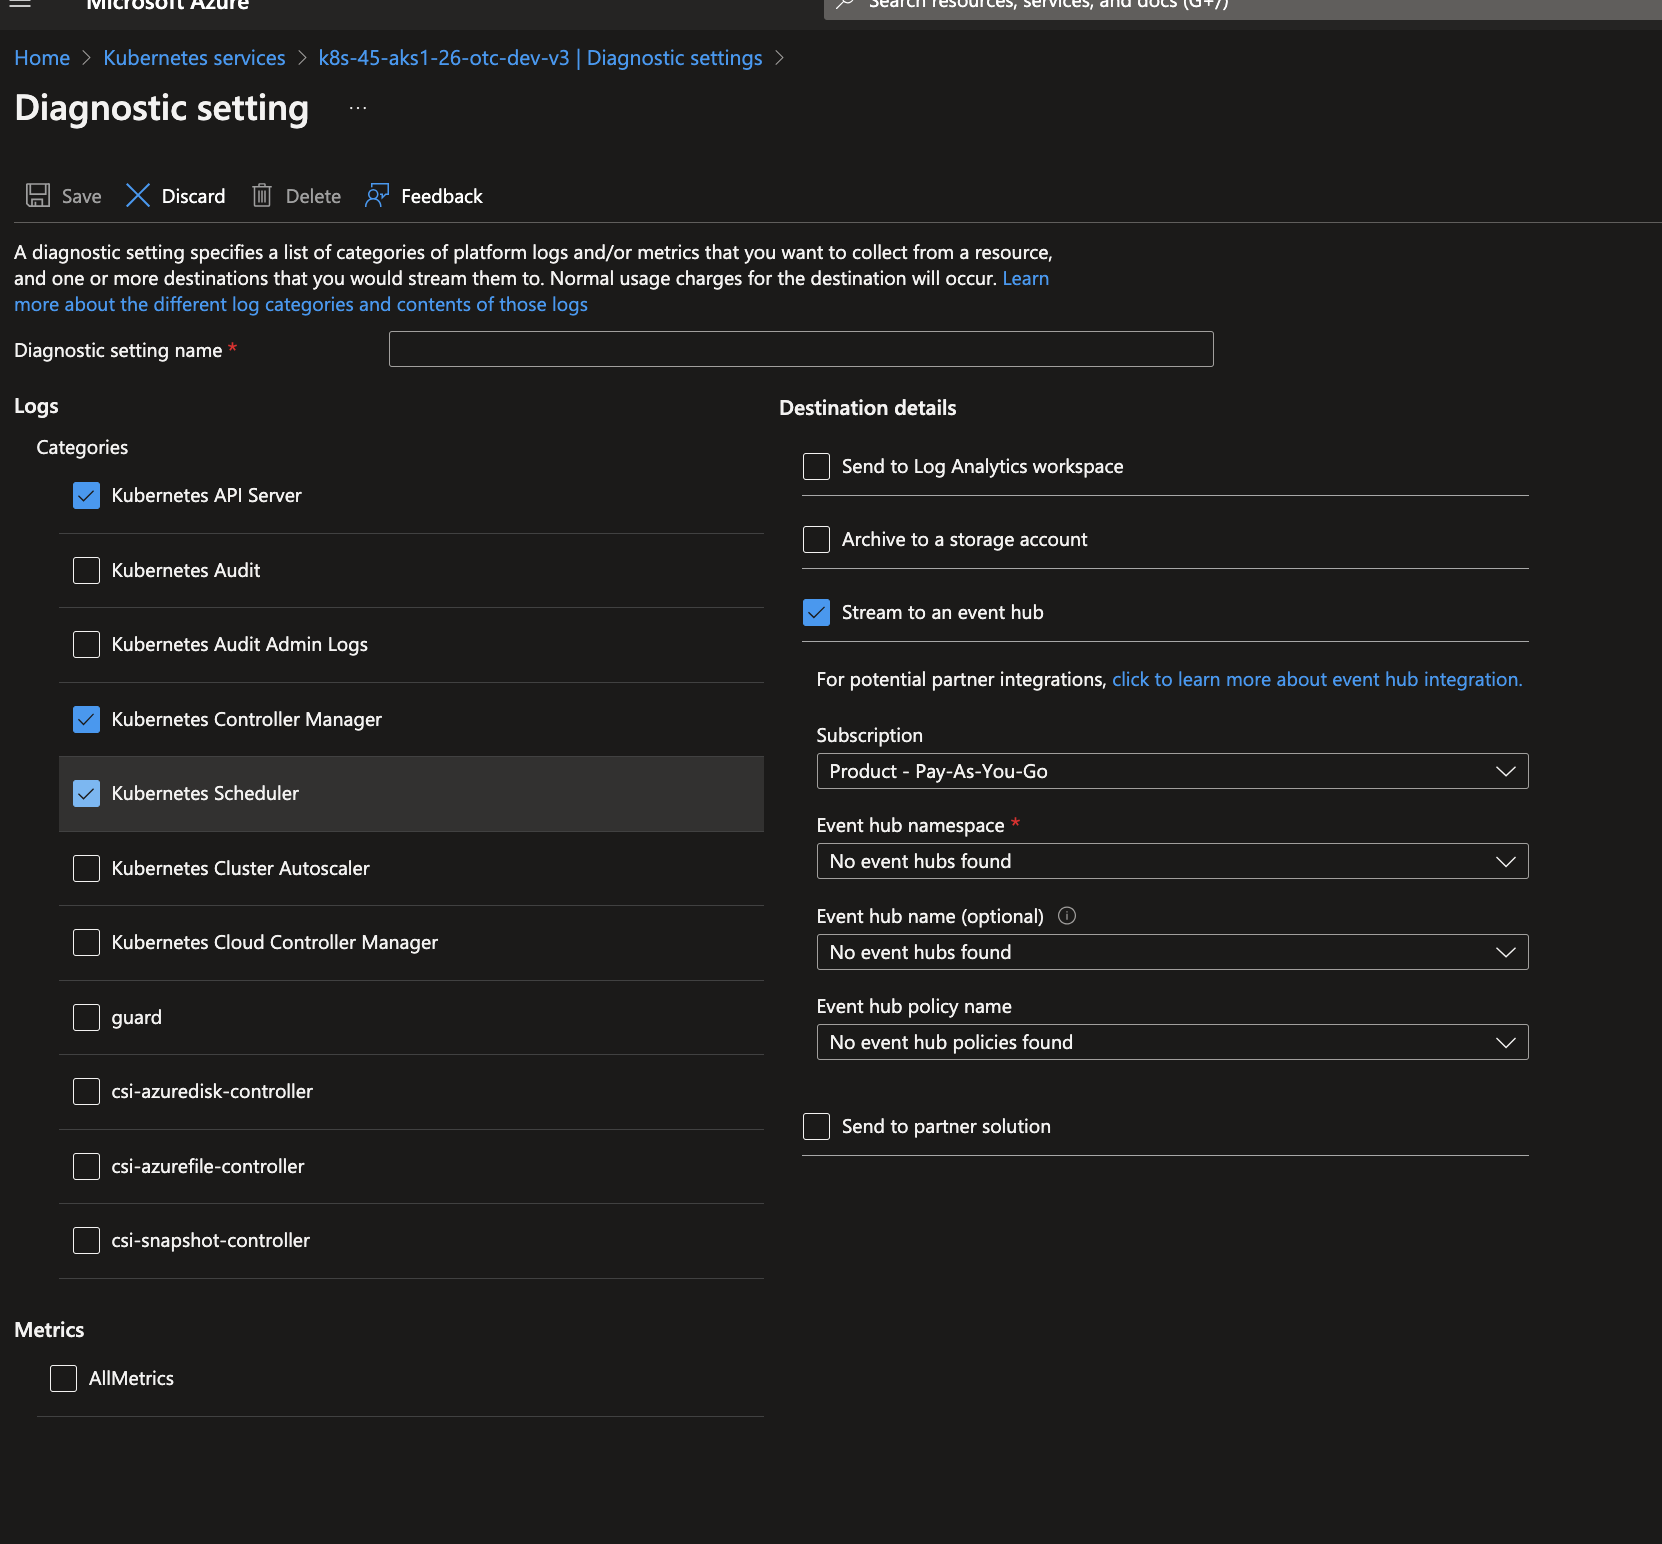
- Click Save.
Installing the AKS Control Plane app
Now that you have set up collection for AKS, you can install the Sumo Logic app for AKS and access the pre-configured Kubernetes dashboards for visibility into your AKS environment from a single-pane-of-glass.
All the dashboards are linked to the Kubernetes views so they can be easily accessed by clicking the Cluster in the navigation pane of the tab.
To install the app:
- Select App Catalog.
- In the 🔎 Search Apps field, run a search for your desired app, then select it.
- Click Install App.
note
Sometimes this button says Add Integration.
- On the next configuration page, under Select Data Source for your App, complete the following fields:
- Data Source. Select one of the following options:
- Choose Source Category and select a source category from the list; or
- Choose Enter a Custom Data Filter, and enter a custom source category beginning with an underscore. For example,
_sourceCategory=MyCategory.
- Folder Name. You can retain the existing name or enter a custom name of your choice for the app.
- All Folders (optional). The default location is the Personal folder in your Library. If desired, you can choose a different location and/or click New Folder to add it to a new folder.
- Data Source. Select one of the following options:
- Click Next.
- Look for the dialog confirming that your app was installed successfully.
Post-installation
Once your app is installed, it will appear in your Personal folder or the folder that you specified. From here, you can share it with other users in your organization. Dashboard panels will automatically start to fill with data matching the time range query received since you created the panel. Results won't be available immediately, but within about 20 minutes, you'll see completed graphs and maps.
Viewing the AKS Control Plane dashboards
Filter with template variables
Template variables provide dynamic dashboards that rescope data on the fly. As you apply variables to troubleshoot through your dashboard, you can view dynamic changes to the data for a fast resolution to the root cause. For more information, see the Filter with template variables page.
You can use template variables to drill down and examine the data on a granular level.
AKS Controller Manager
The AKS Controller Manager dashboard provides a high-level view of severity types and trends, along with details on scale operations, pod creation and deletion, and recent error messages.
Use this dashboard to:
- Find pod and scale operations performed by controller manager.
- Find the severity of various controller manager events and analyze fatal and erroneous controller manager operation events.
/AKS_Controller_Manager.png)
AKS API Server
The AKS API Server dashboard provides insights into API server severity events and trends, autoscaler and status code trends, top problem URLs, and a list of recent error messages.
Use this dashboard to:
- Understand the status codes of requests made to Kube API Server.
- Review the top 10 URLs with problem status codes.
- Review the severity of various Kube API Server events, and analyze any fatal or erroneous events of Kube API Server operations.
- Find spikes or abnormal activity in the status codes of auto-scaler operations.
/AKS_API_Server.png)
AKS Scheduler
The AKS Scheduler dashboard provides a high-level view of severity types and trends for the Kube scheduler, as well as a detailed list of error messages.
Use this dashboard to:
- Find the severity of various Kube scheduler events.
- Analyze fatal or erroneous events of Kube scheduler operations.
/AKS_Scheduler.png)