timeslice Search Operator
The timeslice operator aggregates data by time period, so you can create bucketed results based on a fixed interval (for example, five-minute buckets). Timeslice also supports creating a fixed-target number of buckets, for example, 150 buckets over the last 60 minutes.
There are two primary use cases for this operator:
- Group data into time-sliced buckets for aggregation analysis
- Group data into time-sliced buckets for time-series visual analysis
Let’s say you log each time a user successfully logs into your service, and you want to track how many logins per hour, on a daily basis. You can use the timeslice operator to group the data into one-hour segments, and view the data over a 24 hour period.
Syntax
timeslice <#><time_period> [as <field>] | <aggregating_operator> by <field>
timeslice <#> buckets [as <field>] | <aggregating_operator> by <field>
Supported <time_period> values are weeks (w), days (d), hours (h), minutes (m), and seconds (s).
To group data by (M) month you can use the formatDate operator to format _timeslice to a month format, like this:
| timeslice 1d
| formatDate(_timeslice,"MM-01-yyyy") as month
| parseDate(month,"MM-dd-yyyy") as _timeslice
| <aggregating_operator> by _timeslice
Rules
- An alias for the timeslice field is optional. If an alias is not provided, a default
_timeslicefield is created that marks the start of the timeslice in milliseconds. - Creates a field named
__timeslice_endthat marks the end of the timeslice in milliseconds. - The timeslice operator is commonly used in conjunction with the transpose operator. After you’ve timesliced the data into buckets, the transpose operator allows you to plot aggregated data in a time series.
- The timeslice operator must be used with an aggregating operator such as count by or group by.
- The number of buckets in your query is a target or maximum, not necessarily the exact number of buckets that will be returned. For example, if your query specifies 150 buckets, Sumo Logic will find a reasonable clock-aligned resolution to return approximately 150 buckets in the query results.
- If you use timeslice with the compare or outlier operators, do not alias timeslice. They expect
_timeslice. - If no time period or bucket is specified, it defaults to the time range of the Search.
Examples
Successful logins per hour.
 _sourceCategory=exampleApplication*
| parse "login_status=*" as login_status
| where login_status="success"
| timeslice 1h
| count by _timeslice
Known Issue
There is a known issue with the timeslice operator and Daylight Savings Time (DST). When the clock moves forward, any timeslice operation that crosses the DST boundary is affected. For this reason, results may show more than one entry for that day.
For example, in Australia, DST goes into effect on October 2nd for Spring. For that day, with a 1d timeslice, you would see two entries for the same day: one for 12 a.m. and another for 11 p.m.
In another example, if you had a 4h timeslice, you would usually see results at 12 a.m., 4 a.m., 8 a.m., 12 p.m., etc. But when the DST happens, the result after 12 a.m. could be either 3 a.m. or 5 a.m., depending on Fall or Spring.
How does a timeslice affect a monitor?
Monitor query output is matched with the configured threshold during its evaluation. If it matches, the alert triggers. If there are multiple rows in the search query output because of timeslice or any other reason (such as a group by operator), it would match each row with the monitor threshold and if it matches for any row, it would trigger the alert.
So if the query is _sourceCategory=abc | timeslice 1m | count by _timeslice, the timeRange is 15m, and there are 15 rows in the query output, it would trigger the alert if _count for any row matches the threshold and resolve when none of the rows match the alert threshold (and all match resolution threshold).
Basic examples
timeslice 5m
Fixed-size buckets at 5 minutes. The output field is the default _timeslice.
timeslice 2h as 2hrs
Fixed-size buckets that are 2 hours long. The output field name is aliased to 2hrs.
timeslice 150 buckets
Bucketing to 150 buckets over the search results.
timeslice 1m as my_time_bucket_field_name
Fixed-size buckets of 1 minute each. The output field name is aliased to my_time_bucket_field_name.
Example in queries
This outputs a table in the Aggregates tab with columns _count and _timeslice with the timeslices spaced in 5 minute intervals:
* | timeslice 5m | count by _timeslice
This outputs three columns: _count, _sourceCategory, and my_field_name_alias:
* | timeslice 5m as my_field_name_alias | count by _sourceCategory, my_field_name_alias
This outputs a table in the Aggregates tab with columns _count, _sourceCategory, and _timeslice with 10 rows for each _sourceCategory in that table if you have messages covering the entire search period:
* | timeslice 10 buckets | count by _sourceCategory, _timeslice
Additional Examples
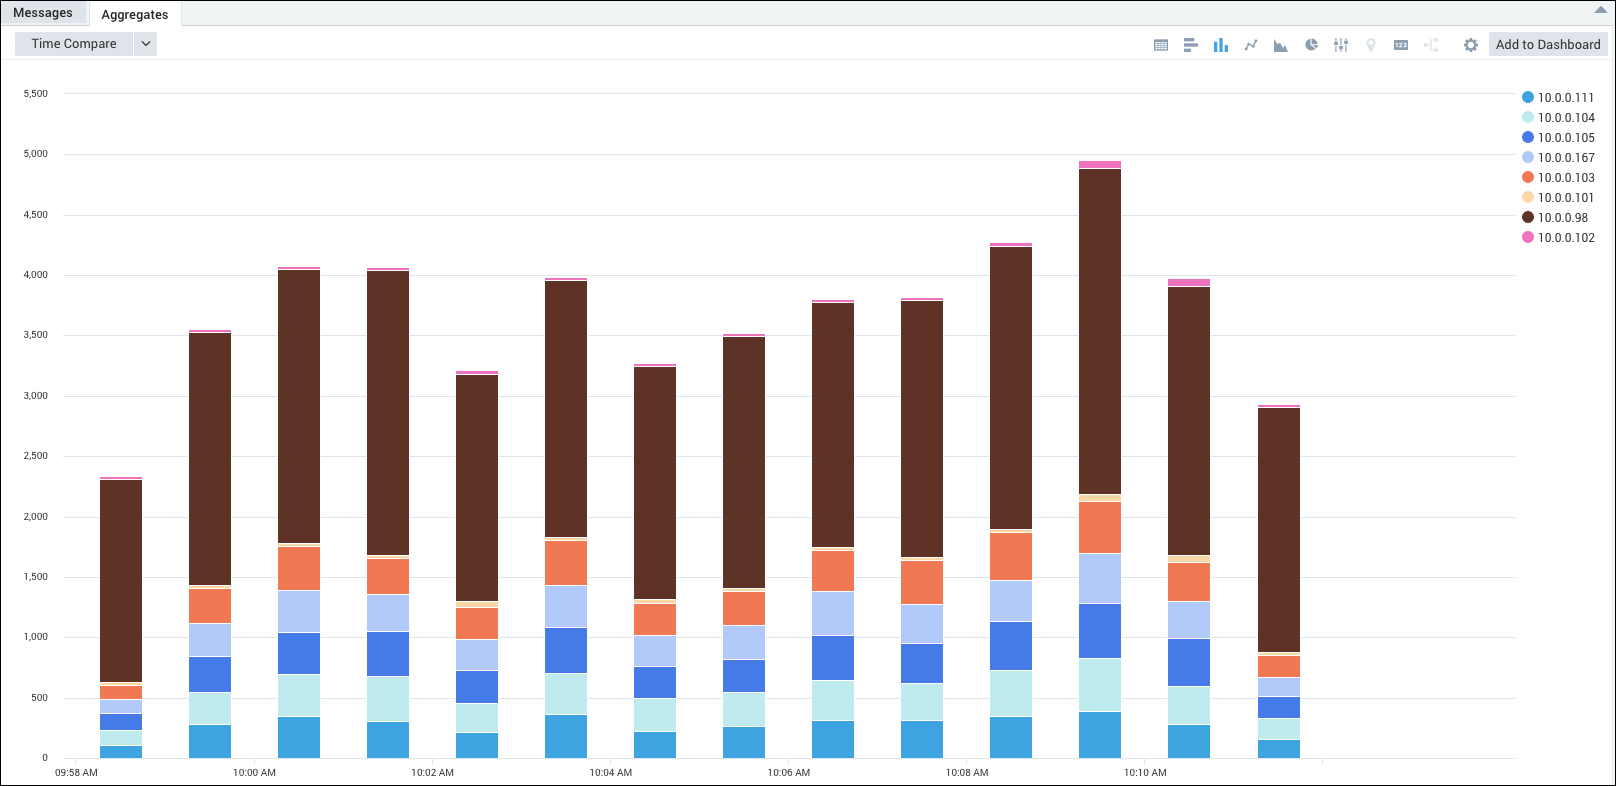
Example 1: Checking the server distribution over time to make sure the load balancer is working properly.
_sourceCategory=Apache/Access
| timeslice 1h
| parse regex "(?<ip_address>\d{1,3}\.\d{1,3}\.\d{1,3}\.\d{1,3})"
| count _timeslice, ip_address
| transpose row _timeslice column ip_address
This query produces these results in the Aggregates tab, which you can display as a column chart.
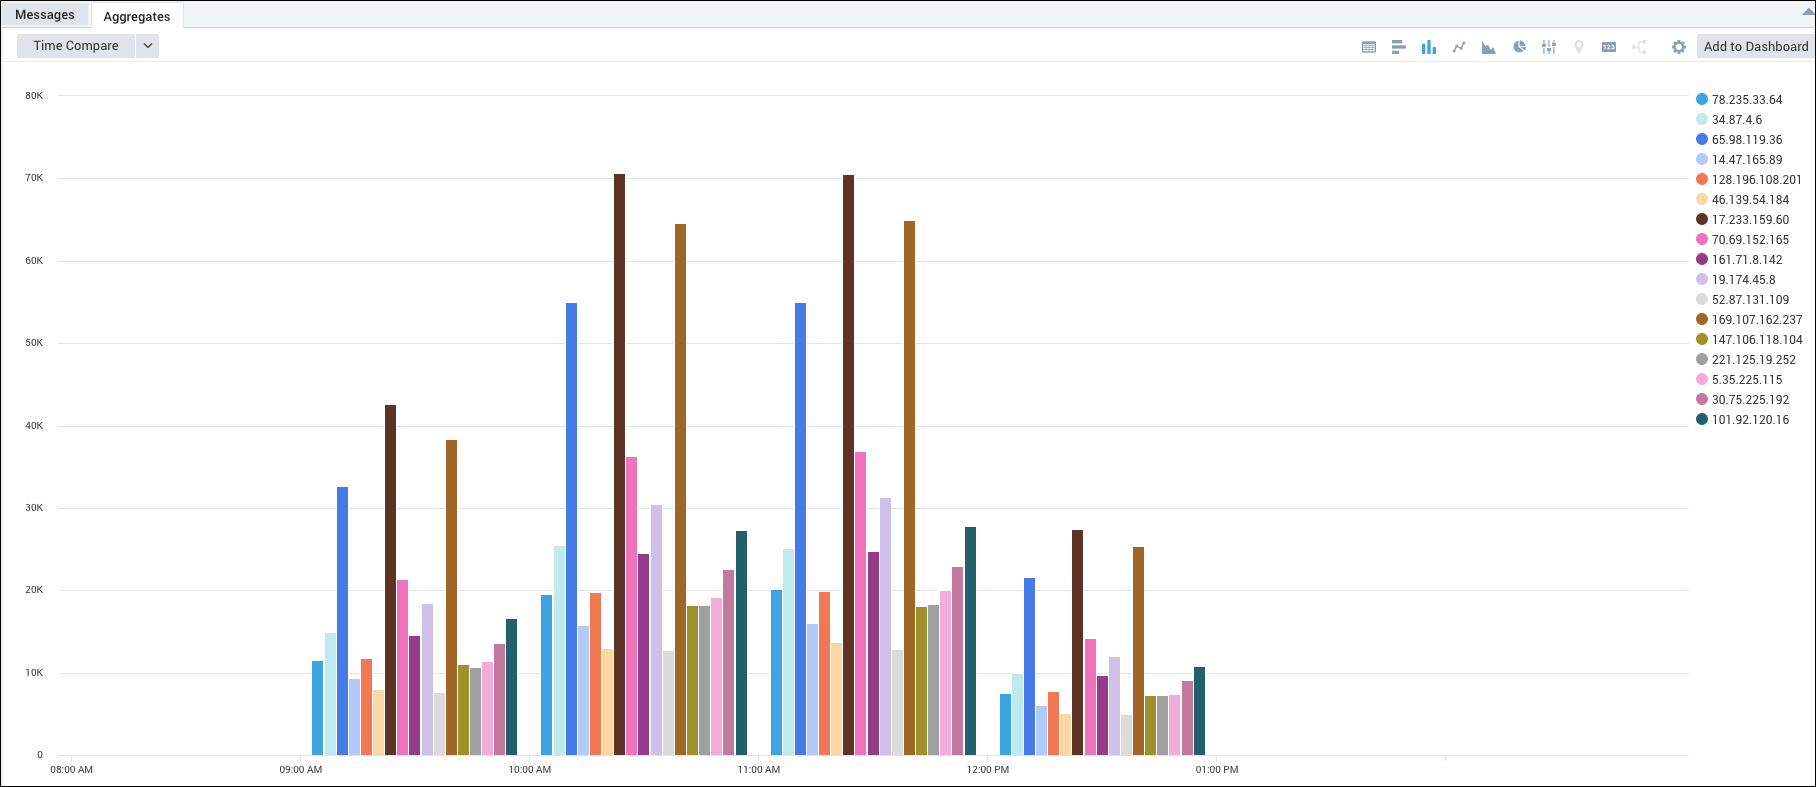
Example 2: All computer access to Sumo Logic over time.
_sourceCategory=*IIS*
| parse "* * * * * * * * " as date, time, csmethod, cs_uri_stem, cs_uri_query, s_port, s_ip, cs_useragent
| timeslice 1m
| count by _timeslice, s_ip
| transpose row _timeslice column s_ip
This query produces these results in the Aggregates tab, which you can display as a stacked column chart:
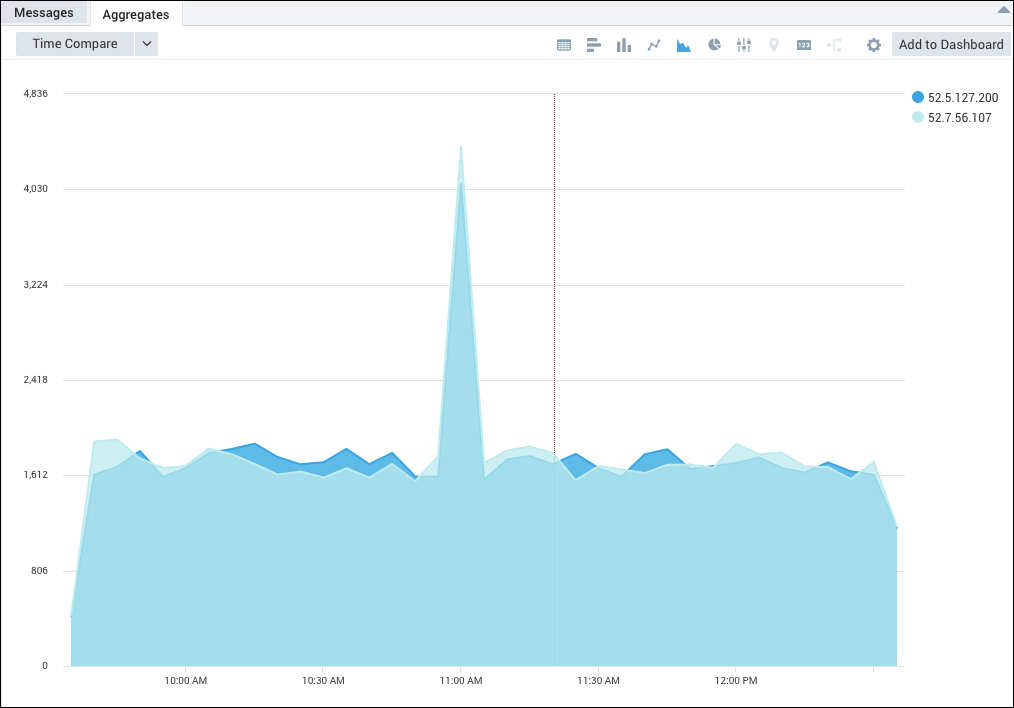
Example 3: Monitoring non-normal status codes (400s and 500s) on Apache servers.
_sourceCategory=Apache/Access
| parse "HTTP/1.1\" * " as status_code
| where status_code >= 400
| timeslice 5m
| count as count by _timeslice,_sourceHost
| transpose row _timeslice column _sourceHost
This query produces these results in the Aggregates tab, which you can display as an area chart: