AWS EC2 Host Metrics
Amazon Elastic Compute Cloud (Amazon EC2) is a web service that provides secure, resizable compute capacity in the cloud, enabling you to complete control of your computing resources. The Sumo Logic app for AWS EC2 (Host metrics) collects local host metrics and displays them using predefined search queries and dashboards. app dashboards provide a visual analysis of local host metrics for CPU, disk, memory, network, and TCP.
Metrics types
Host metrics are gathered by the open-source SIGAR library. The metrics that are collected are described in Host Metrics for Installed Collectors.
Time intervals
The time interval determines how frequently the source is scanned for metrics data. Sumo Logic supports pre-specified time intervals (10 seconds, 15 seconds, 30 seconds, 1 minute, and 5 minutes).
You can also specify a time interval in JSON by using the interval parameter, as follows: "interval" : 60000.
The JSON parameter is in milliseconds. We recommend 60 seconds (60000 ms) or longer granularity. Specifying a shorter interval will increase the message volume and could cause your deployment to incur additional charges.
AWS metadata
Collectors running on Host Metrics (EC2) instances can optionally collect AWS Metadata such as EC2 tags to make it easier to search for Host Metrics. Only one AWS Metadata Source for Metrics is required to collect EC2 tags from multiple hosts. For more information, see AWS Metadata Source for Metrics.
Sample queries
metric=CPU_Sys _sourceCategory=Labs/AWS/Host/Metrics _sourceHost=* _collector=* _source = * account=* region=* instancetype=* namespace=hostmetrics instanceid=* | avg
Viewing AWS EC2 Host Metrics dashboards
We highly recommend you view these dashboards in the AWS Observability view of the AWS Observability solution.
All dashboards have a set of filters that you can apply to the entire dashboard. Use these filters to drill down and examine the data to a granular level.
- You can change the time range for a dashboard or panel by selecting a predefined interval from a drop-down list, choosing a recently used time range, or specifying custom dates and times. Learn more.
- If required, configure the refresh interval rate for a dashboard or panel by clicking the drop-down arrow next to the refresh icon.
- Click the funnel icon in the dashboard top menu bar to filter dashboard with Template Variables.

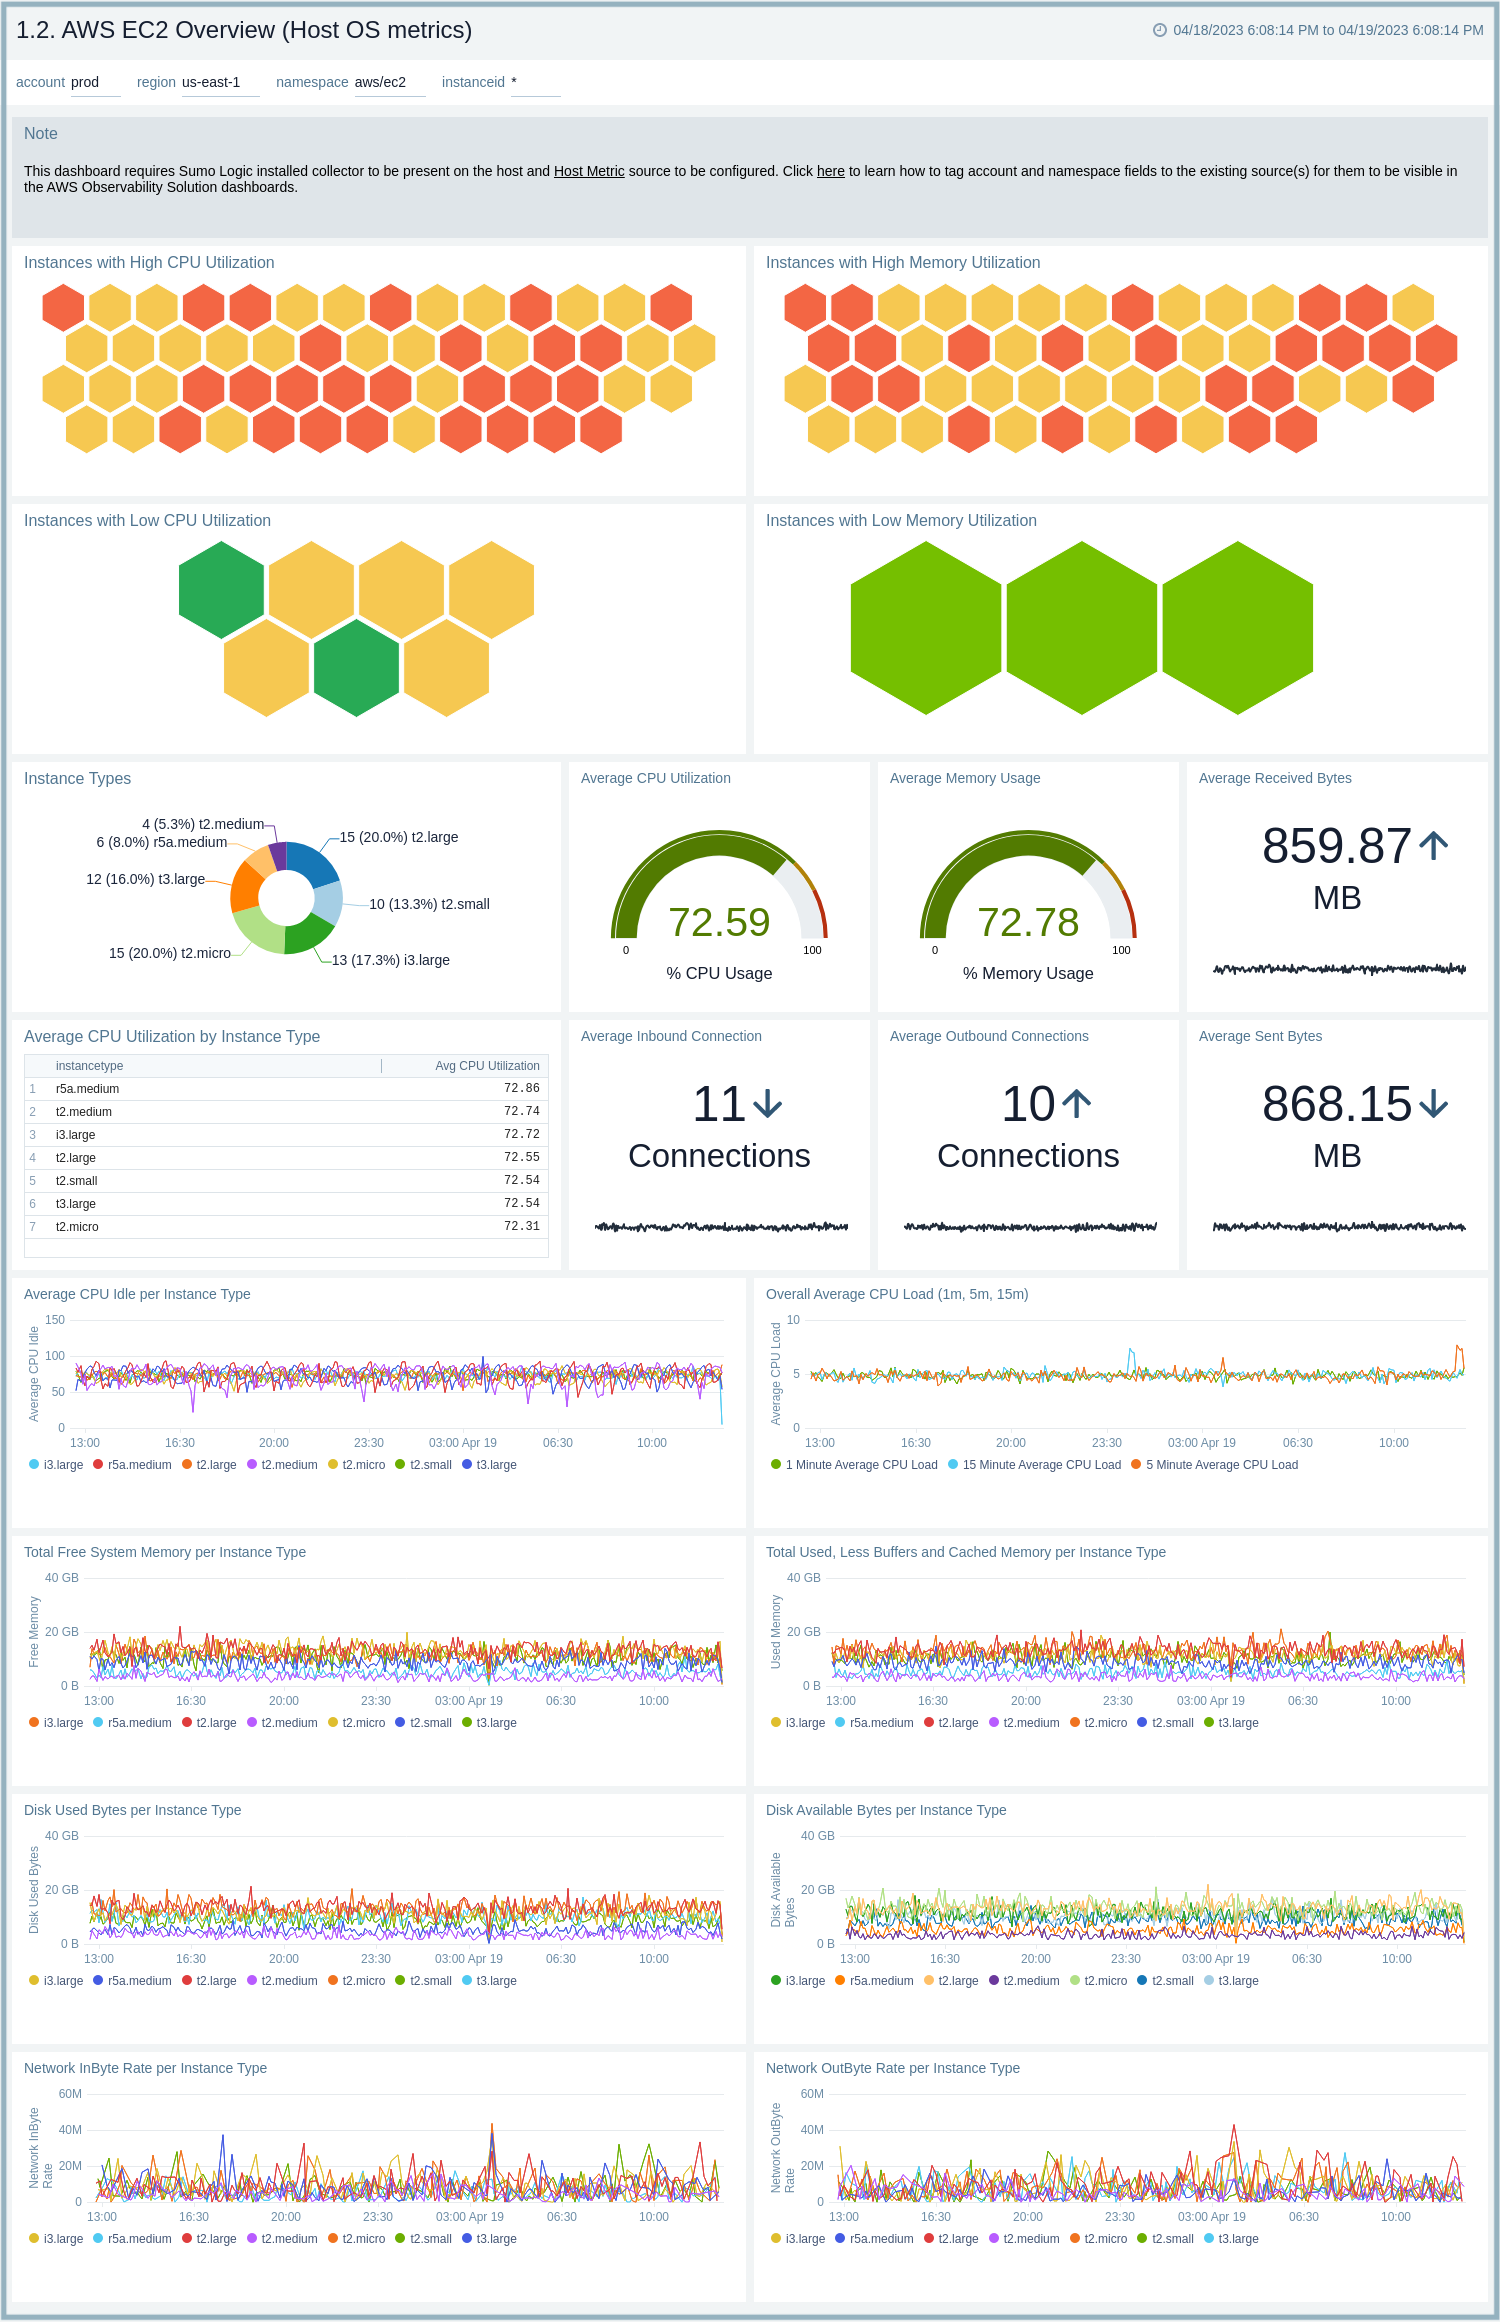
1.2. AWS EC2 Overview (Host OS metrics)
The AWS EC2 Overview (Host OS metrics) dashboard provides insights into EC2 performance throughout your infrastructure, including CPU utilization, network rates, disk, and memory usage.
Use this dashboard to:
- Quickly identify instances with high and low CPU and memory utilization.
- Monitor average statistics across various resource dimensions across all of your EC2 instances.
- Identify resource usage patterns and deviations across instance types to determine which instance types should be resized.
- Monitor average CPU utilization by instance type.
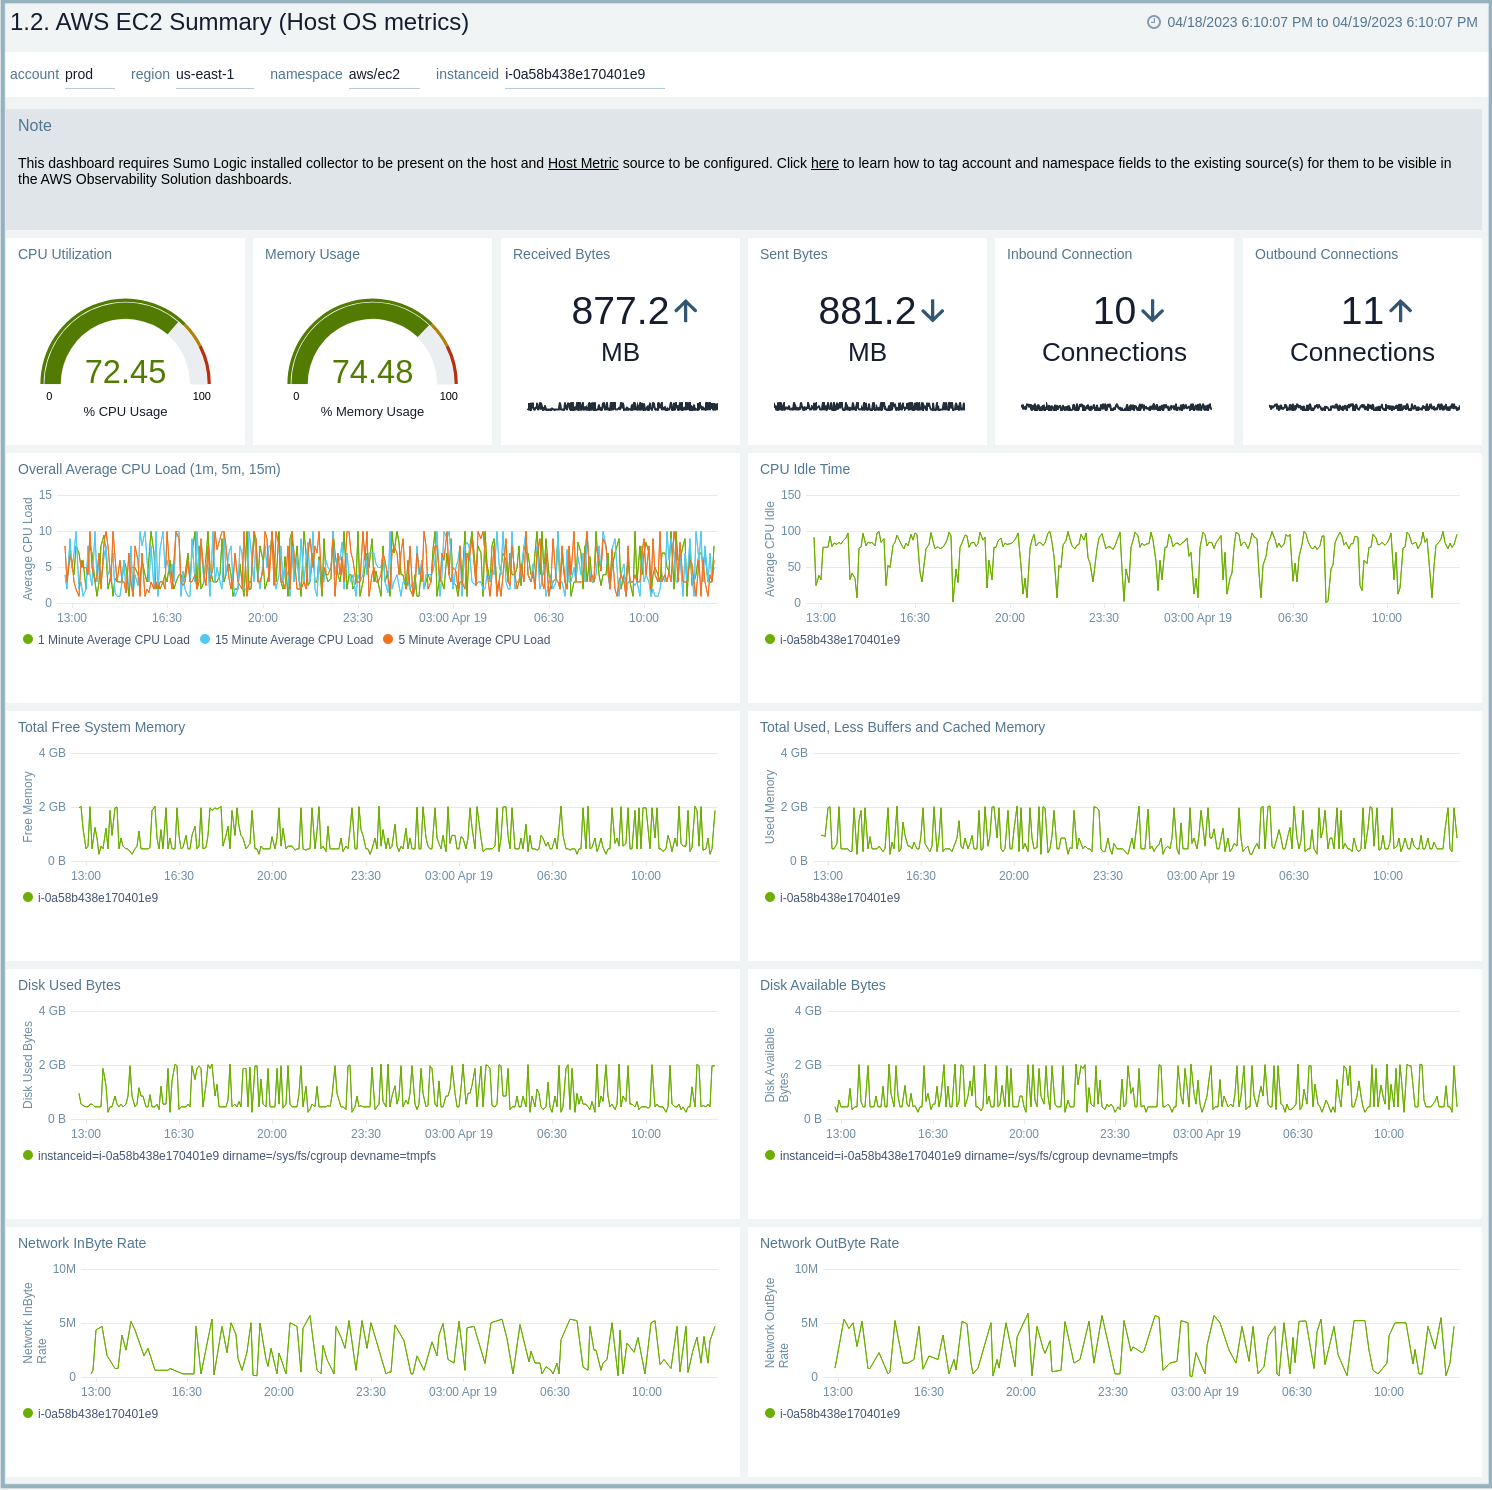
1.2. AWS EC2 Summary (Host OS metrics)
The AWS EC2 Summary (Host OS metrics) dashboard provides resource utilization insights for a specific EC2 instance.
Use this dashboard to:
- Monitor resource utilization statistics for a specific EC2 instance.
- Determine if an instance needs to be resized based on utilization.
- Identify potential infrastructure issues by identifying deviations in trends and monitoring.
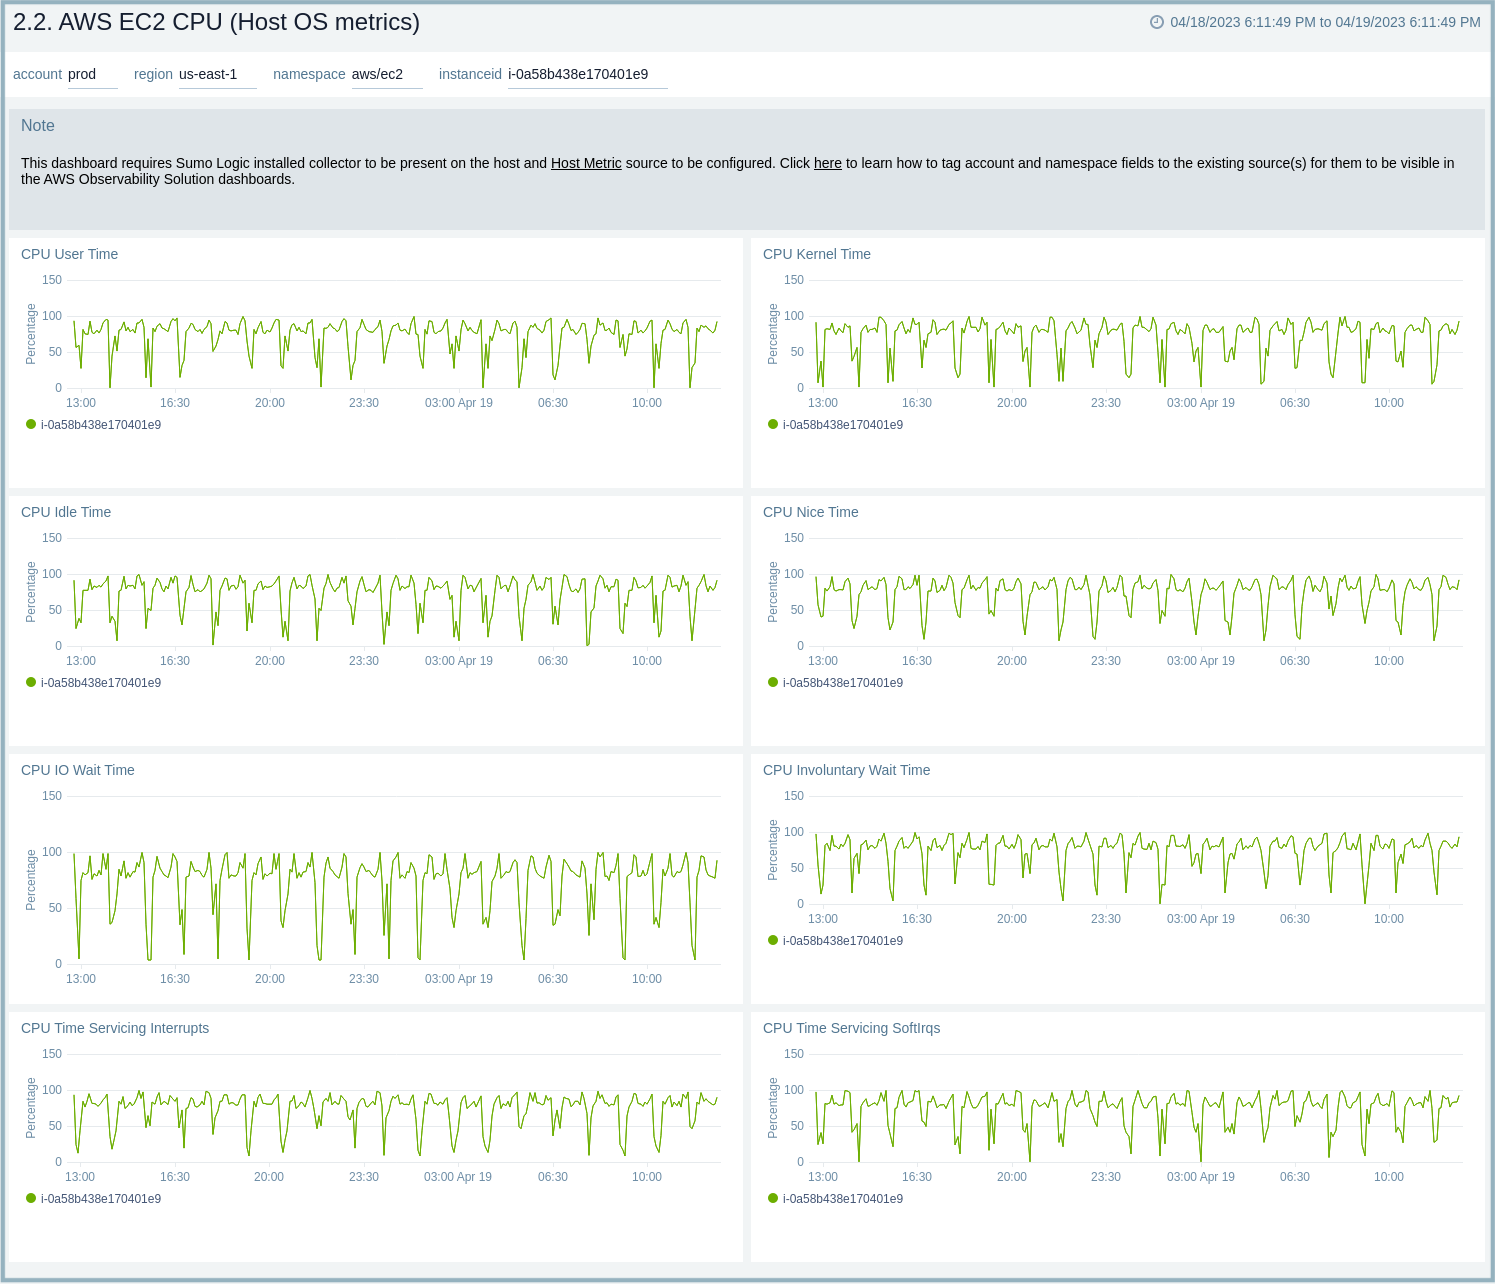
2.2. AWS EC2 CPU (Host OS metrics)
The AWS EC2 CPU (Host OS metrics) dashboard provides insights into EC2 CPU performance throughout your infrastructure, including average CPU load, system, user, idle, and wait times, as well as statistics per instance. Use this dashboard to:
- Quickly identify if high CPU utilization for an EC2 instance is potentially causing a production issue.
- Determine how CPU cycles are being spent across CPU user time, system time, and IO wait time.
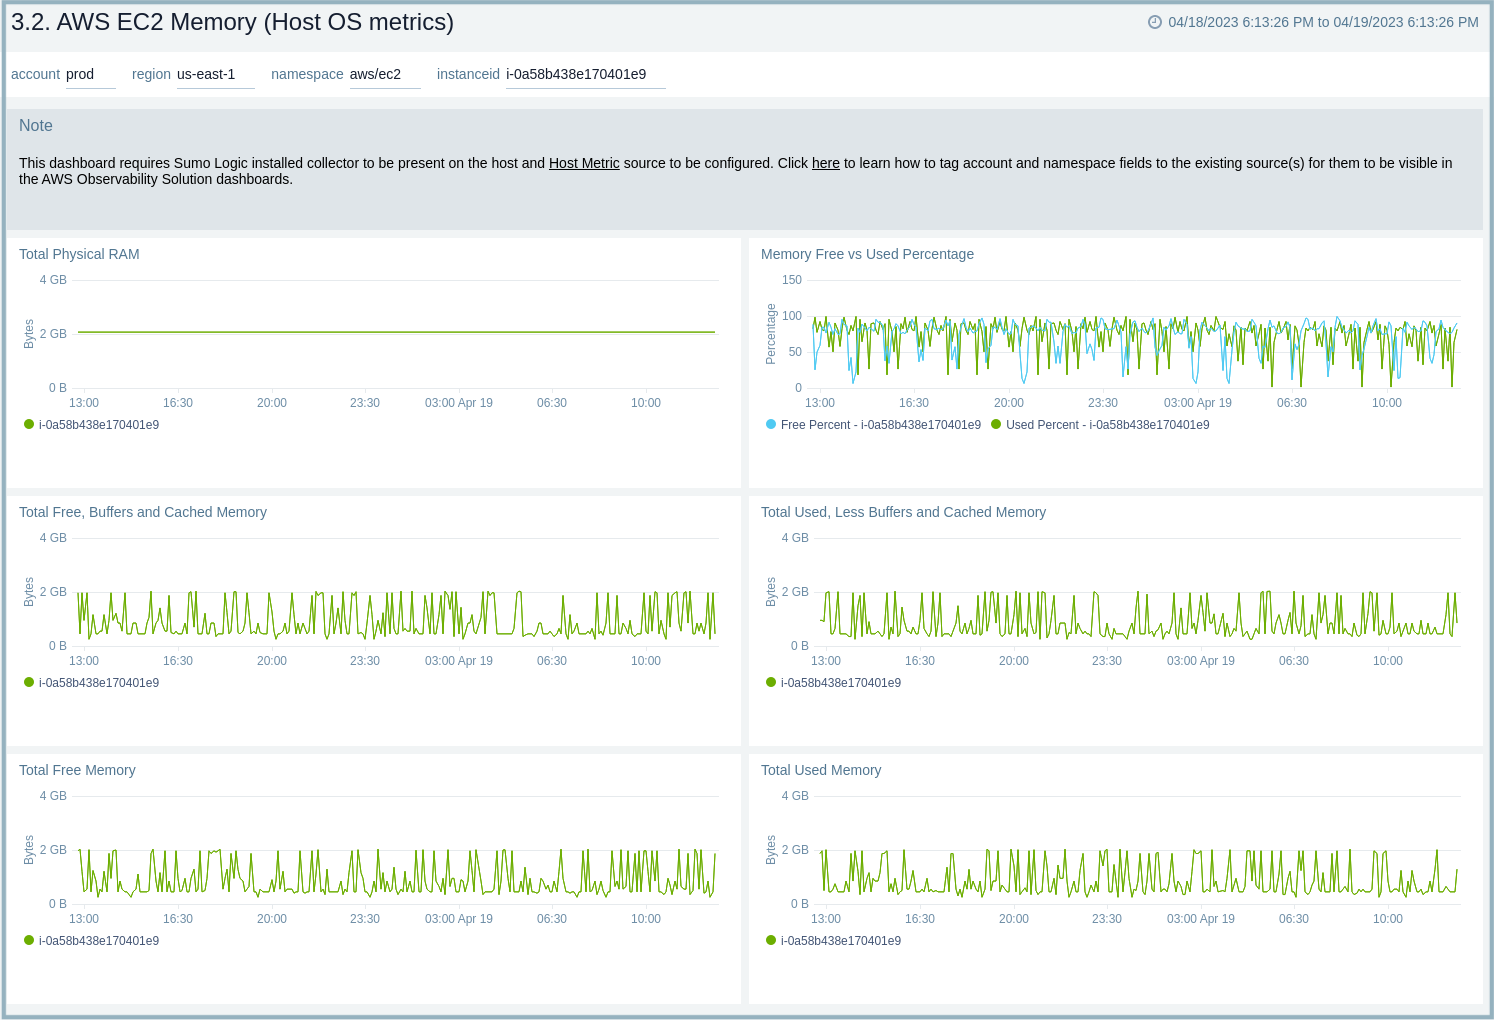
3.2. AWS EC2 Memory (Host OS metrics)
The AWS EC2 Memory (Host OS metrics) dashboard provides insights into EC2 memory usage per instance for total and percentage memory usage, free memory use, buffers, cache memory, and system memory.
Use this dashboard to:
- Quickly identify if high memory utilization for an EC2 instance is potentially causing a production issue.
- Determine how memory is being used across buffers and cache memory.
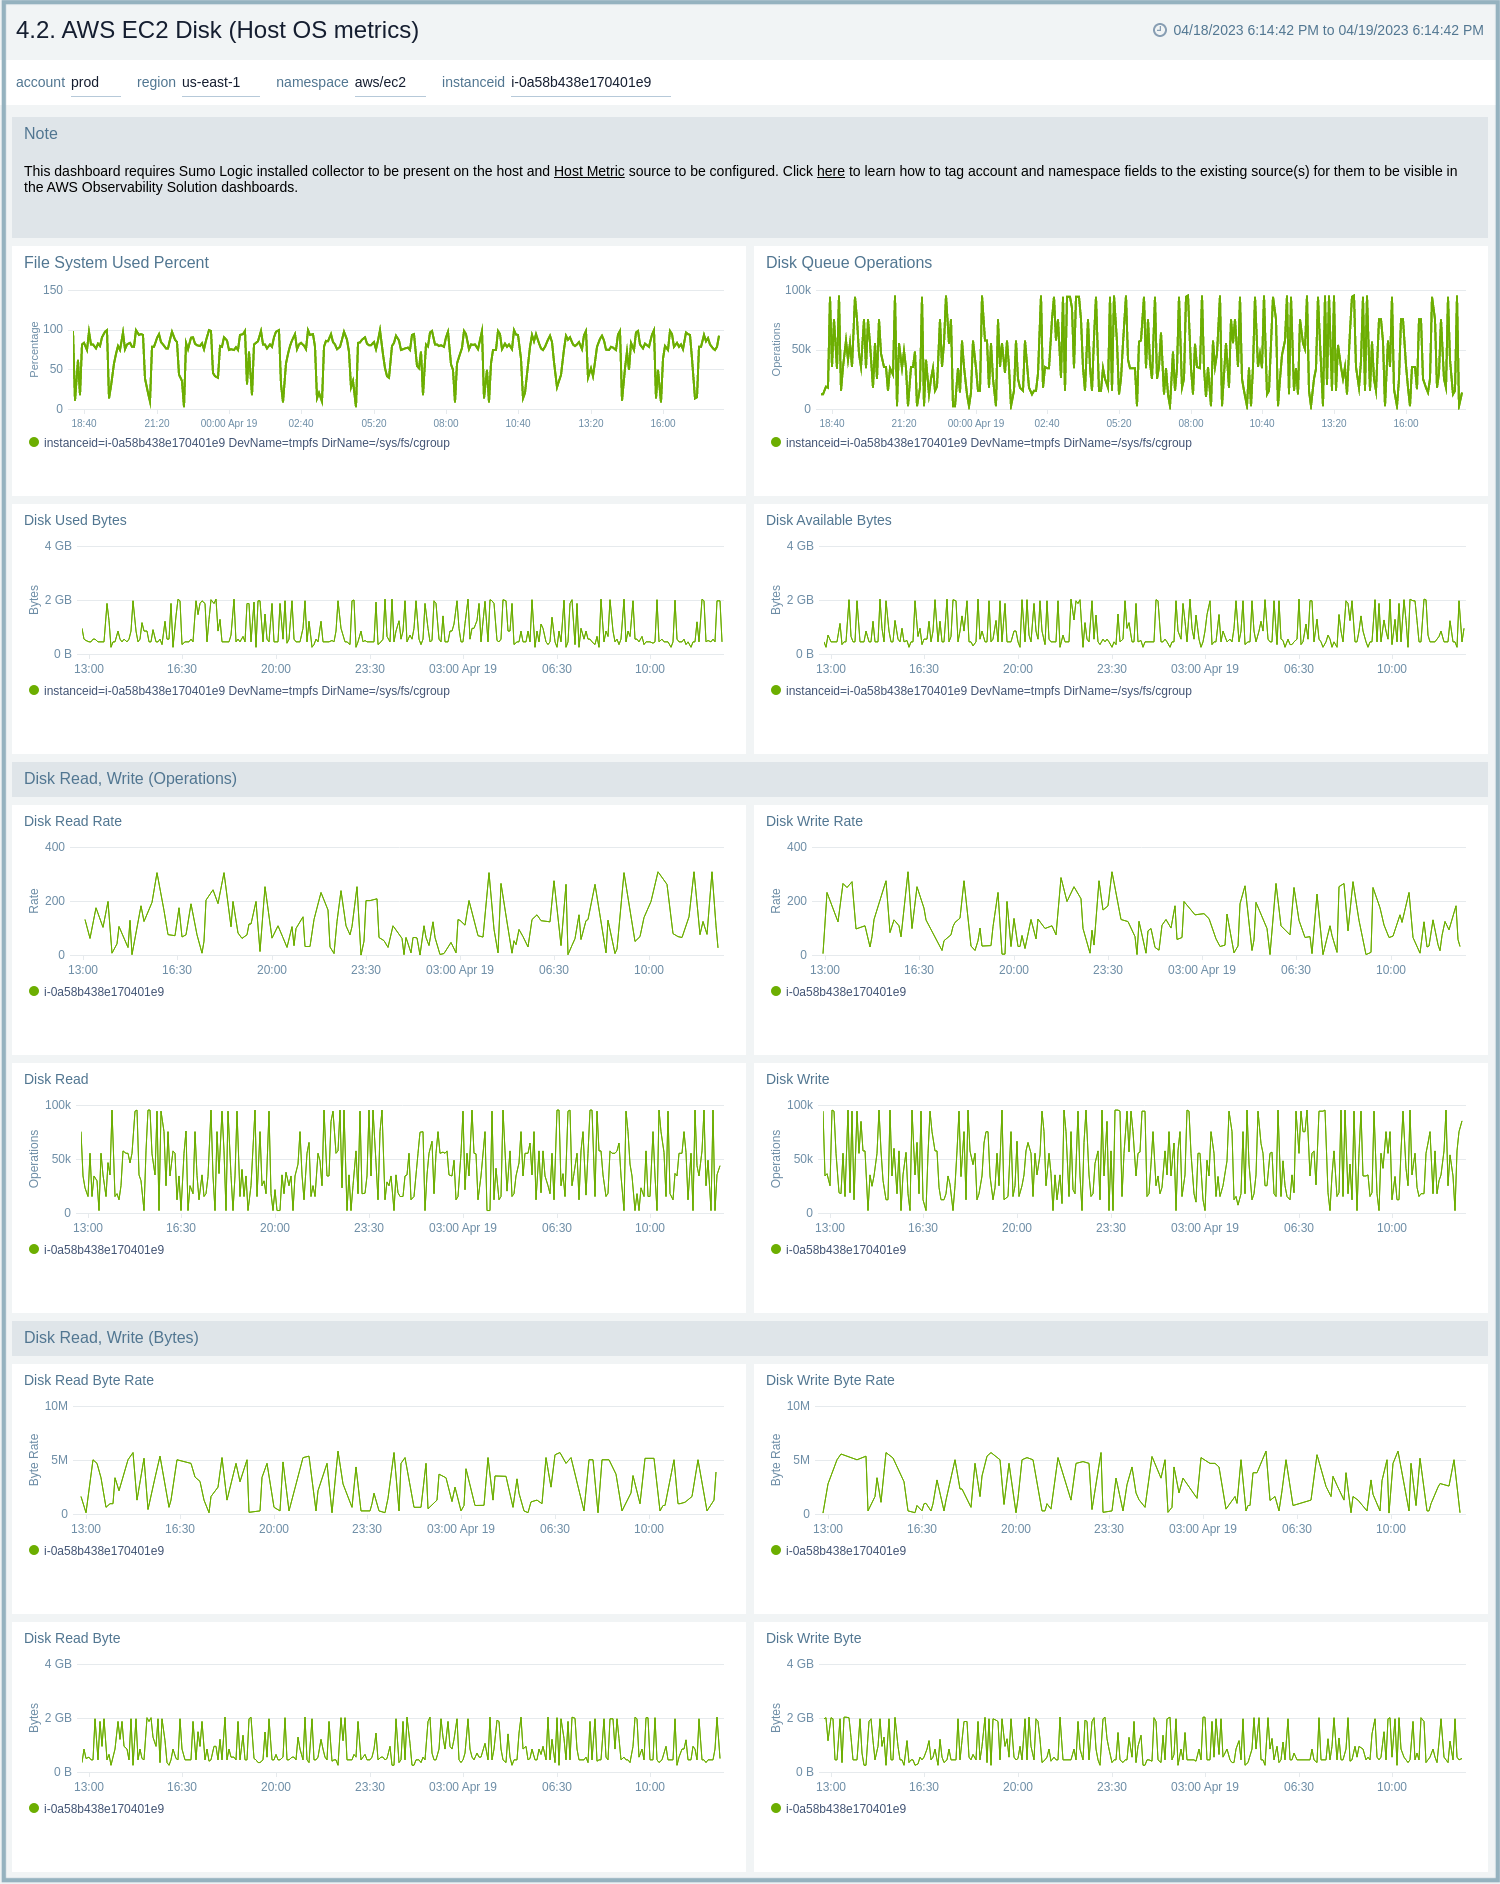
4.2. AWS EC2 Disk (Host OS metrics)
The AWS EC2 Disk (Host OS metrics) dashboard provides insights into EC2 disk usage per instance throughout your infrastructure, including directory, writes and usage, available bytes, used bytes, and byte read and write rates.
Use this dashboard to:
- Quickly identify if high disk utilization for an EC2 instance is potentially causing a production issue.
- Determine which directories have the most disk usage.
- Determine the performance of your storage by monitoring disk read/write rates.
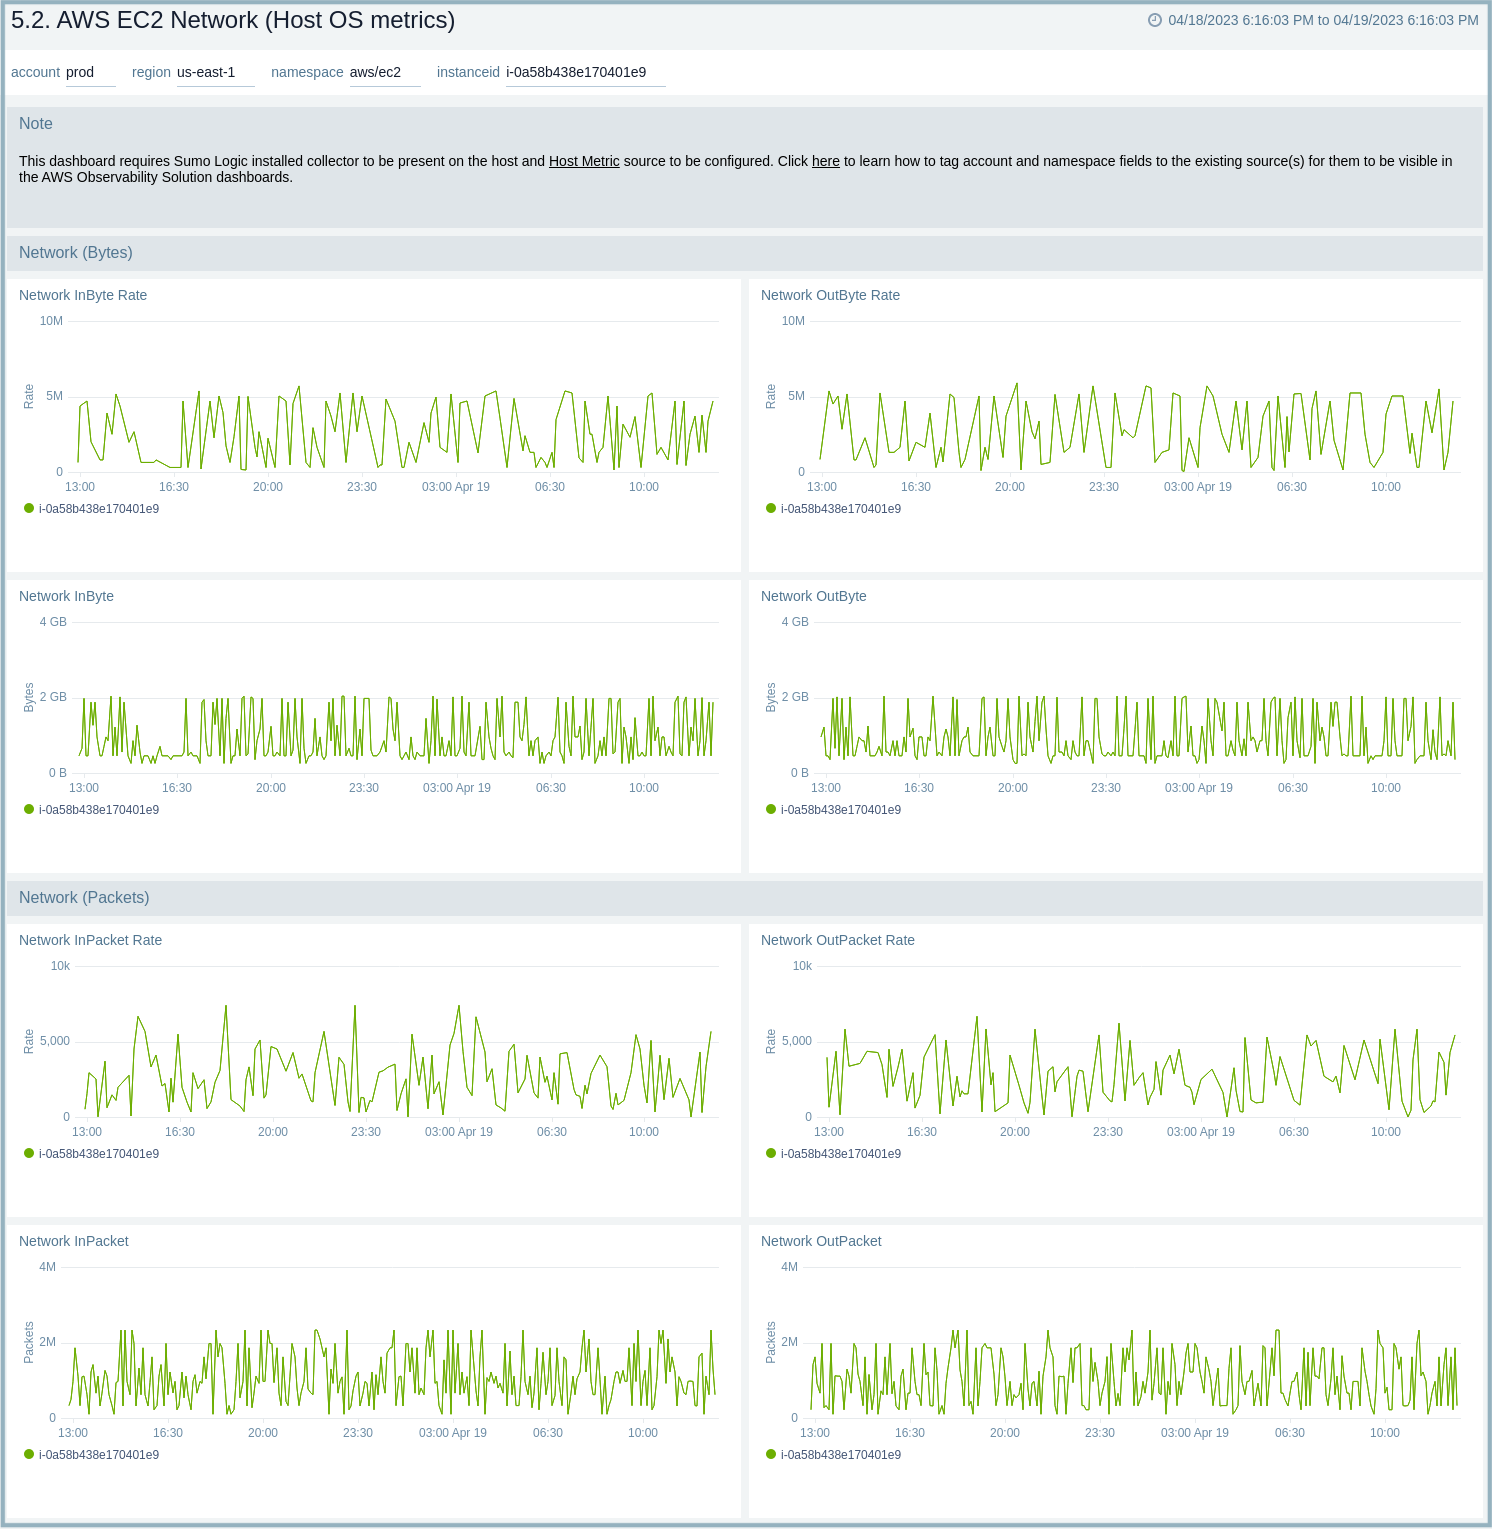
5.2. AWS EC2 Network (Host OS metrics)
The AWS EC2 Network (Host OS metrics) dashboard provides insights into EC2 network performance per instance across your infrastructure, including metrics for the average number of packets in and out, packet rate in and out, and byte rate in and out.
Use this dashboard to:
- Quickly identify if traffic sent and received rates for an EC2 instance are potentially causing a production issue.
- Determine if any improvements need to be made to your AWS networking infrastructure for optimal performance.
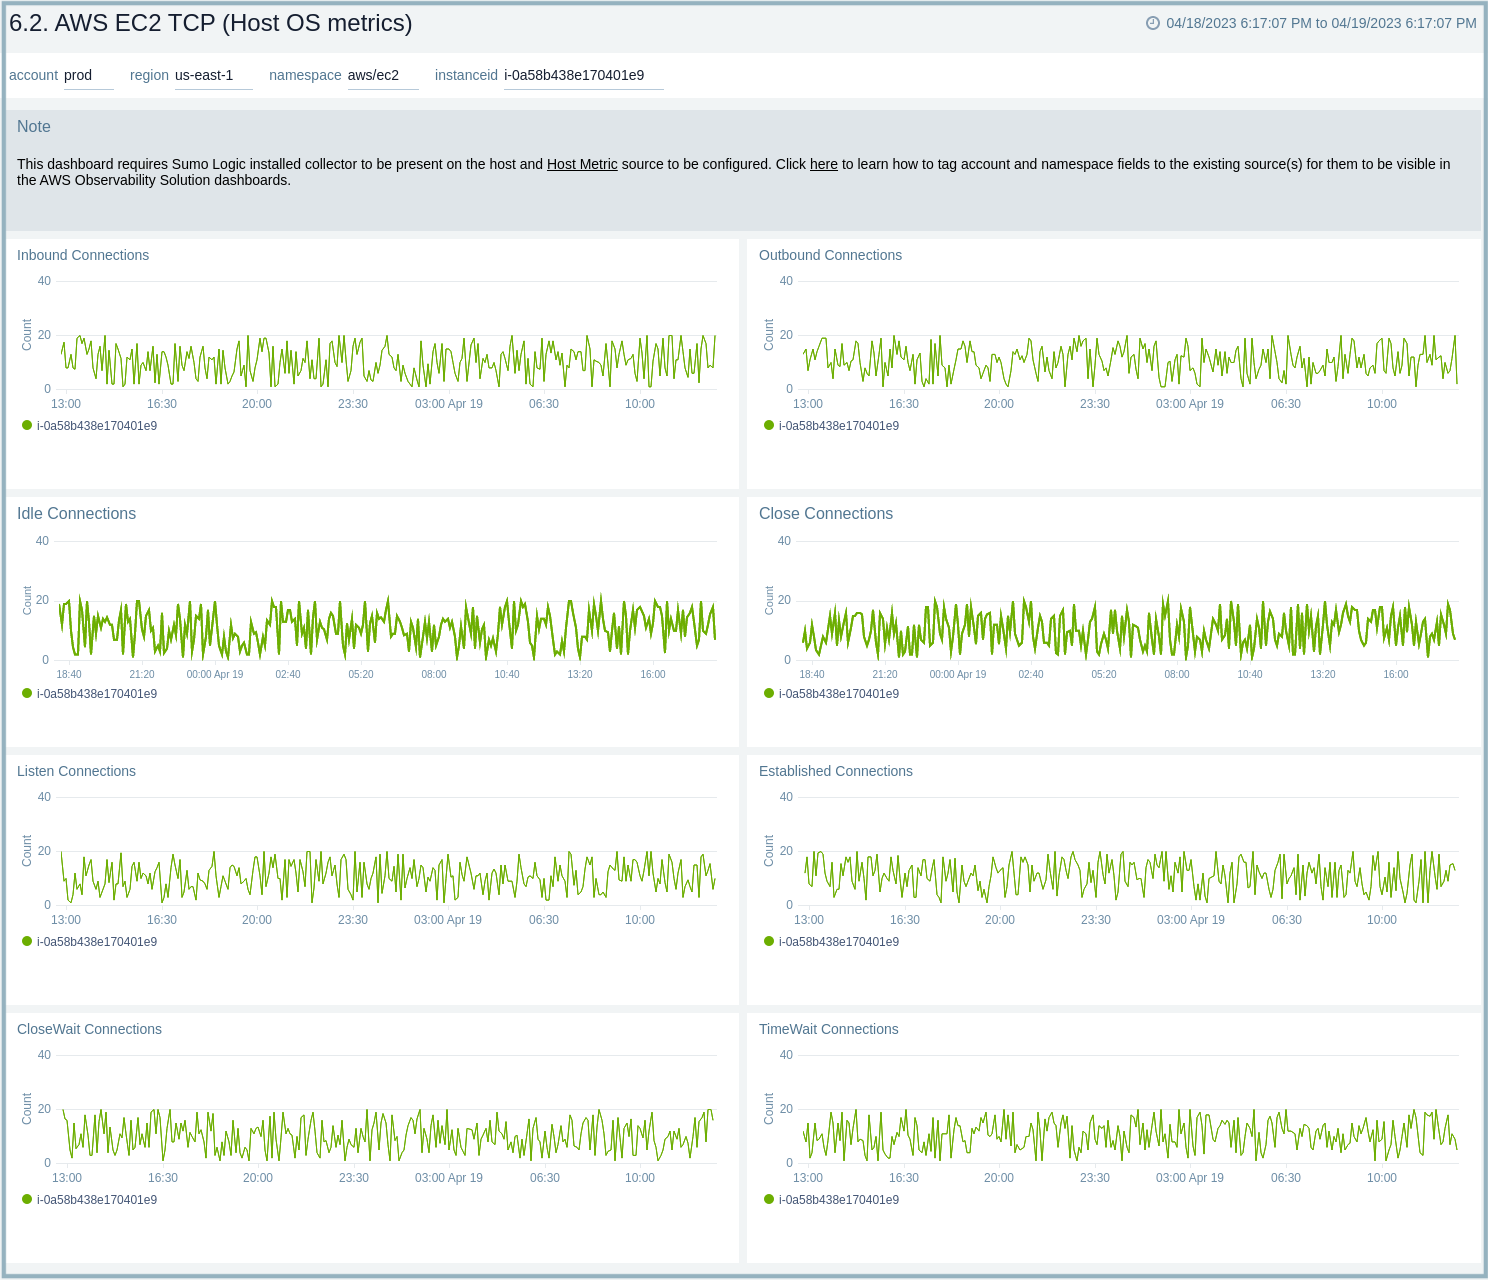
6.2. AWS EC2 TCP (Host OS metrics)
The AWS EC2 TCP (Host OS metrics) dashboard provides insights into TCP traffic performance per EC2 instance throughout your infrastructure, including metrics for inbound and outbound connections, listen and established connections, and close wait and time wait connections.
Use this dashboard to:
- Quickly identify if TCP traffic for an EC2 instance is potentially causing a production issue.
- Identify if any improvements need to be made to optimize TCP traffic by analyzing various TCP connection states.