AWS EC2 Metrics
Amazon Elastic Compute Cloud (Amazon EC2) provides scalable computing capacity in the Amazon Web Services (AWS) Cloud. You can use Amazon EC2 to launch as many or as few virtual servers as you need, configure security and networking, and manage storage. The Sumo Logic App for AWS EC2 allows you to display your EC2 instance metrics (CloudWatch) using predefined dashboards. The App provides dashboards that analyze EC2 instance metrics for CPU, Disk, Network, EBS, and Health Status Checks, and detailed insights into all CloudTrail audit events associated with EC2 instances. It specifically helps identify changes, errors, and user activities.
Log and metrics types
Sample log messages
{
    "eventVersion":"1.08",
    "userIdentity":
    {
        "type":"IAMUser",
        "principalId":"AIDAJ7LGGLTBHHDFNMPSM",
        "arn":"arn:aws:iam::9XXXX34567898:user/cloudhealthuser",
        "accountId":"9XXXXXXX898",
        "accessKeyId":"AKIAXXXXXX22BUTQ",
        "userName":"cloudhealthuser"
    },
    "eventTime":"2022-06-30T08:05:38Z",
    "eventSource":"ec2.amazonaws.com",
    "eventName":"DescribeReservedInstancesListings",
    "awsRegion":"us-east-1",
    "sourceIPAddress":"177.20.215.222",
    "userAgent":"aws-sdk-ruby2/2.11.447 jruby/2.5.7 java cloudhealth",
    "errorCode":"Client.OptInRequired",
    "errorMessage":"AccountId '9XXXXXX898', You are not authorized to use the requested product. Please complete the seller registration null.","requestParameters":
    {
        "reservedInstancesListingSet":{},
        "reservedInstancesSet":{},
        "filterSet":{}
    },
    "responseElements":null,
    "requestID":"fe609b44-dbc5-454b-8f72-9475d1639441",
    "eventID":"6fc6df43-1ba1-4eb3-948a-0aebc569c024",
    "readOnly":true,
    "eventType":"AwsApiCall",
    "managementEvent":true,
    "recipientAccountId":"9XXXXX7898",
    "eventCategory":"Management",
    "tlsDetails":
    {
        "tlsVersion":"TLSv1.2",
        "cipherSuite":"ECDHE-RSA-XXXXX-SHA",
        "clientProvidedHostHeader":"ec2.us-west-1.amazonaws.com"
    }
}
Sample queries
account=* region=* namespace=aws/ec2 instanceid=* metric=CPUUtilization Statistic=average | avg
account=* region=* namespace=aws/ec2 eventname eventsource "ec2.amazonaws.com" errorCode
| json "eventSource", "awsRegion", "requestParameters", "responseElements", "recipientAccountId" as event_source, region, requestParameters, responseElements, accountid nodrop
| json "userIdentity", "eventName", "sourceIPAddress", "userAgent", "eventType", "requestID", "errorCode", "errorMessage", "eventCategory", "managementEvent" as userIdentity, event_name, src_ip, user_agent, event_type, request_id, error_code, error_message, event_category, management_event nodrop
| where event_source = "ec2.amazonaws.com"
| "aws/ec2" as namespace
| json field=userIdentity "type", "principalId", "arn", "userName", "accountId" nodrop
| json field=userIdentity "sessionContext.attributes.mfaAuthenticated" as mfaAuthenticated nodrop
| parse field=arn ":assumed-role/*" as user nodrop
| parse field=arn "arn:aws:iam::*:*" as accountId, user nodrop
| json field=requestParameters "instanceType", "instancesSet", "instanceId", "DescribeInstanceCreditSpecificationsRequest.InstanceId.content" as req_instancetype, req_instancesSet, req_instanceid_1, req_instanceid_2 nodrop
| json field=req_instancesSet "item", "items" as req_instancesSet_item, req_instancesSet_items nodrop
| parse regex field=req_instancesSet_item "\"instanceId\":\s*\"(?<req_instanceid_3>.*?)\"" nodrop
| parse regex field=req_instancesSet_items "\"instanceId\":\s*\"(?<req_instanceid_4>.*?)\"" nodrop
| json field=responseElements "instancesSet.items" as res_responseElements_items nodrop
| parse regex field=res_responseElements_items "\"instanceType\":\s*\"(?<res_instanceType>.*?)\"" nodrop
| parse regex field=res_responseElements_items "\"instanceId\":\s*\"(?<res_instanceid>.*?)\"" nodrop
| if (!isBlank(req_instanceid_1), req_instanceid_1,  if (!isBlank(req_instanceid_2), req_instanceid_2, if (!isBlank(req_instanceid_3), req_instanceid_3, if (!isBlank(req_instanceid_4), req_instanceid_4, "")))) as req_instanceid
| if (!isBlank(req_instanceid), req_instanceid, res_instanceid) as instanceid
| if (!isBlank(req_instancetype), req_instancetype, res_instancetype) as instanceType
| if (isEmpty(error_code), "Success", "Failure") as event_status
| if (isEmpty(userName), user, userName) as user
| tolowercase(instanceid) as instanceid
| count as count by error_code | sort by count, error_code asc | limit 10
Viewing AWS EC2 dashboards
All dashboards have a set of filters that you can apply to the entire dashboard. Use these filters to drill down and examine the data to a granular level.
- You can change the time range for a dashboard or panel by selecting a predefined interval from a drop-down list, choosing a recently used time range, or specifying custom dates and times. Learn more.
- If required, configure the refresh interval rate for a dashboard or panel by clicking the drop-down arrow next to the refresh icon.
- Click the funnel icon in the dashboard top menu bar to filter dashboard with Template Variables.

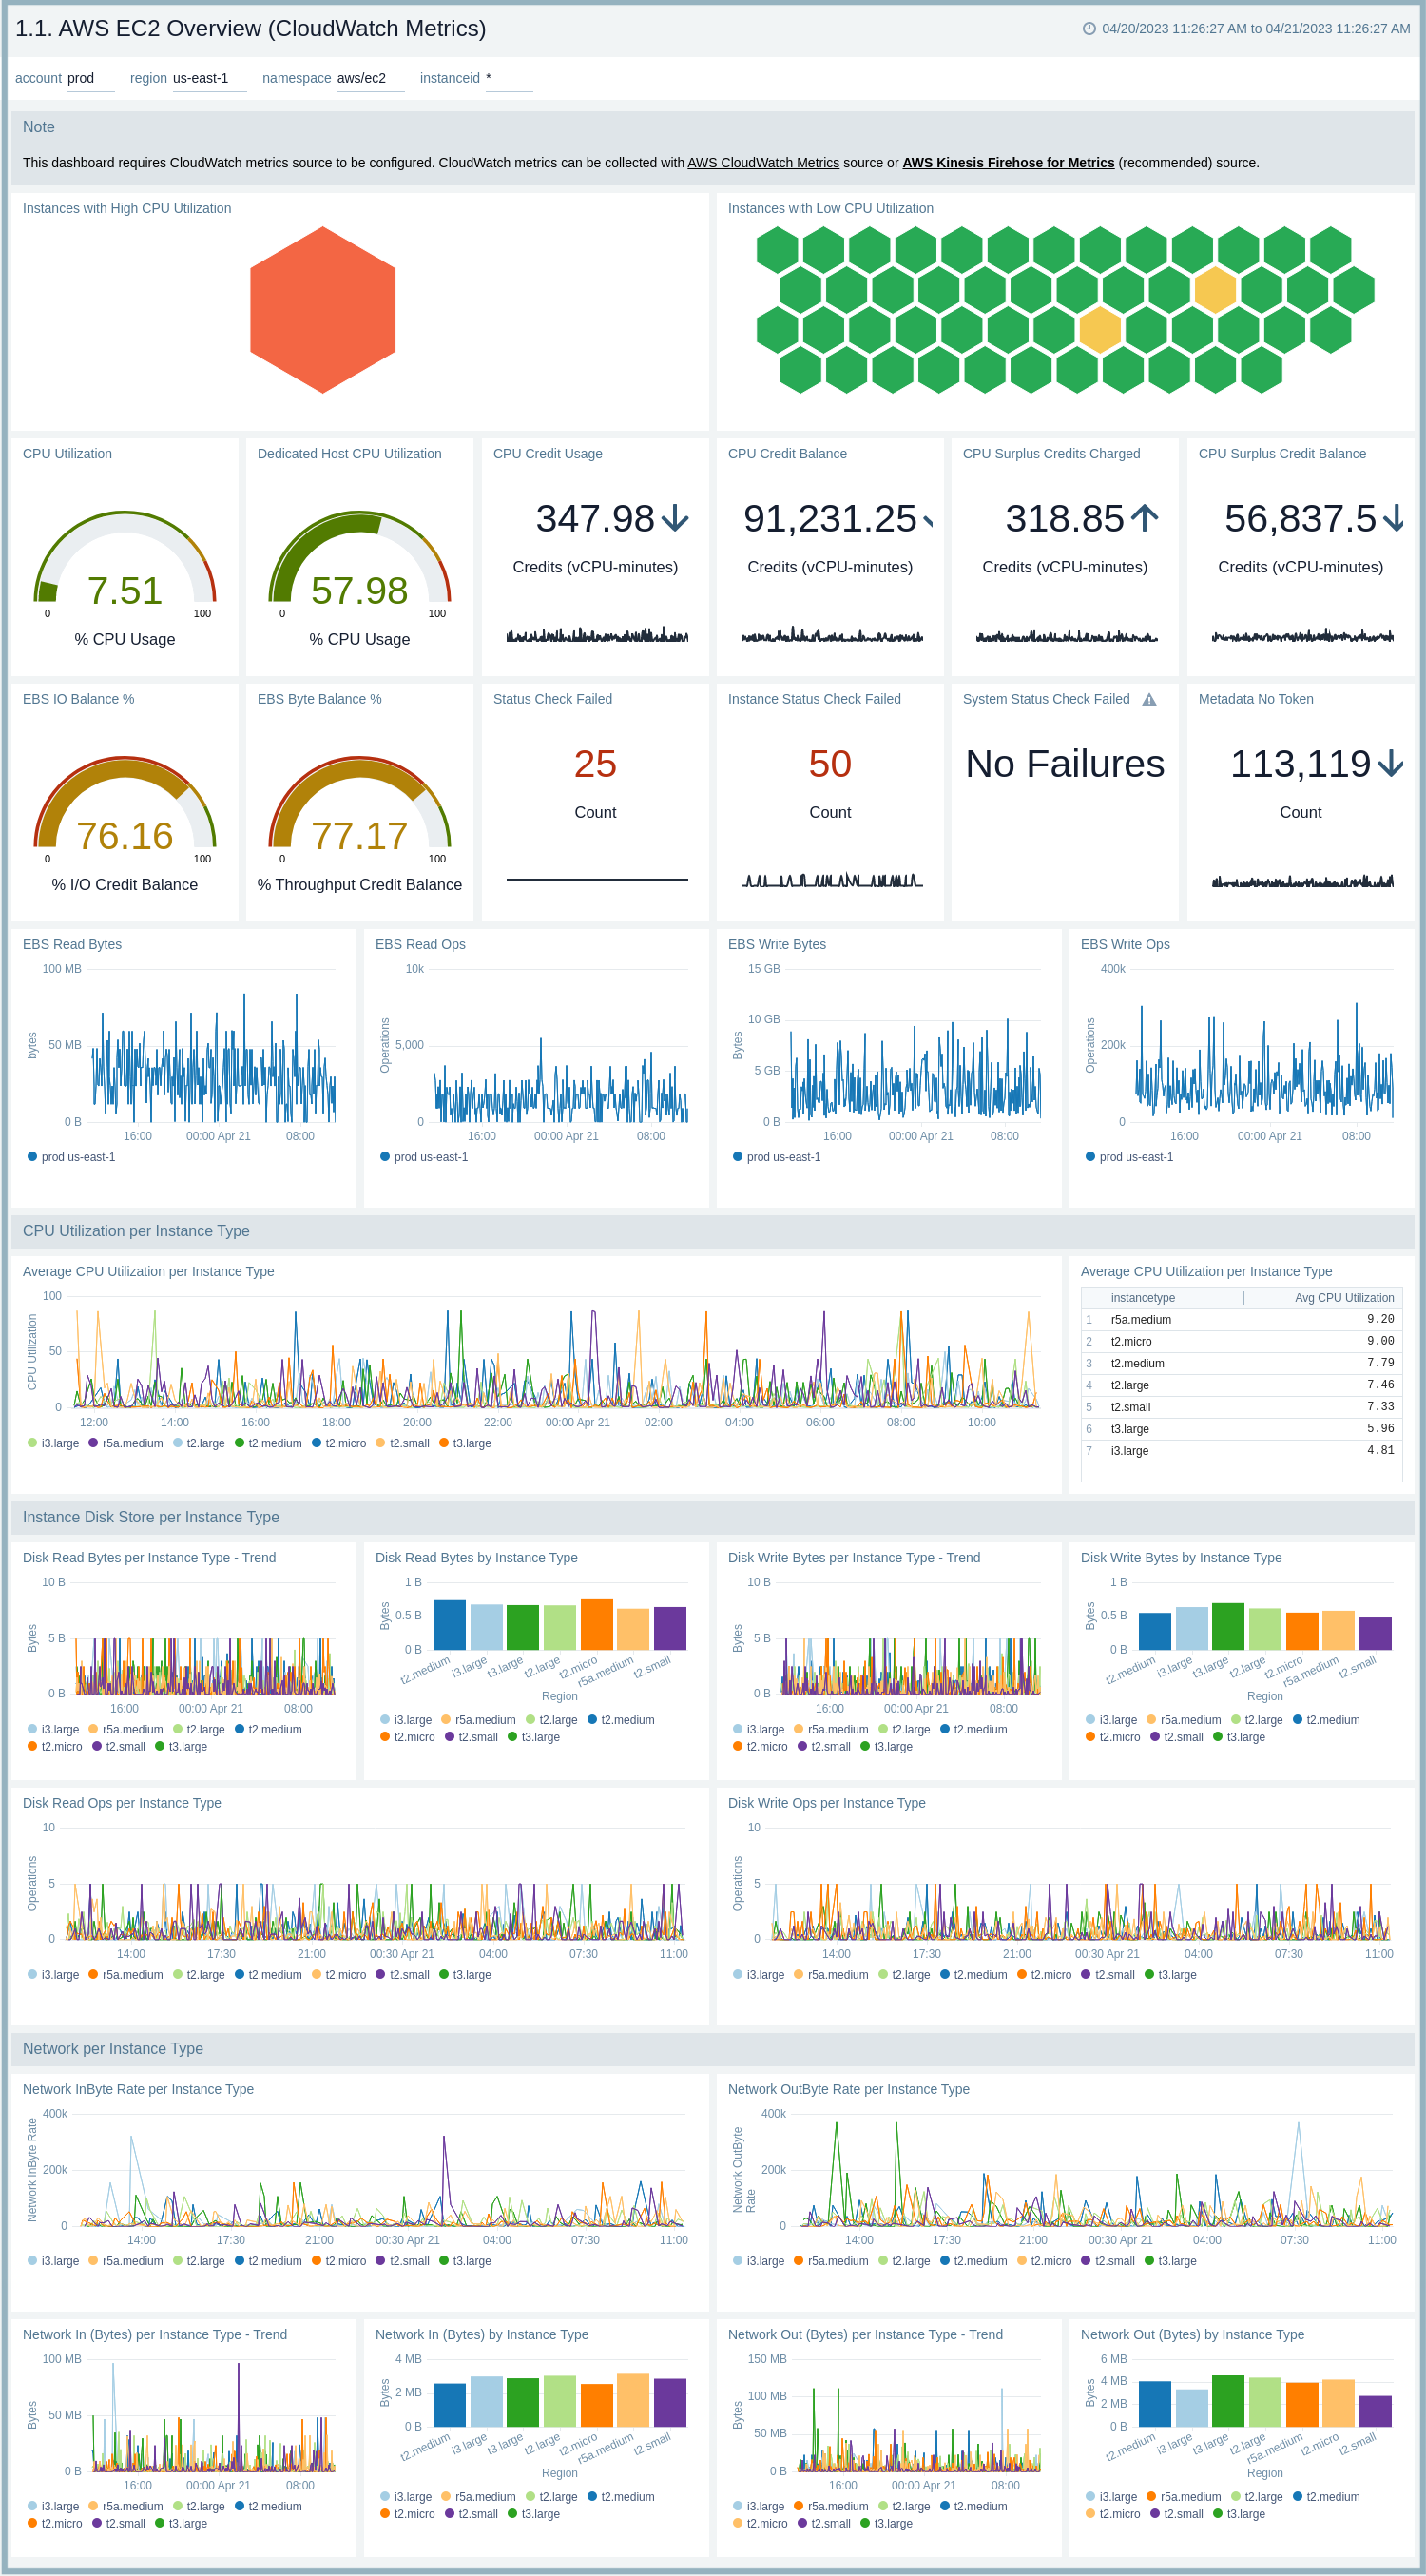
1.1. AWS EC2 Overview (CloudWatch Metrics)
The AWS EC2 Overview (CloudWatch Metrics) dashboard provides at-a-glance information about a CPU, instance disk store, network and EBS volume usage along with instance health status.
Use this dashboard to:
- Monitor average CPU utilization and dedicated host CPU utilization, along with instances with High and Low CPU utilization.
- Monitor CPU credit Usage,Balance,Surplus Credit Charge,Surplus Credit balance.
- EBS related metrics like IO Balance, Byte Balance, Read/Write - bytes, ops.
- Identify count of Status checks.
- Observe all relevant metrics for CPU, Internal Disk Store, Network utilization per instance type.
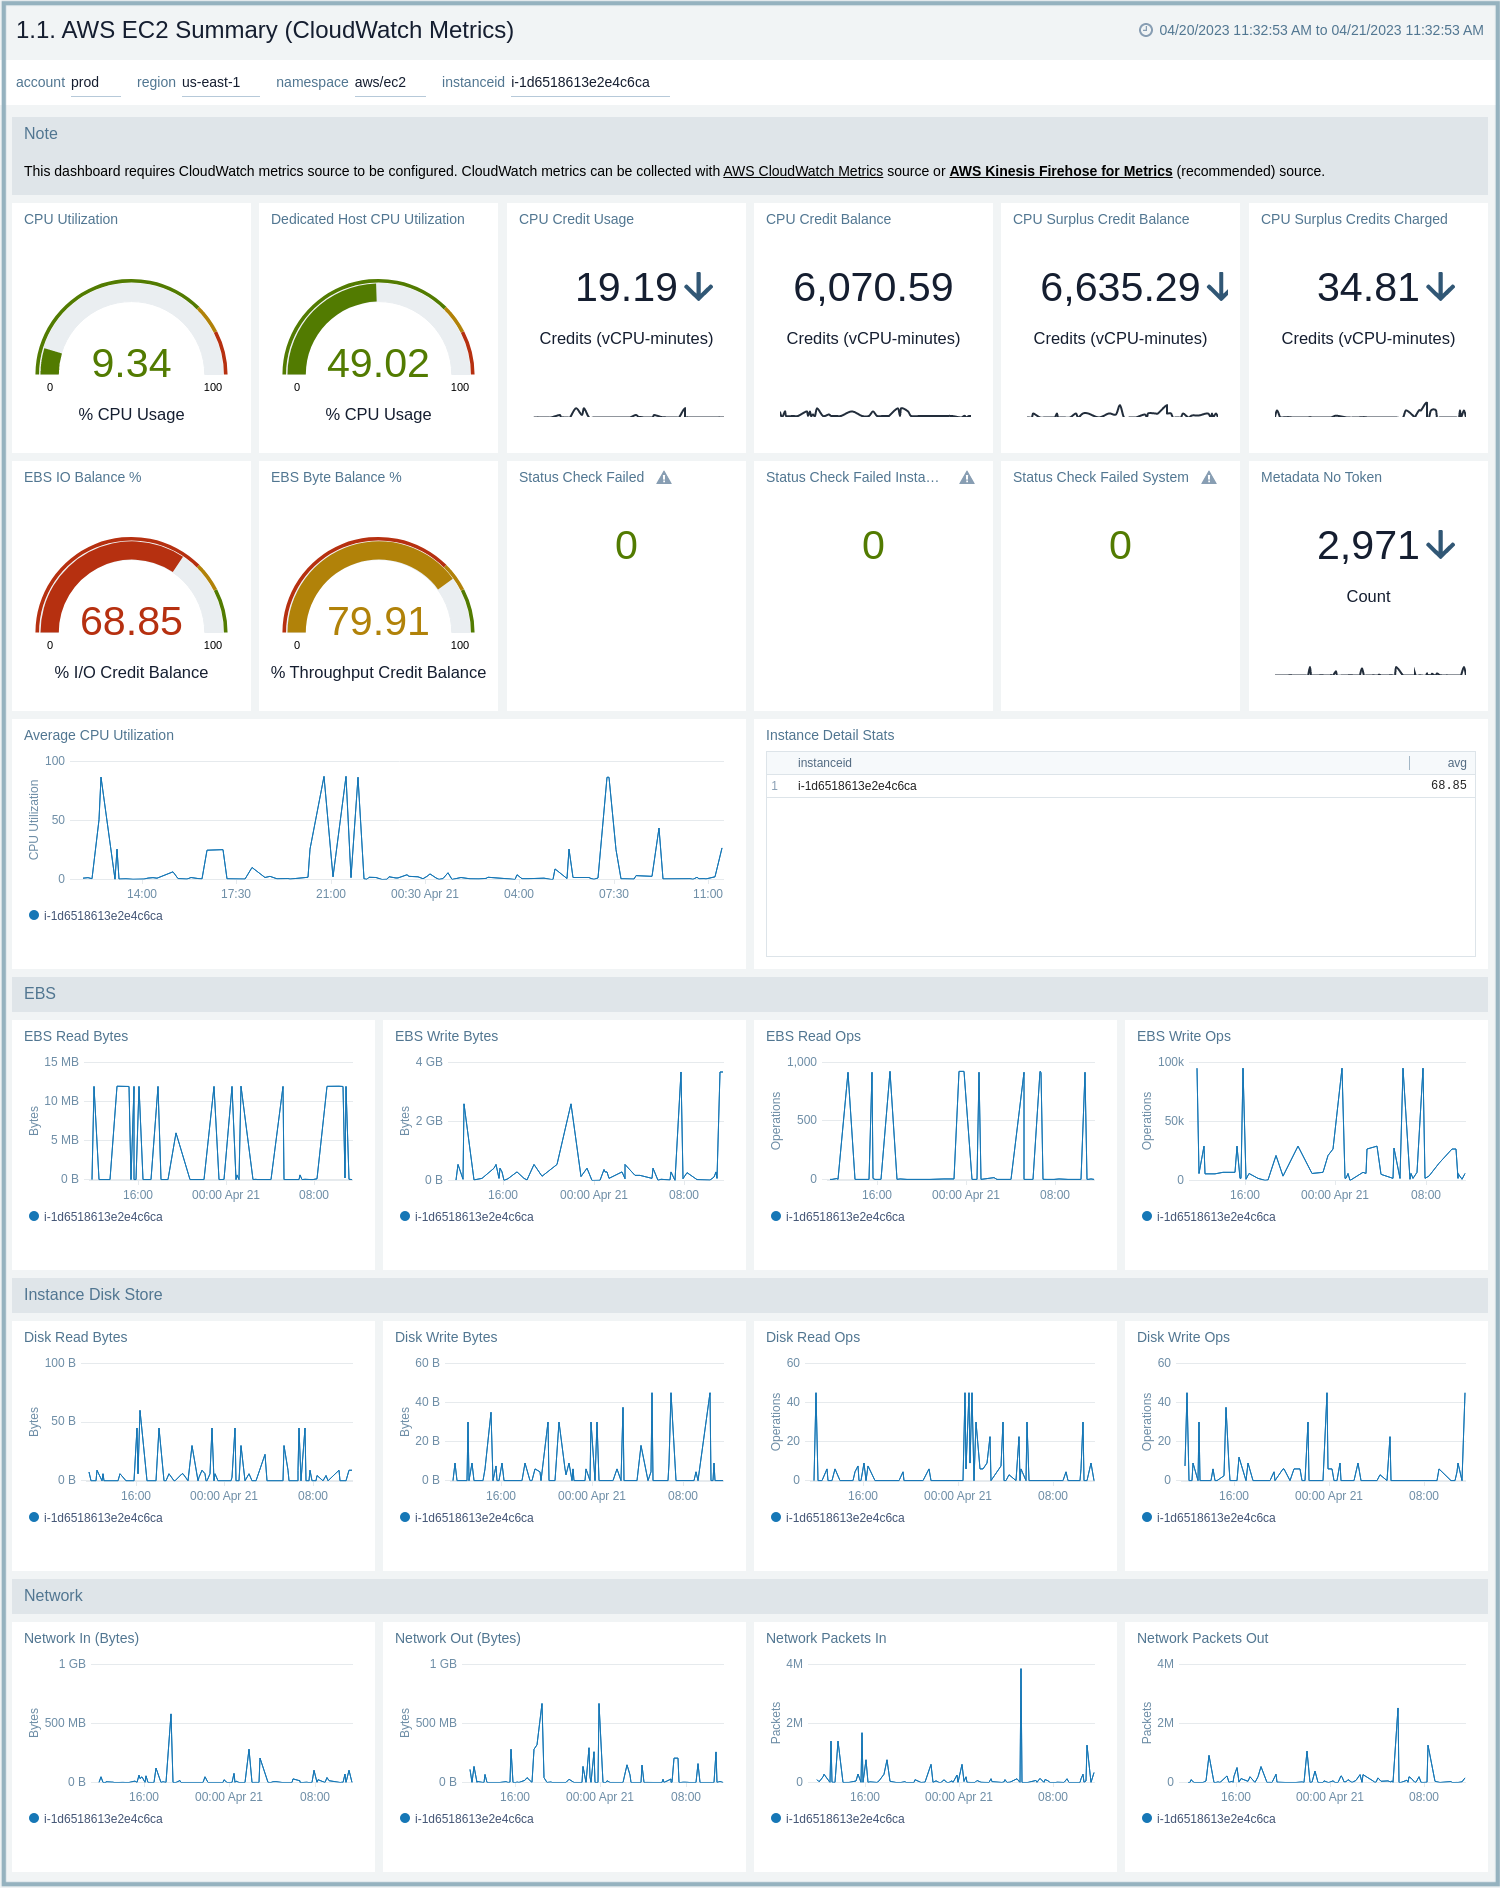
1.1. AWS EC2 Summary (CloudWatch Metrics)
The AWS EC2 Summary (CloudWatch Metrics) dashboard provides at-a-glance information about an CPU, instance disk store, network, and EBS volume usage along with instance health status.
Use this dashboard to:
- Monitor CPU utilization along with CPU credit details & status check counts for EC2.
- EBS related metrics for EC2 instance.
- Observe Instance Disk Store (disk read/write bytes and operations) for EC2 instance.
- Monitor Network usage metrics (network in/out byes and packets) for EC2 instance.
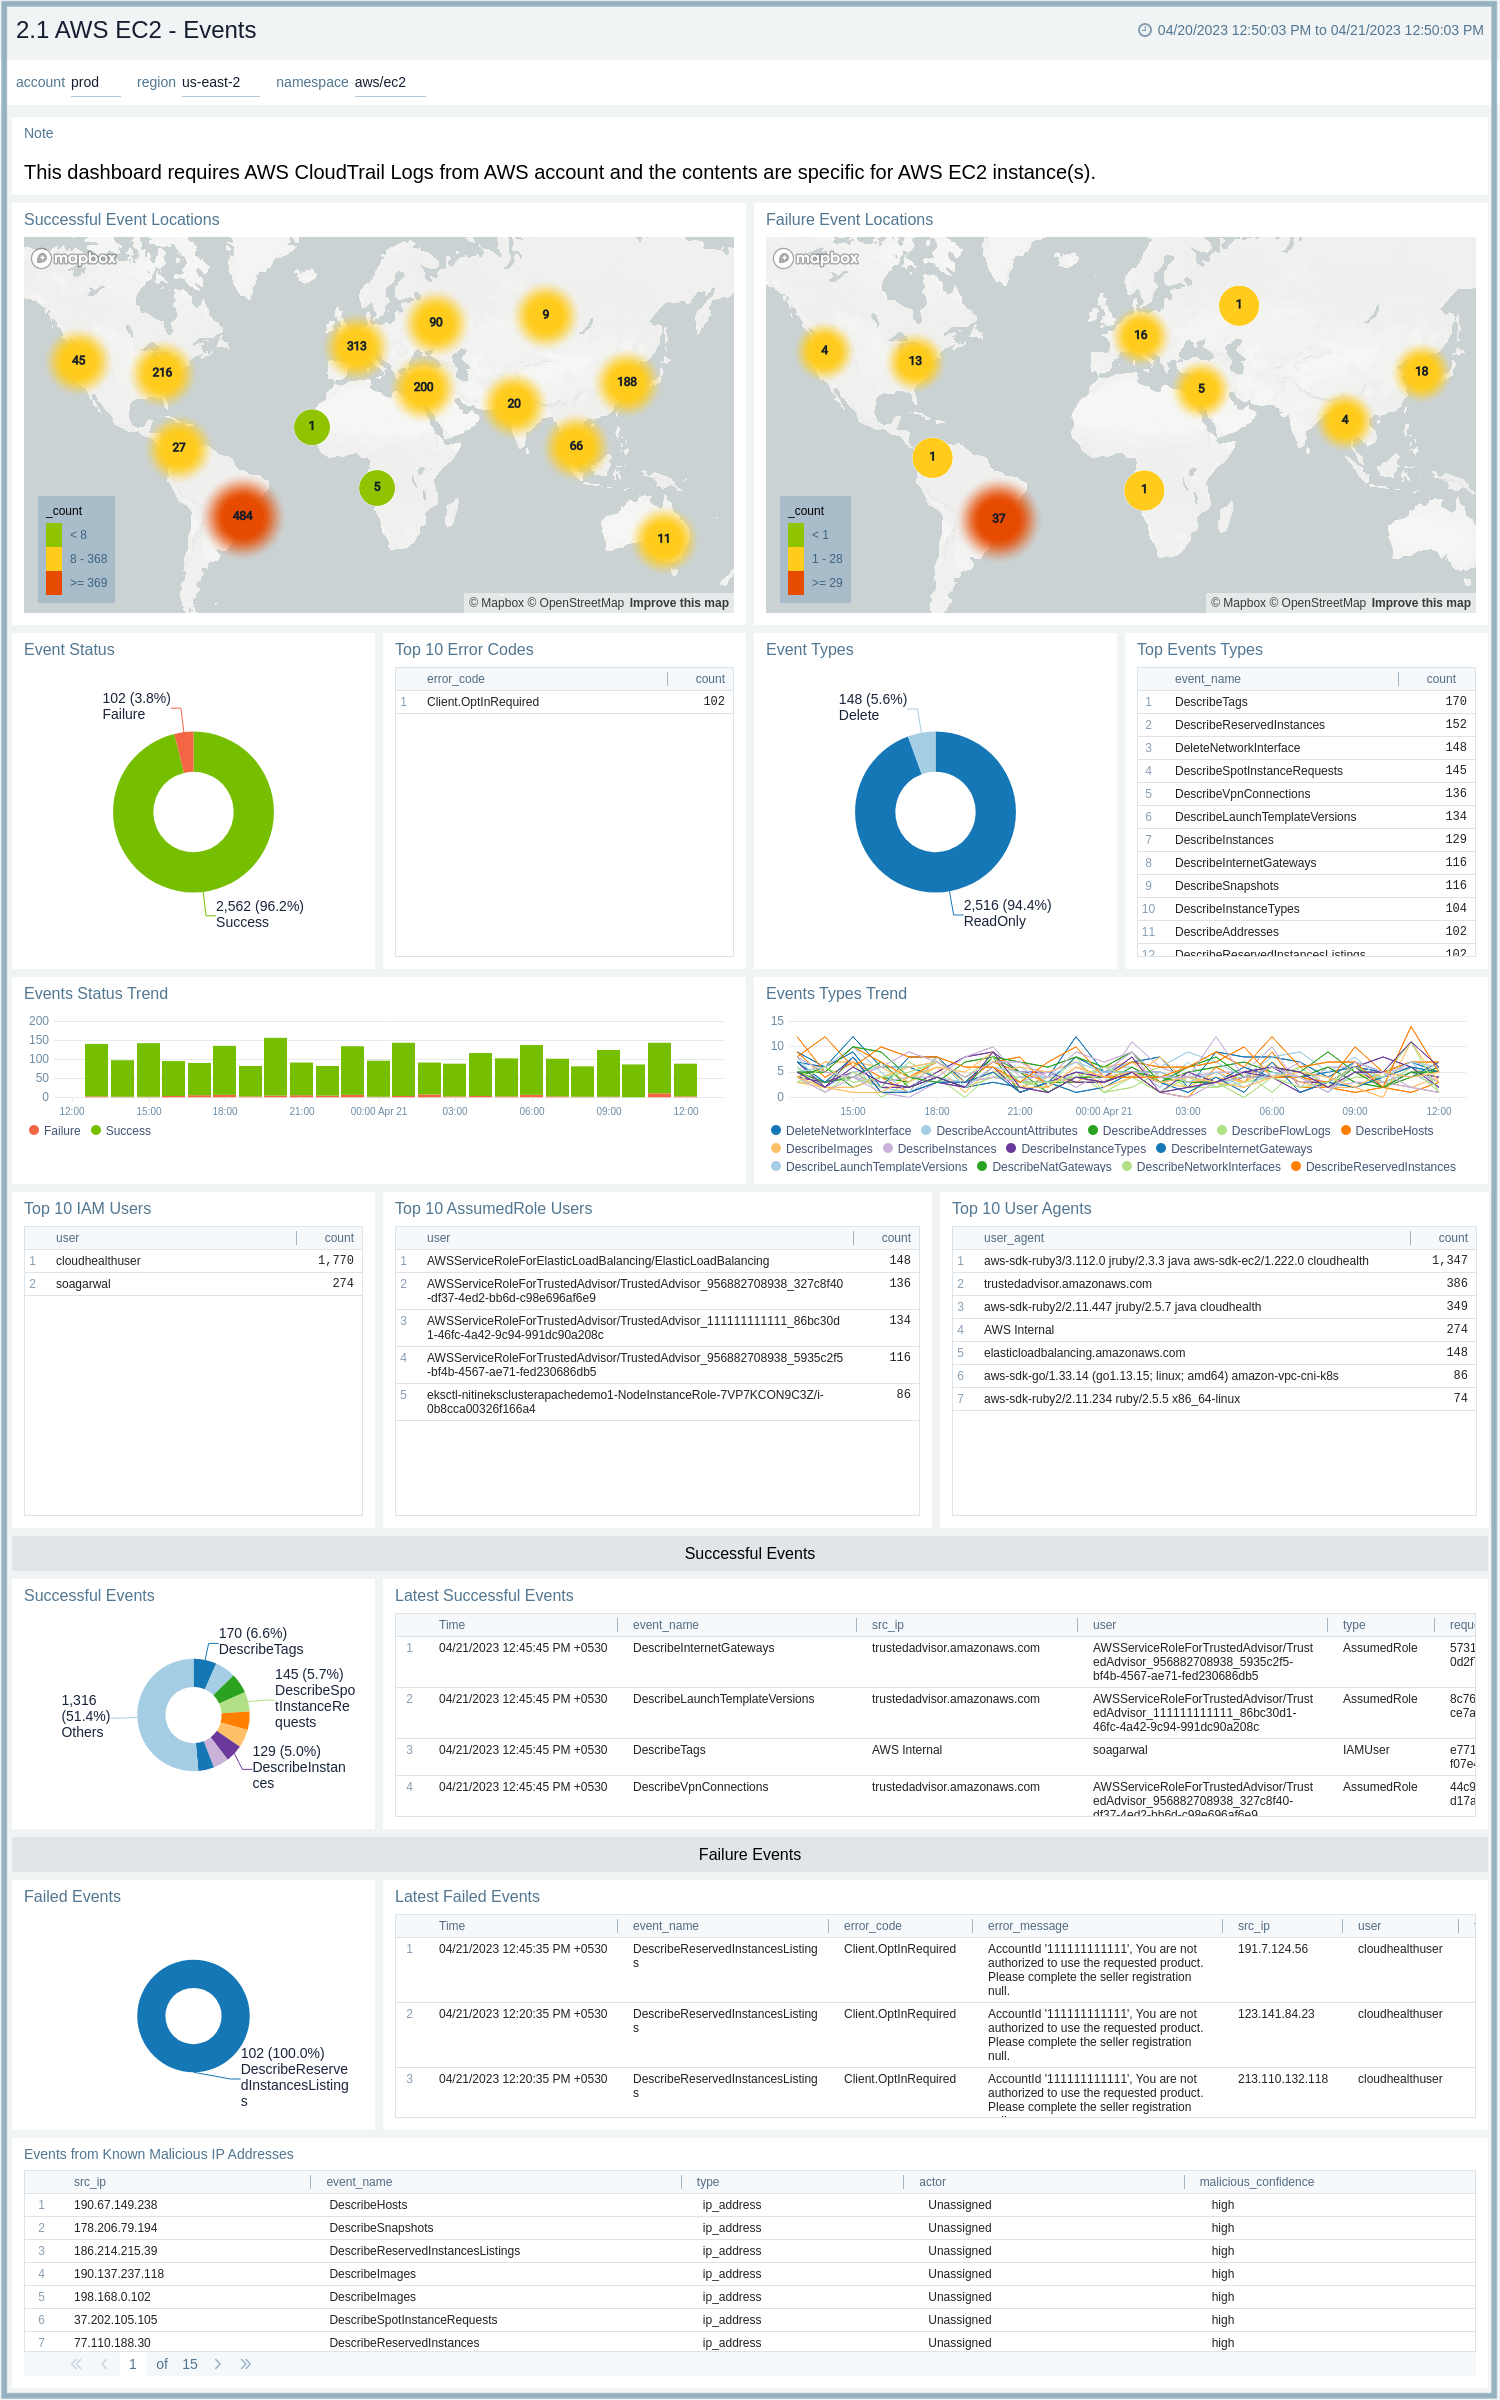
2.1 AWS EC2 - Events (CloudTrail)
The AWS EC2 - Events dashboard provides detailed insights into all cloudtrail audit events associated with EC2 instances and specifically helps identify changes, errors, and user activities.
Use this dashboard to:
- Monitor the geo location for successful and failed events.
- Observed the event status and top error codes.
- Track distribution and top event types and trends.
- Monitor top IAM Users, Assumed Role Users, and User agents.
- Monitor distribution of Successful and failed events with the list of latest events.
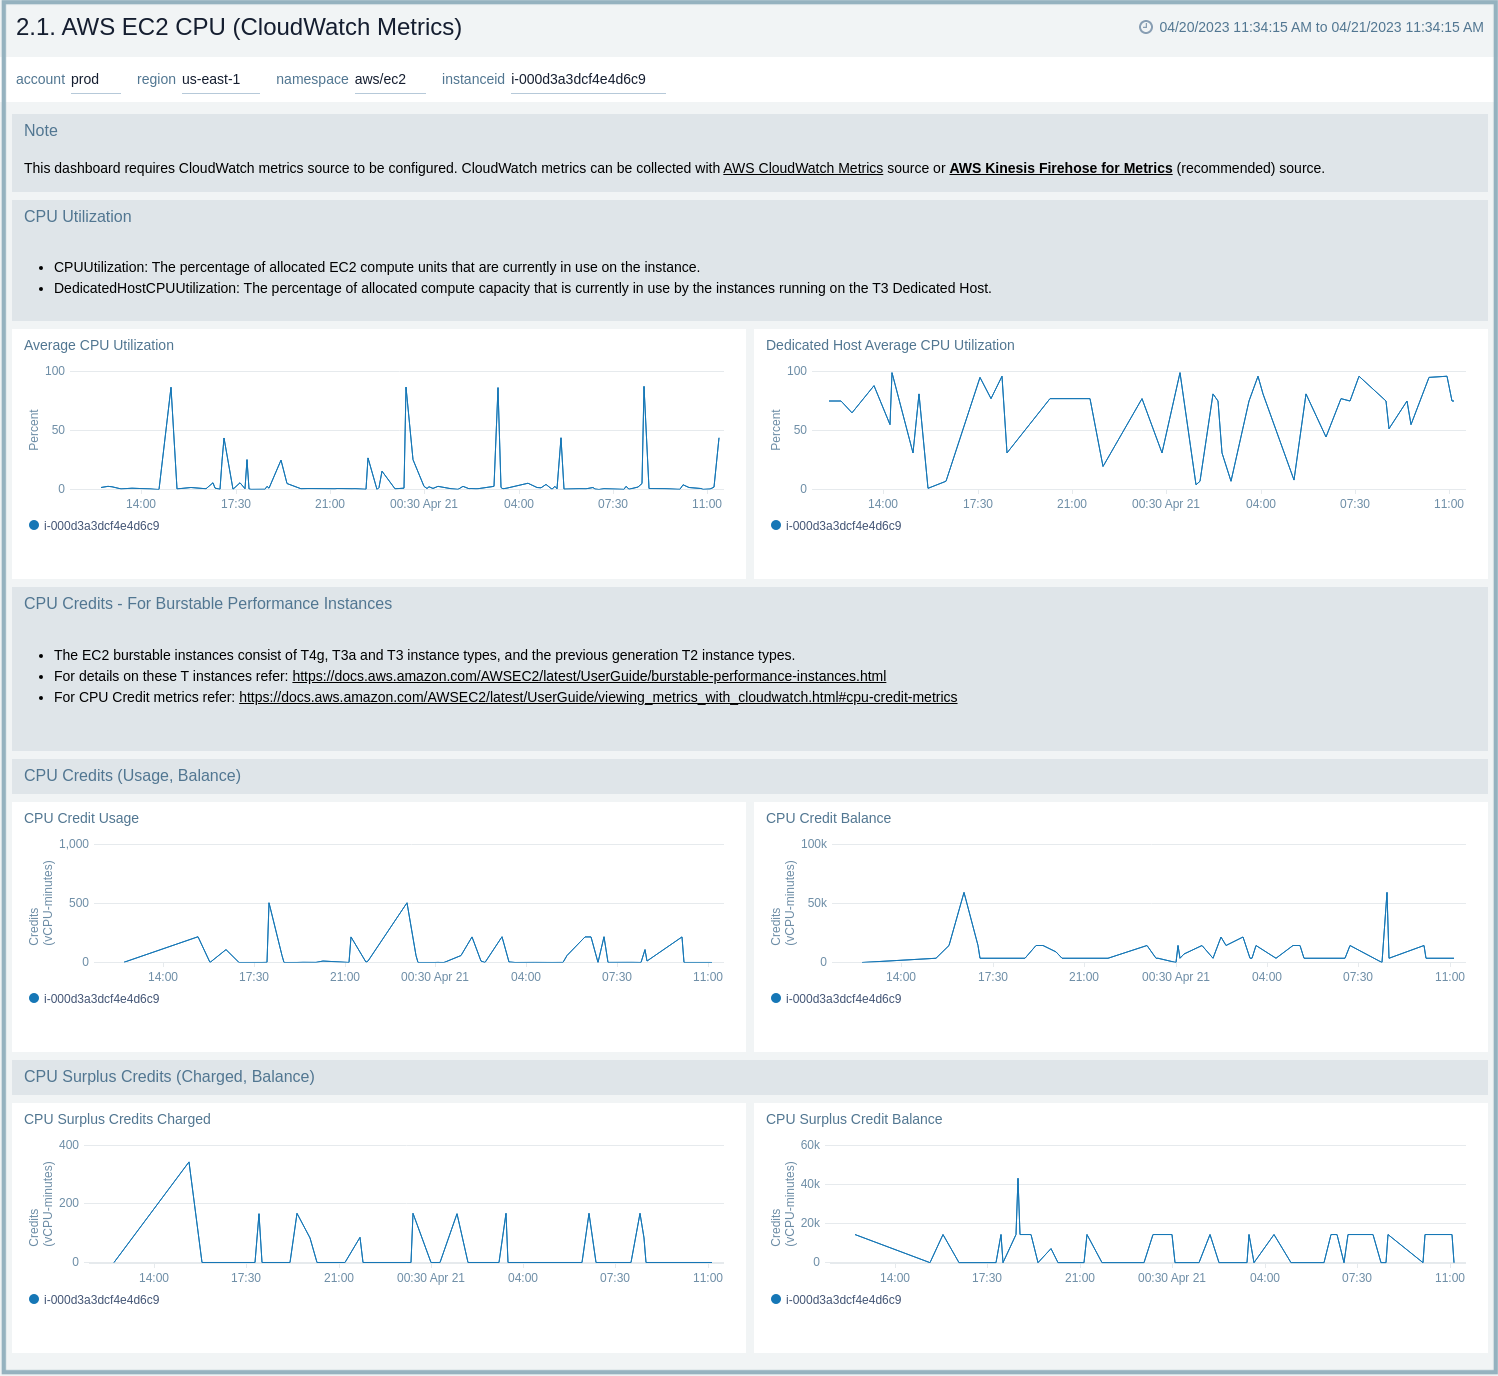
2.1. AWS EC2 CPU (CloudWatch Metrics)
The AWS EC2 CPU (CloudWatch Metrics) dashboard provides detailed information about EC2 CPU usage, like CPU utilization and CPU credits for burstable performance instances.
Use this dashboard to:
- Monitor Average CPU utilization over time for EC2.
- Observe CPU Credits metrics (Usage and Balance) over time.
- Identify CPU Surplus Credits (Charged and Balance) over time.
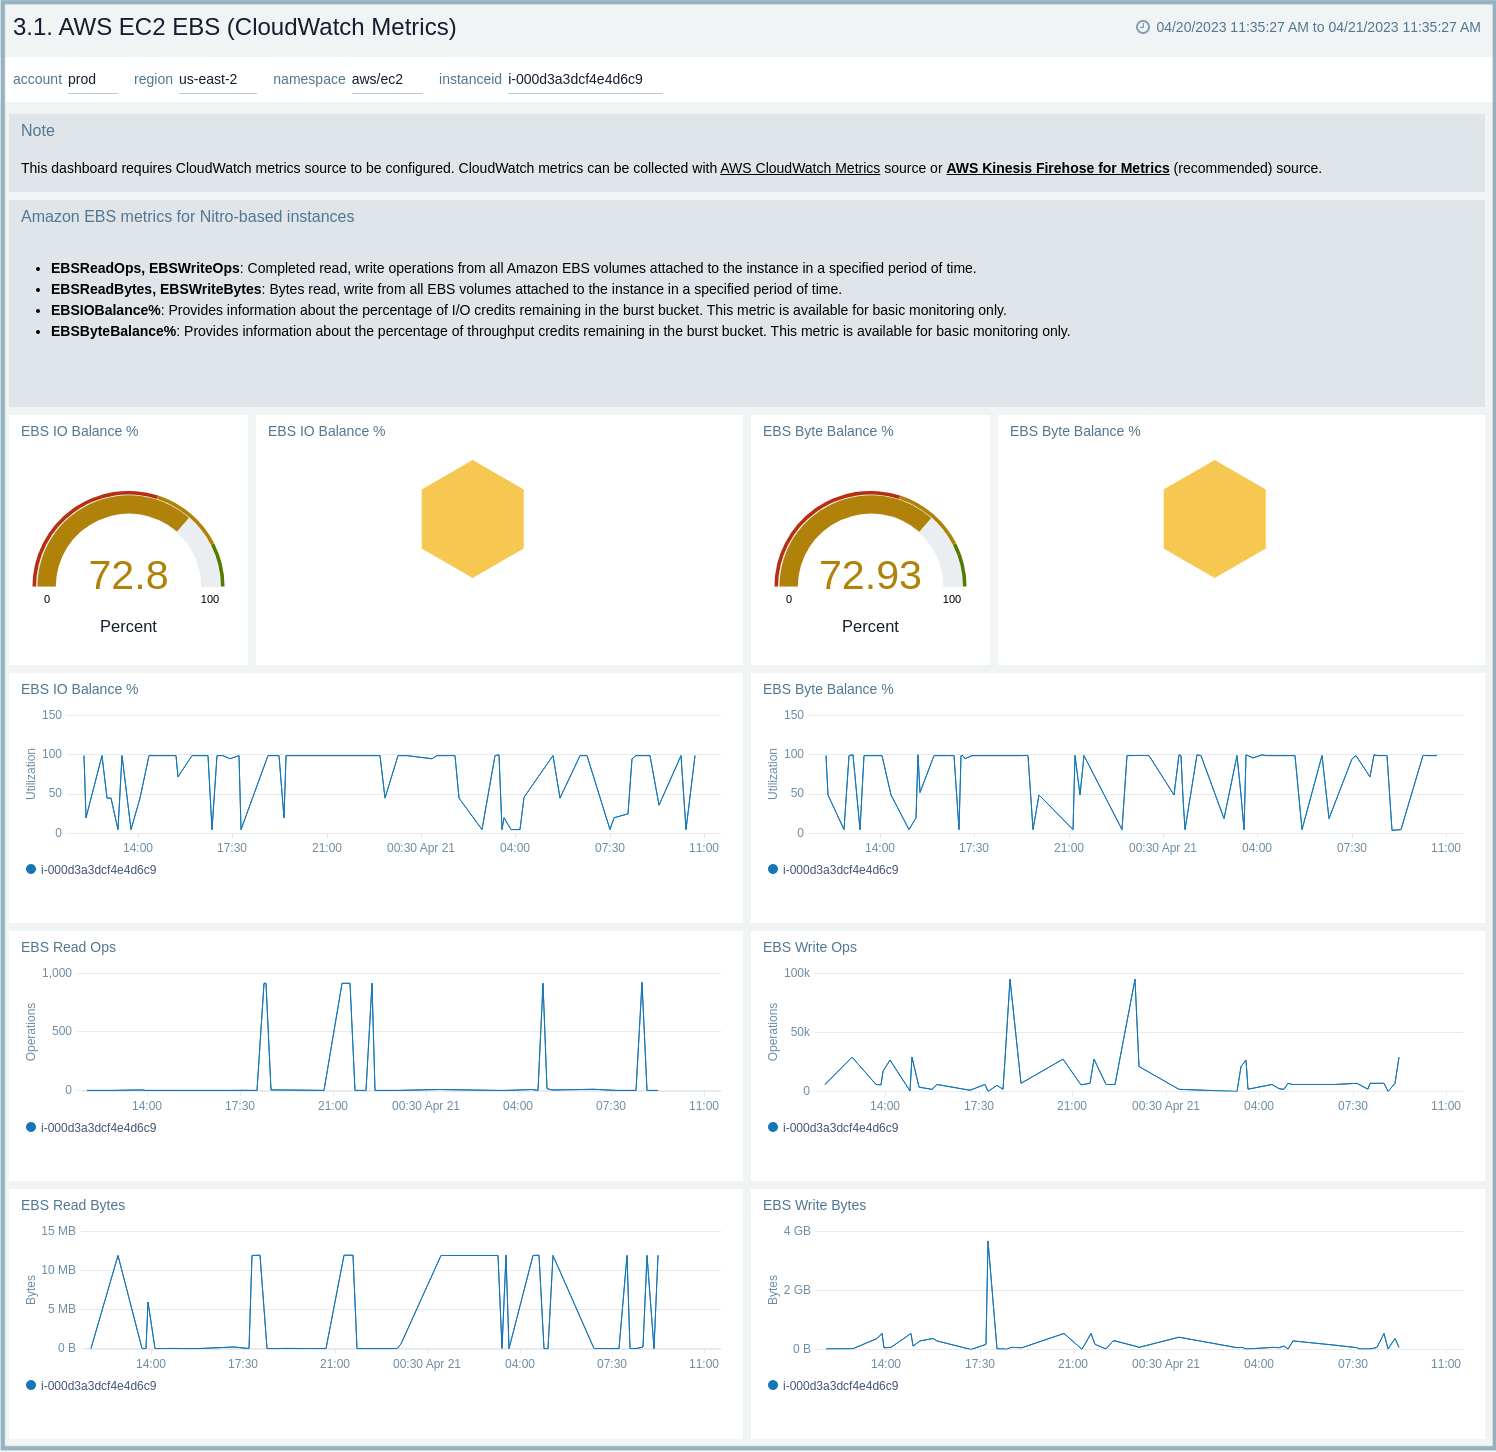
3.1. AWS EC2 EBS (CloudWatch Metrics)
The AWS EC2 EBS (CloudWatch Metrics) dashboard provides detailed information about EC2 EBS volumes for, Nitro-based instances based on EBS volumes read and write bytes, operations along with information on percentage of I/O and throughput credits remaining in the burst bucket.
Use this dashboard to:
- Monitor EBS volumes read and write bytes over time.
- Monitor EBS read and write ops over time.
- EBS IO balance and Byte Balance % metric over time for Ec2 instances.
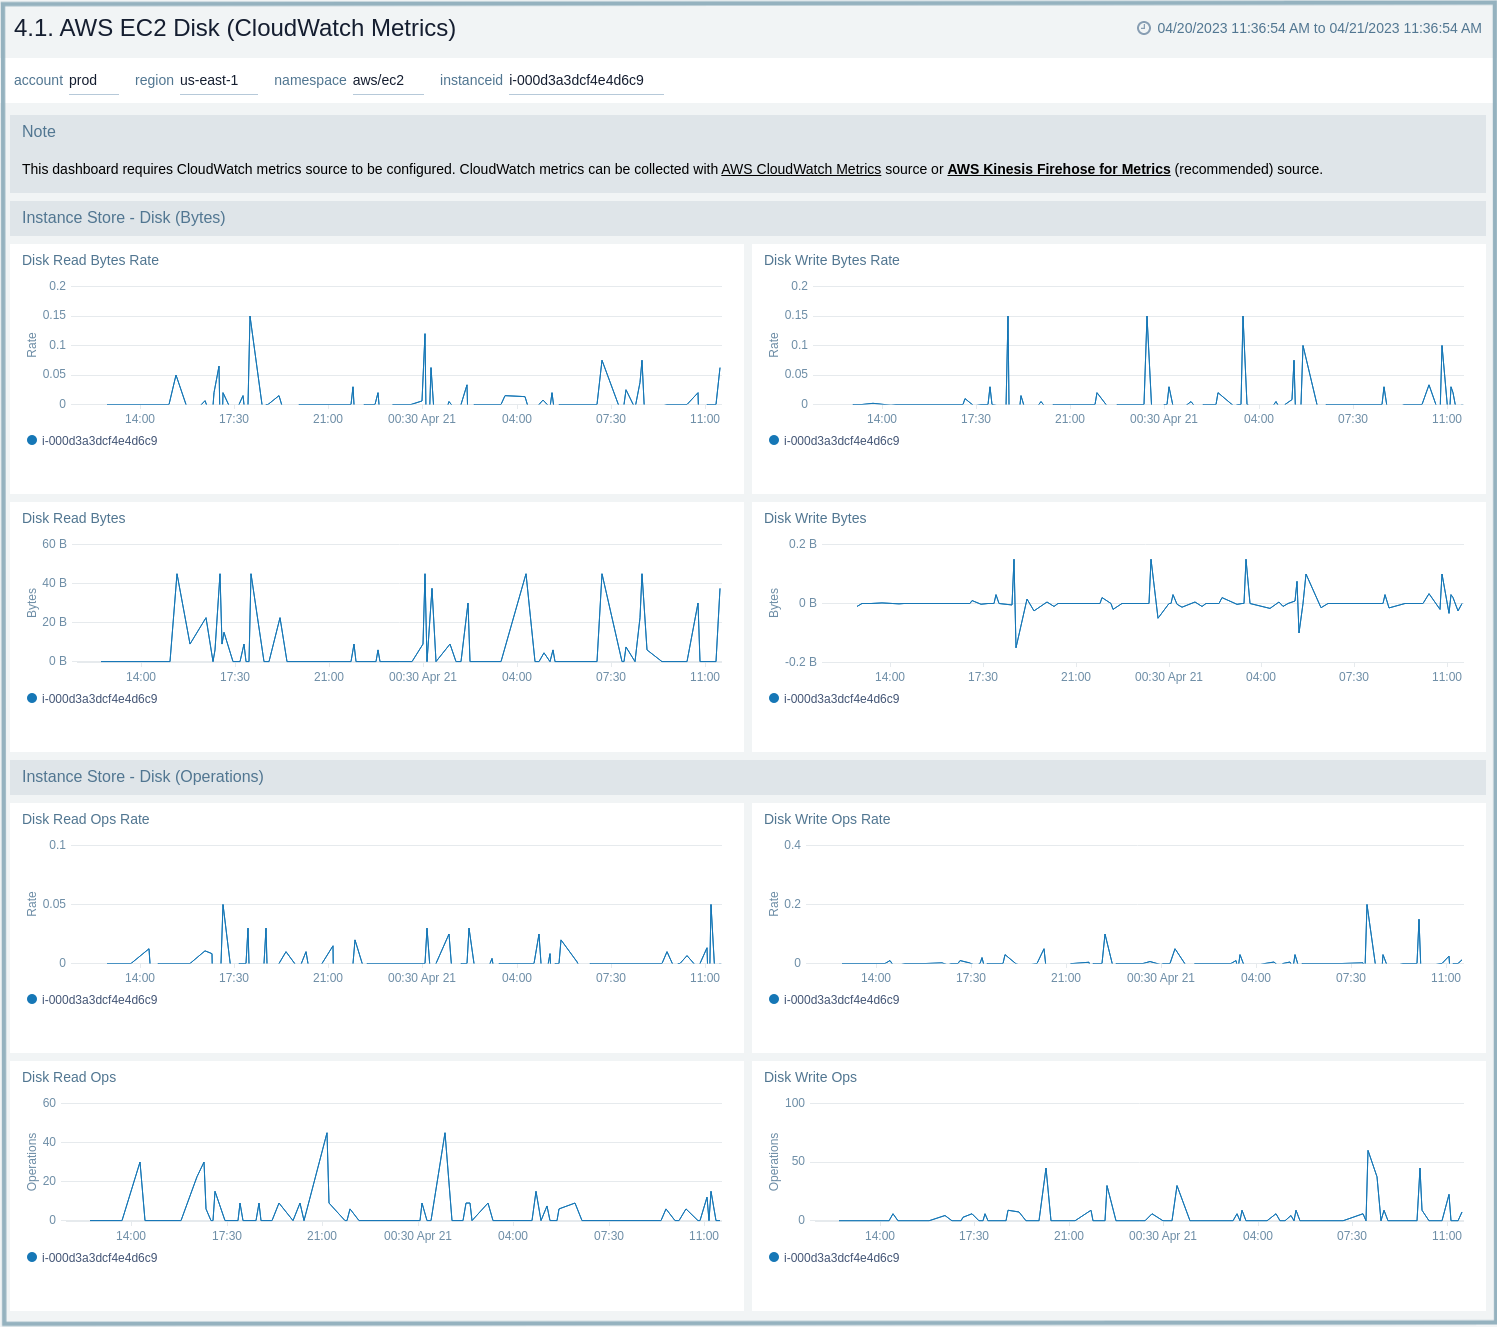
4.1. AWS EC2 Disk (CloudWatch Metrics)
The AWS EC2 Disk (CloudWatch Metrics) dashboard provides detailed information about a EC2 Instance Store Disk usage, based on disk read and write bytes, operations.
Use this dashboard to:
- Monitor instance store Disk metrics, such as disk read/write bytes and byte rate.
- Monitor instance store Disk metrics, such as disk read/write operations and operation rate.
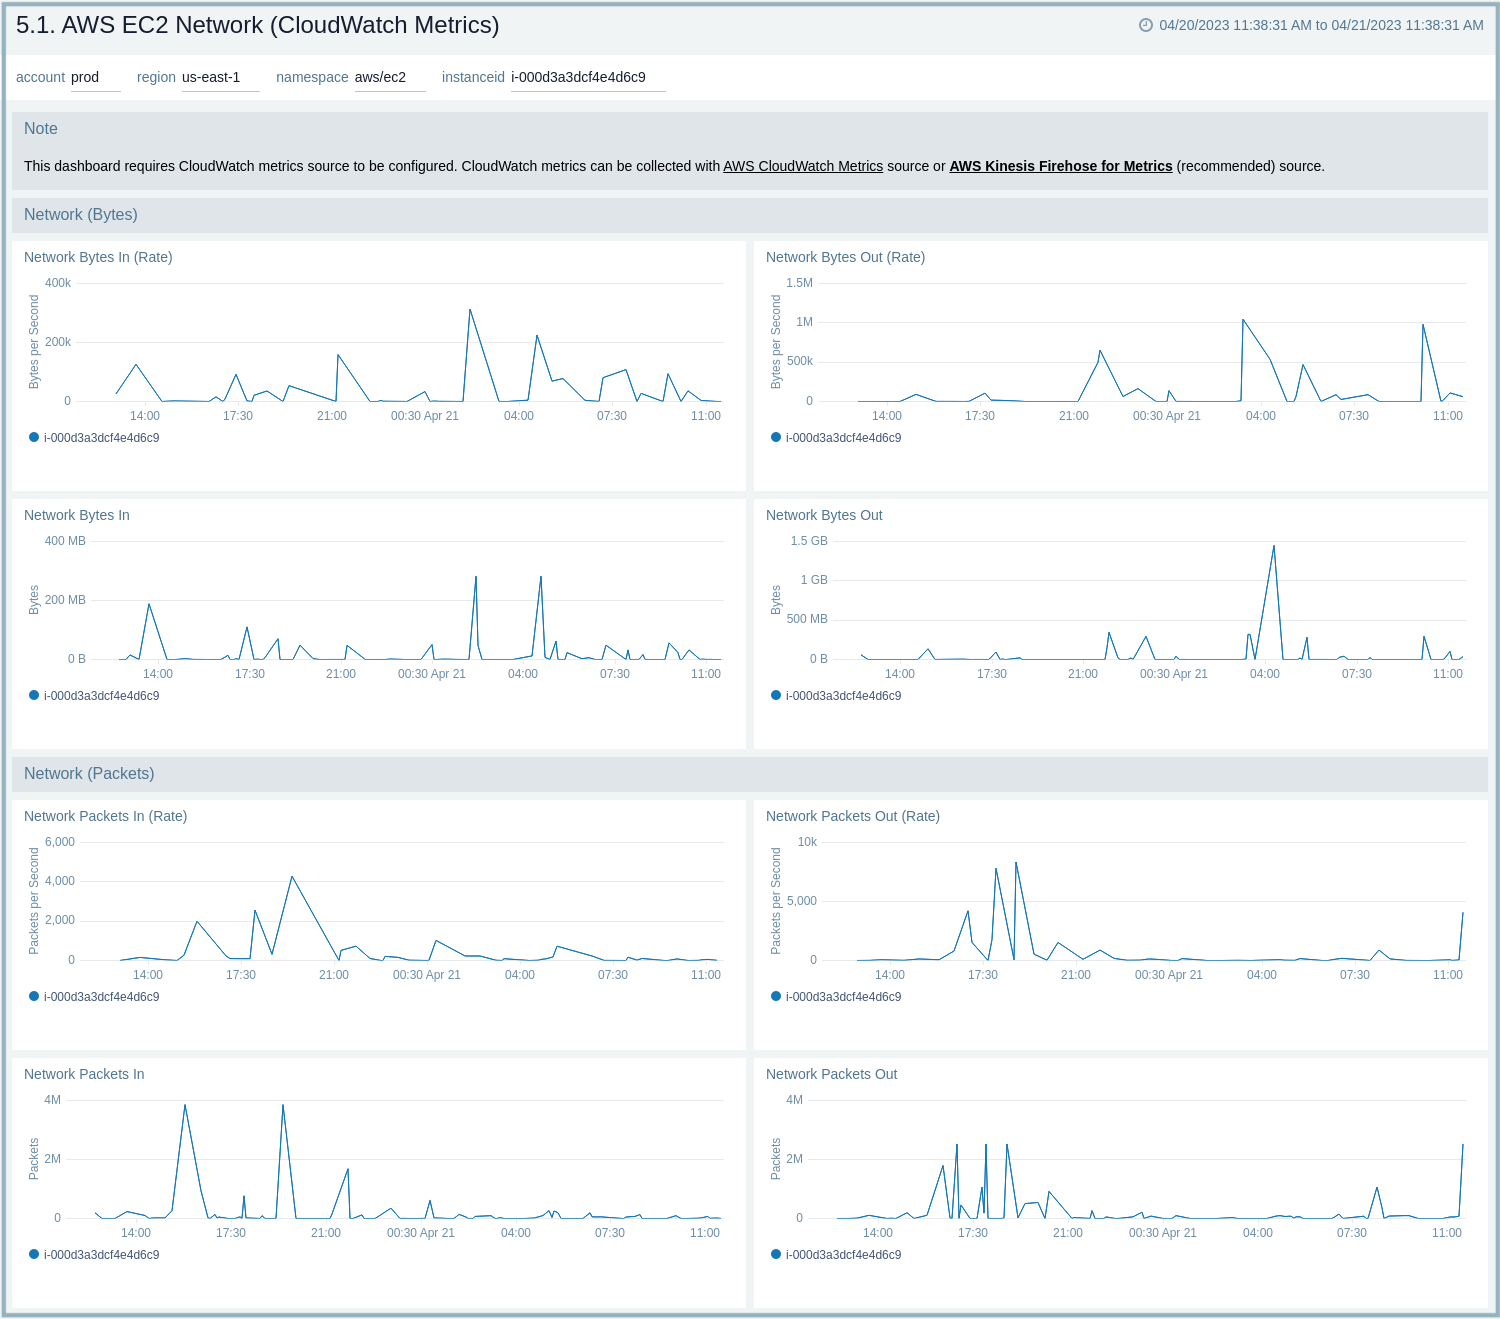
5.1. AWS EC2 Network (CloudWatch Metrics)
The AWS EC2 Network (CloudWatch Metrics) dashboard provides detailed information about EC2 Network activities based on In and out packets, bytes.
Use this dashboard to:
- Monitor imported network metrics such as bytes rate for input and output and bytes going in and out of EC2 instances.
- Observe network metrics for Ec2 for packet in/out, and rate of the packets.
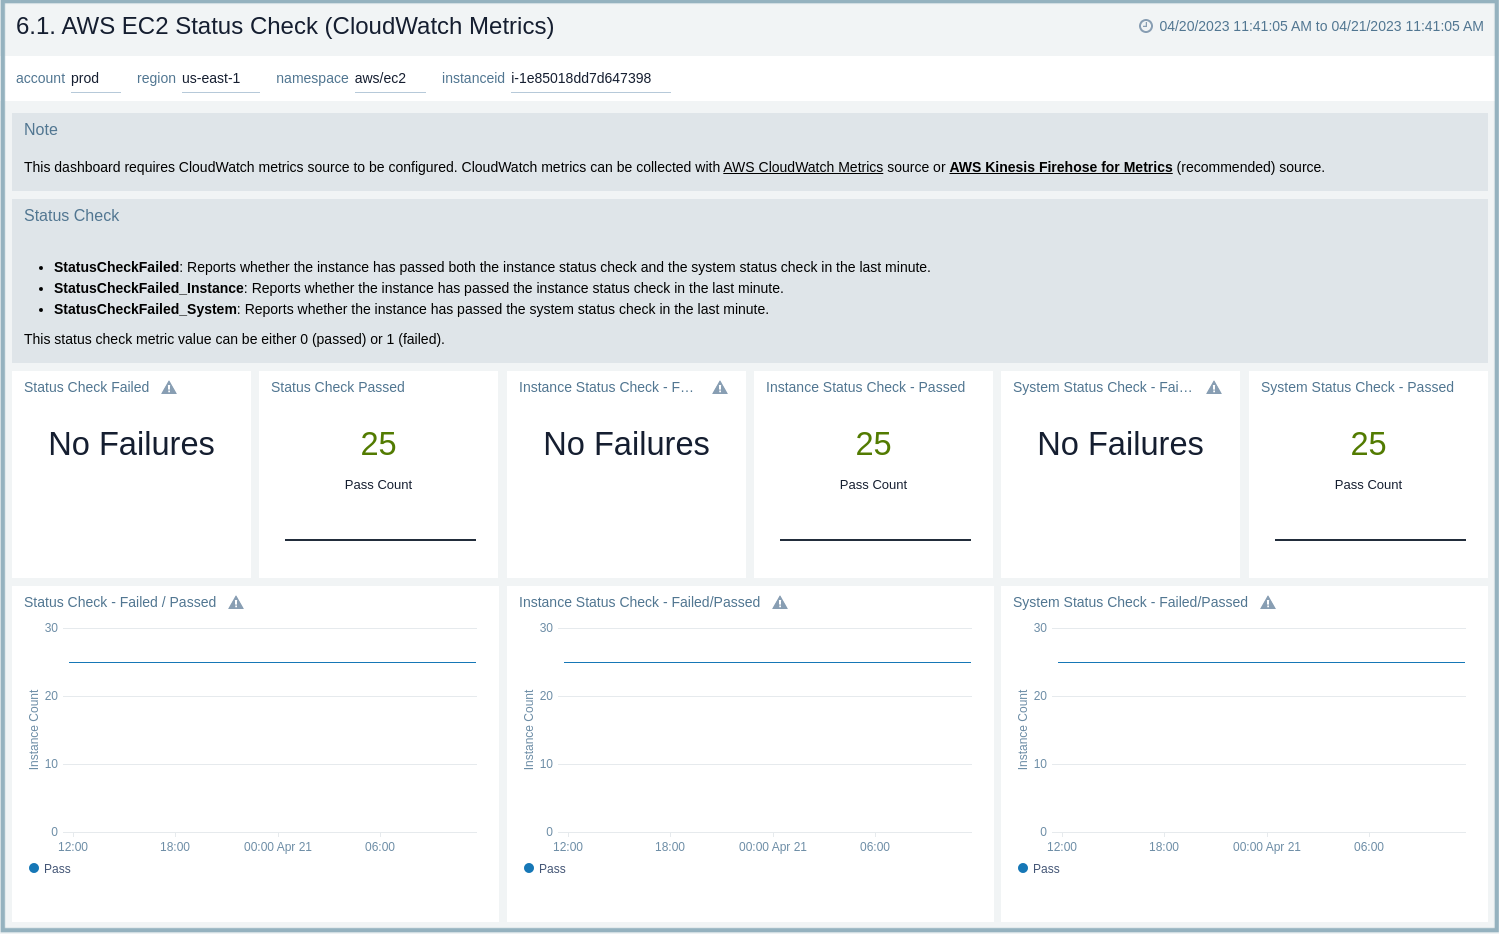
6.1 AWS EC2 Status Check (CloudWatch Metrics)
The AWS EC2 Status Check (CloudWatch Metrics) dashboard provides detailed information about EC2 instance health check status based on instance, system, and overall health status.
Use this dashboard to:
- Monitor status check for instances.
- Monitor if the instance has passed the status check in last minute.
- Monitor if instance has passed the system status check in last minute.