Netskope (Legacy)

This document contains our legacy collection method for non-Fedramp Sumo logic deployments. If you are not using the Sumo Logic FedRamp deployment, use the new Cloud-to-Cloud Integration for Netskope to create the source and use the same source category while installing the app.
The Netskope App provides visibility into the security posture of your applications and helps you determine the overall usage of software and SaaS applications.
Netskope is a Cloud Access Security Broker (CASB) hosted in the cloud. The Netskope product is primarily used for enforcing security policies for cloud-based resources, such as Box and Microsoft Office 365. Customers purchase a CASB to address cloud service risks, enforce security policies, and comply with regulations, even when cloud services are beyond their perimeter and out of their direct control.
Log types
The Netskope App provides a collector source for pulling all the events and alerts from Netskope in real-time via API calls and ingests them into the Sumo Logic platform through our Hosted collector.
For more information on Netskope, refer to the Netskope documentation.
Collect Logs for Netskope
The sections below are deprecated for non-FedRamp Sumo Logic deployments. If you're using the Sumo Logic FedRamp deployment, use the sections below to configure the collection for this app.
Collection Overview (DEPRECATED)
Sumo Logic provides a collector agent that pulls logs from Netskope with API calls. You can configure the list of events and alerts to be collected, but by default all events and alerts are collected.
The events and alerts are forwarded to the Sumo Logic HTTP endpoint in JSON format. The configuration from a yaml file, which is stored in the home directory, is used. By default the collection starts from last 7 days, but this setting is configurable.
The Netskope App has the following components:
- Application Usage: Insights into application usage; specifically by devices, users, users and traffic patterns.
- Security Alerts: Visibility into Netskope security alerts and violations and the ability to identify effects of a breach.
Step 1: Adding a Hosted Collector and HTTP Source (DEPRECATED)
This section demonstrates how to add a hosted Sumo Logic collector and HTTP Logs and Metrics source, to collect events for Netskope
Prerequisites
Before creating the HTTP source, identify the Sumo Logic Hosted Collector you want to use, or create a new Hosted Collector as described in the following task.
When you configure the HTTP Source, make sure to save the HTTP Source Address URL. You will need this to configure in configuration file.
To add a hosted collector and HTTP source, do the following:
- To create a new Sumo Logic Hosted Collector, perform the steps in Configure a Hosted Collector.
- Add an HTTP Logs and Metrics Source.
- In Advanced Options for Logs, under Timestamp Format, click Specify a format and enter the following:
- Specify Format as
epoch - Specify Timestamp locator as
\"timestamp\": (.*),
- Specify Format as
- Click Add.
Step 2: Getting a token from the Netskope Portal (DEPRECATED)
Netskope REST APIs use an auth token to make authorized calls to the API. This section demonstrates how to obtain a token from the Netskope user interface (UI).
To obtain a Netskope auth token, do the following:
- Login to Netskope as the Tenant Admin.
- Go to the API portion of the Netskope, Settings > Tools > Rest API.
- Copy the existing token to your clipboard, or you can generate a new token and copy that token.
Configuring a Sumo Logic Netskope collector (DEPRECATED)
This section provides walkthrough instructions that demonstrate how to configure a Sumo Logic Netskope collector. The sumologic netskope collector is compatible with Python 3.7 and Python 2.7. It has been tested on Ubuntu 18.04 LTS and Debian 4.9.130.
To create a Sumo Logic Netskope collector, do the following:
- Login to a Linux machine.
- Install the collector using the following command. If pip (python package installer) is not installed on your system, see the pip docs for instructions on how to download and install pip.
pip install sumologic-netskope-collector - Download the netskope.yaml configuration file and place in the home directory.
- Edit the netskope.yaml file in the following way:
- Replace
<SUMO HTTP SOURCE ENDPOINT>with the Sumo Logic HTTPS Source endpoint you created in Step 1. - Replace
<Netskope API Token>with the Netskope API token you created in Step 2. - Replace
<Netskope Domain>with your Netskope domain name.
Example of an edited netskope.yaml file:
Netskope:
 TOKEN: "ExampleTokenGxrtwdshciB7gHR7efDQbZPW"
 NETSKOPE_EVENT_ENDPOINT: https://example.goskope.com/api/v1/events
 NETSKOPE_ALERT_ENDPOINT: https://example.goskope.com/api/v1/alerts
SumoLogic:
SUMO_ENDPOINT: "https://collectors.sumologic.com/receiver/v1/http/ZaVnC4dhaxxExampleEndpointxxx===" - Replace
- Create a cron job to run the collector every 5 minutes, (use the crontab -e option) and add the following line:
*/5 * * * *  /usr/bin/python -m \
sumonetskopecollector.netskope > /dev/null 2>&1
Updating the Sumo Logic Netskope collector (DEPRECATED)
Sumo Logic periodically makes changes to the collector. To make sure your collector is up-to-date, perform the following tasks on each machine running the collector:
- Check the latest version of the Netskope collector on this page: https://pypi.org/project/sumologic-netskope-collector/#history
- Check the version of the collector you have installed by running the following command:
pip show sumologic-netskope-collector - If you are not running the latest collector, do the following:
- Disable your cron job.
- Stop all existing collector processes.
- Run the following command to upgrade your collector:
pip install sumologic-netskope-collector --upgrade- Enable the cron job.
Advanced Configuration (DEPRECATED)
The following table explains the configuration file parameters and their usage.
| Parameter | Usage |
| EVENT_TYPES | List of events to fetch from Netskope:
|
| ALERT_TYPES | List of alerts to fetch from Netskope:
|
| BACKFILL_DAYS | Number of days before the event collection will start. If the value is 1, then events are fetched from yesterday to today. |
| PAGINATION_LIMIT | Number of events to fetch in a single API call |
| LOG_FORMAT | Log format used by the python logging module to write logs in a file |
| ENABLE_LOGFILE | Set to TRUE to write all logs and errors to a log file |
| ENABLE_CONSOLE_LOG | Enables printing logs in a console |
| LOG_FILEPATH | Path of the log file used when ENABLE_LOGFILE is set to TRUE |
| NUM_WORKERS | Number of threads to spawn for API calls |
| MAX_RETRY | Number of retries to attempt in case of request failure |
| BACKOFF_FACTOR | A backoff factor to apply between attempts after the second try. If the backoff_factor is 0.1, then sleep() will sleep for [0.0s, 0.2s, 0.4s, ...] between retries. |
| TIMEOUT | Request time out used by the requests library |
| TOKEN | API Token used for API calls authentication |
| SUMO_ENDPOINT | HTTP source endpoint url created in Sumo Logic |
Sample log message
Click to expand
{
           "dstip": "74.125.239.150",
           "dst_location": "Mountain View",
           "app": "Google Gmail",
           "_insertion_epoch_timestamp": 1547391690,
           "site": "Google Gmail",
           "src_location": "Pomerol",
           "organization_unit": "",
           "object_type": "Mail",
           "id": 3764,
           "app_session_id": 4252577042,
           "category": "Webmail",
           "dst_region": "California",
           "userkey": "Tanja.Barton@kkrlogistics.com",
           "dst_country": "US",
           "src_zipcode": "33500",
           "ur_normalized": "tanja.barton@kkrlogistics.com",
           "type": "nspolicy",
           "object": "Welcome Novak Dimitrov",
           "srcip": "77.194.46.1",
           "dst_latitude": 37.405991,
           "timestamp": 1547400222,
           "src_region": "Gironde",
           "dst_longitude": -122.078514,
           "alert": "no",
           "to_user": "ns-india@microsoft.com, hrglobal@microsoft.com",
           "user": "Tanja.Barton@kkrlogistics.com",
           "from_user": "bloomberg@bloomberg.com",
           "device": "Windows PC",
           "org": "kkrlogistics.com",
           "src_country": "FR",
           "traffic_type": "CloudApp",
           "dst_zipcode": "N/A",
           "count": 2,
           "src_latitude": 44.9333,
           "url": "https://mail.google.com/",
           "page_id": 2641483218,
           "sv": "unknown",
           "ccl": "excellent",
           "cci": 92,
           "activity": "Send",
           "userip": "127.0.0.1",
           "src_longitude": -0.2,
           "_id": "5df996d5b66a9ea963e812ce",
           "os": "Windows 8",
           "browser": "Internet Explorer",
           "appcategory": "Webmail"
       }
   ]
}
Sample queries
The following query sample was is from the Total Sessions panel of the Application Overview Dashboard.
_sourceCategory="netskope_events" "no" "nspolicy"
| json "_id", "alert", "type", "srcip", "dstip", "appcategory", "app", "os", "user", "device",
"acked", "site", "timestamp", "ccl", "activity", "browser", "object", "object_type", "from_user",
"to_user", "app_session_id" as alert_id, is_alert, type, src_ip, dest_ip, appcategory, app, os,
user, device, acked, site, timestamp, ccl, activity, browser, object, object_type, from_user,
to_user, app_session_id  nodrop
| where is_alert="no" and type="nspolicy"
| count by app_session_id
| count
Installing the Netskope App
This section demonstrates how to install the Netskope App, and provides examples and descriptions for each of the dashboards. The Netskope App has the following components:
- Application Usage. Insights into application usage; specifically by devices, users, users and traffic patterns.
- Security Alerts. Visibility into Netskope security alerts and violations and the ability to identify effects of a breach.
To install the app:
- Select App Catalog.
- In the 🔎 Search Apps field, run a search for your desired app, then select it.
- Click Install App.
note
Sometimes this button says Add Integration.
- On the next configuration page, under Select Data Source for your App, complete the following fields:
- Data Source. Select one of the following options:
- Choose Source Category and select a source category from the list; or
- Choose Enter a Custom Data Filter, and enter a custom source category beginning with an underscore. For example,
_sourceCategory=MyCategory.
- Folder Name. You can retain the existing name or enter a custom name of your choice for the app.
- All Folders (optional). The default location is the Personal folder in your Library. If desired, you can choose a different location and/or click New Folder to add it to a new folder.
- Data Source. Select one of the following options:
- Click Next.
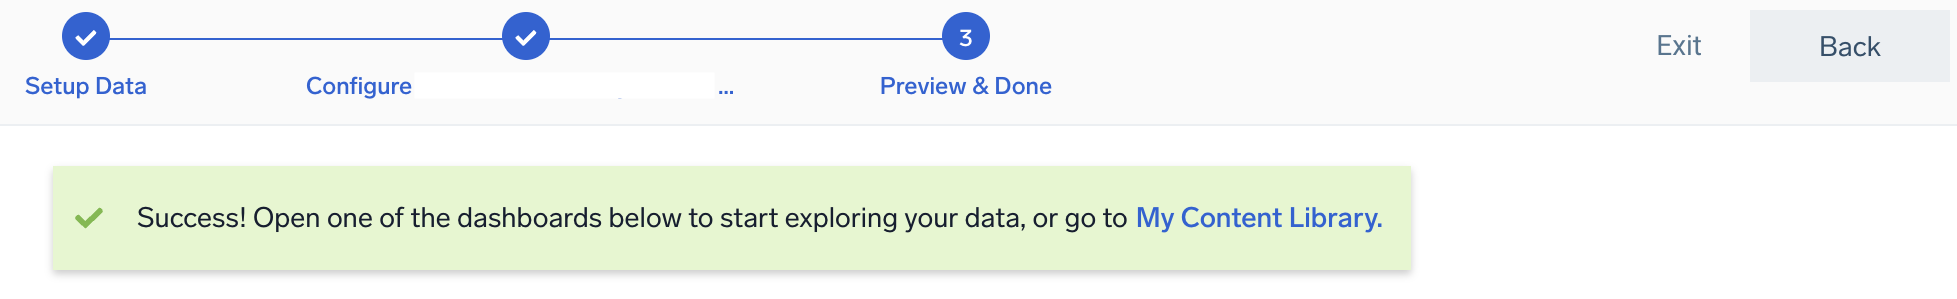
- Look for the dialog confirming that your app was installed successfully.
Post-installation
Once your app is installed, it will appear in your Personal folder or the folder that you specified. From here, you can share it with other users in your organization. Dashboard panels will automatically start to fill with data matching the time range query received since you created the panel. Results won't be available immediately, but within about 20 minutes, you'll see completed graphs and maps.
Viewing Netskope Dashboards
The Netskope dashboards are grouped by their component in the following two category folders:
- Application Usage
- Security Alerts
Dashboard filters
Each dashboard has a set of filters that you can apply to the entire dashboard, as shown in the following example. Click the funnel icon in the top dashboard menu bar to display a scrollable list of filters that are applied across the entire dashboard.
You can use filters to drill down and examine the data on a granular level.
Each panel has a set of filters that are applied to the results for that panel only, as shown in the following example. Click the funnel icon in the top panel menu bar to display a list of panel-specific filters.
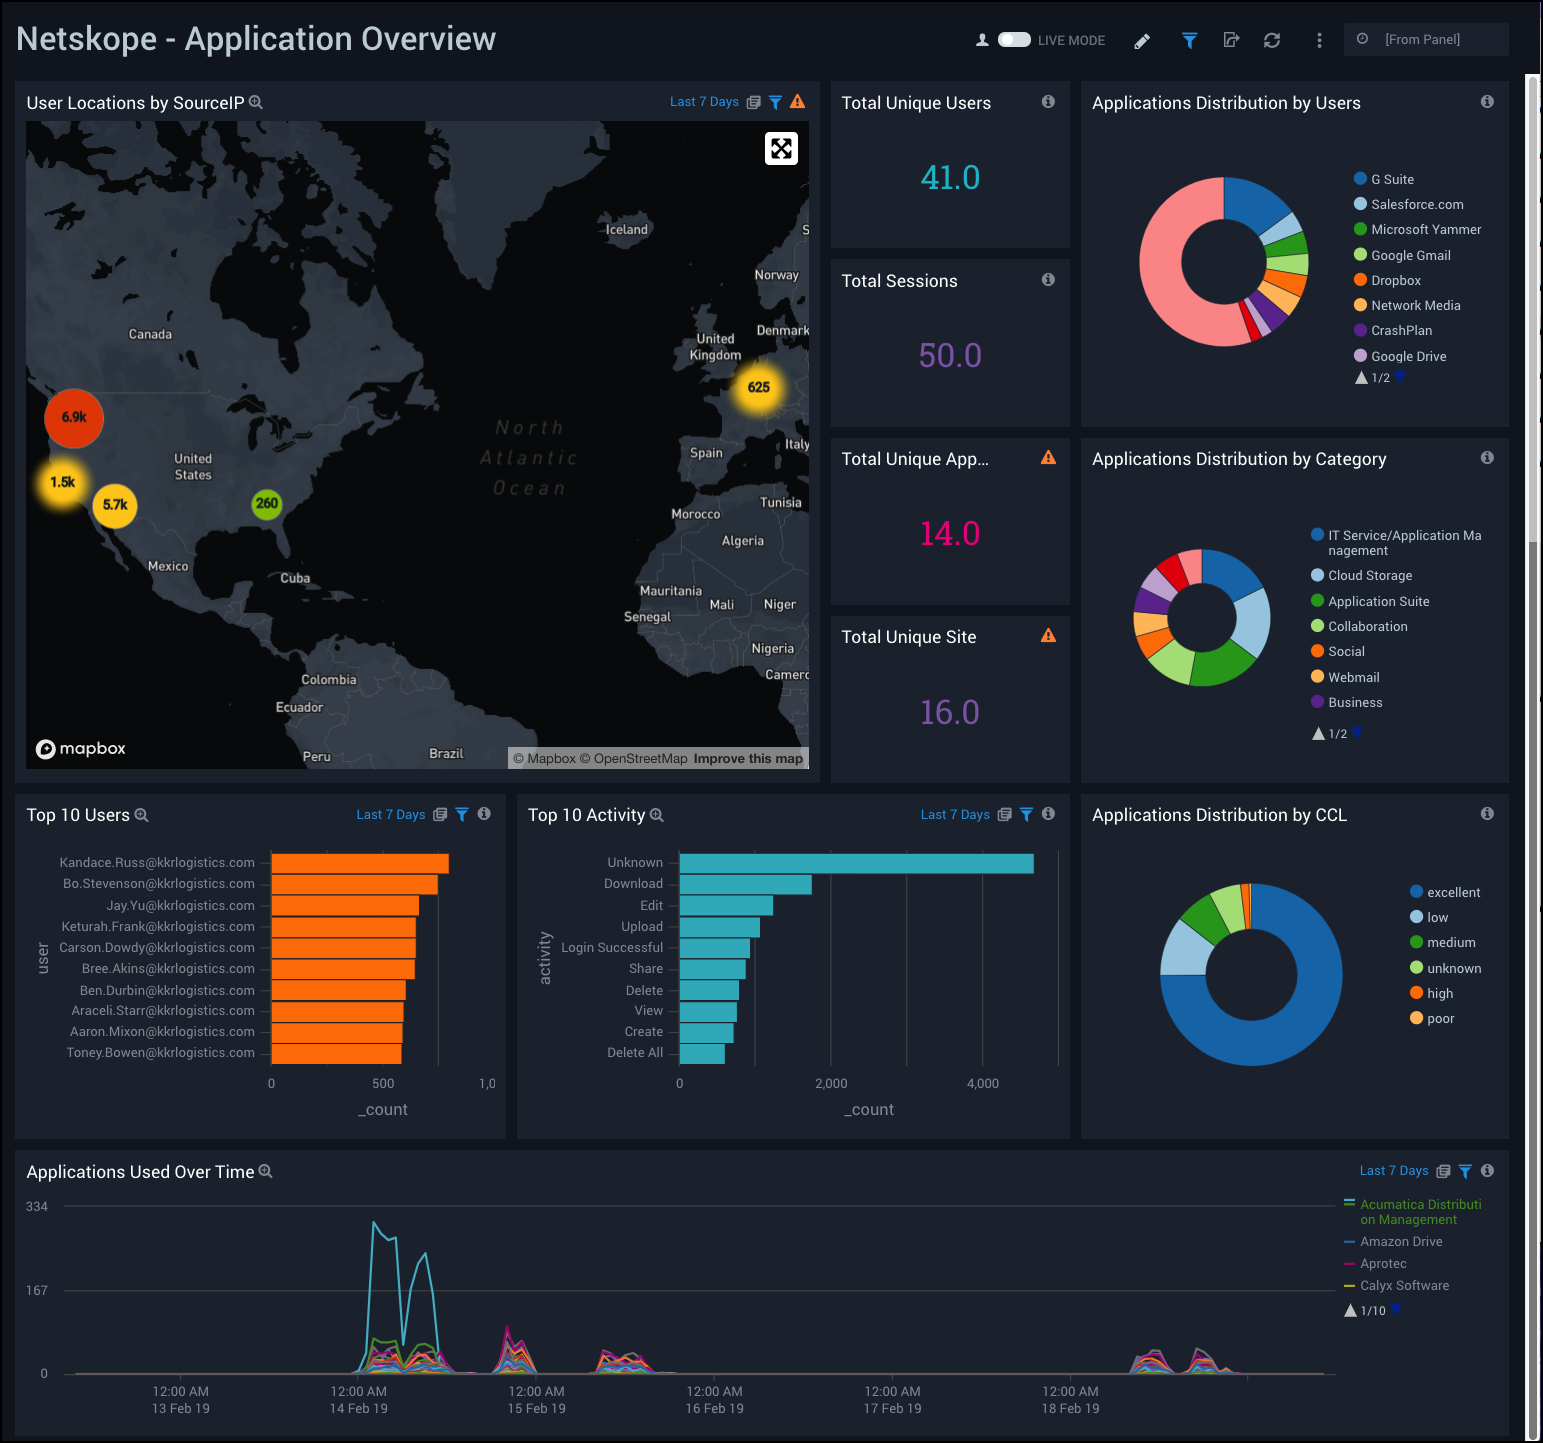
Application Overview
Netskope - Application Overview Dashboard provides a high-level view of user activity, user geographic location by source IP, total sessions, applications used, distribution and activity of applications, and application trends over time.
Use this dashboard to:
- Monitor number of users, sessions, and sites using the applications, and find out the popular apps by user and app category.
- Track spikes in application usage over time.
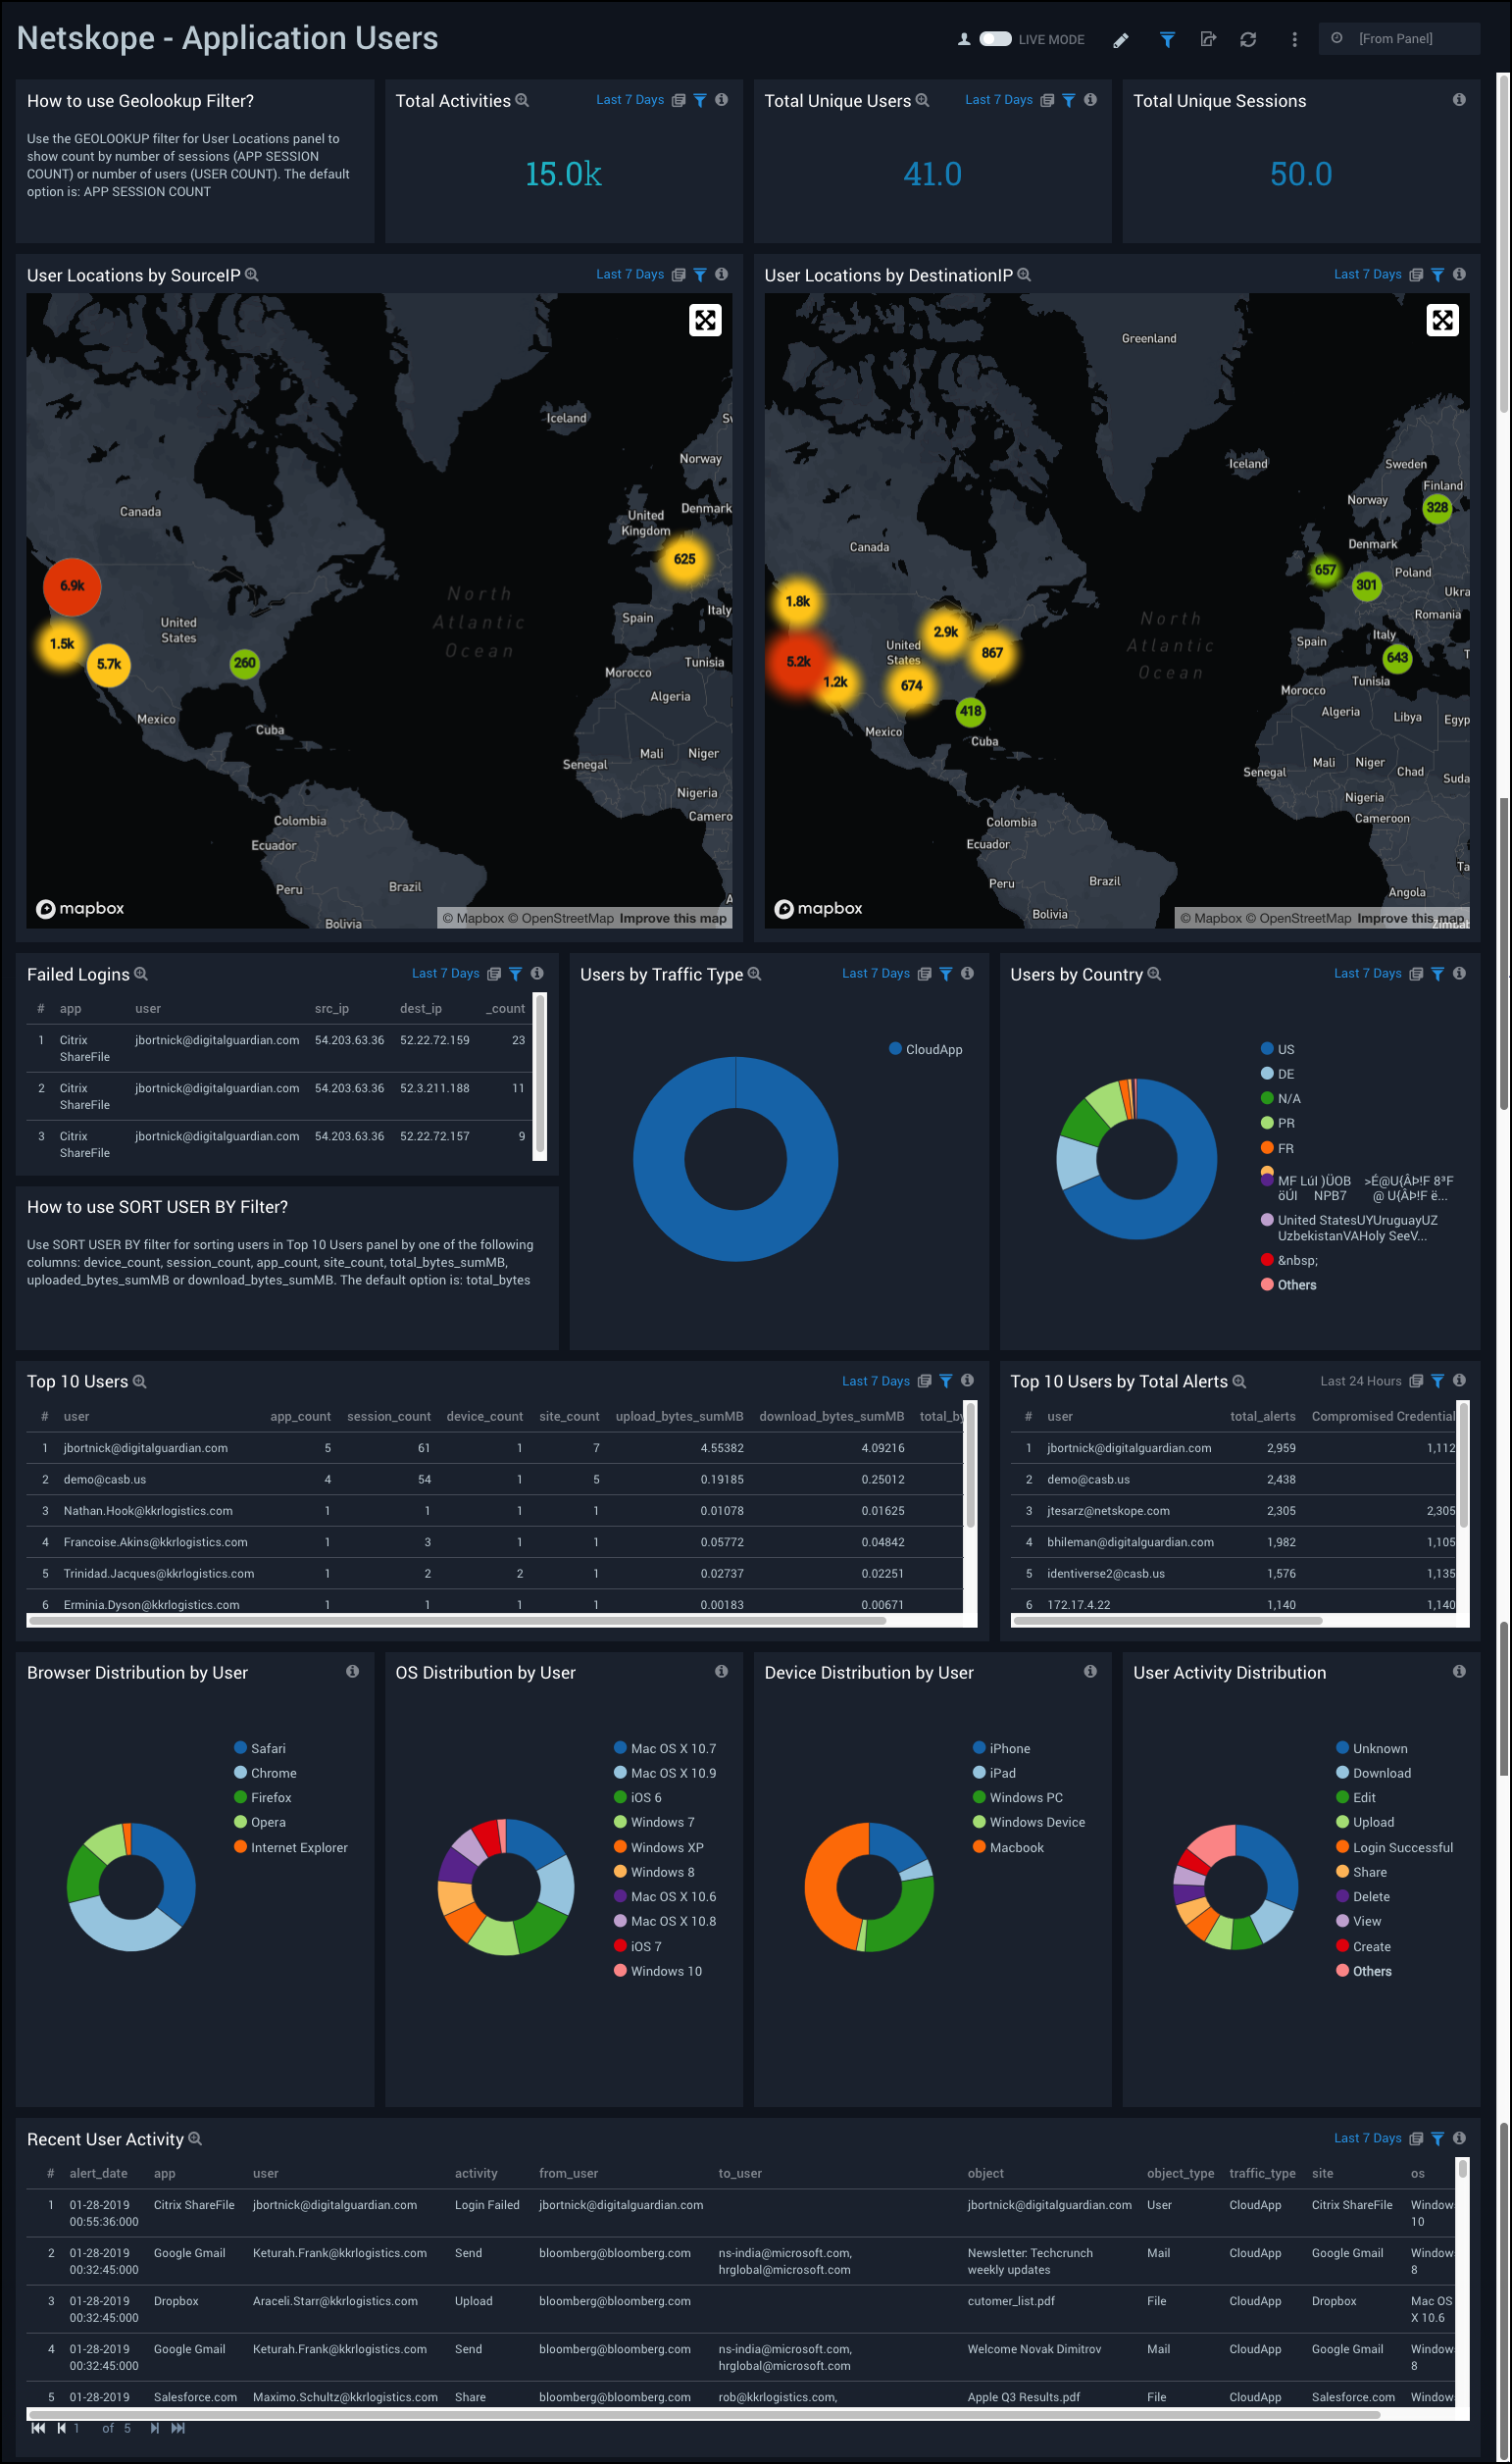
Application Users
Netskope - Application Users Dashboard provides a high-level view of application events, total sessions, user activity and geographic location by source IP and destination IP. This dashboard also shows visual breakdowns of distributions by operating system, browser, device, and user activity.
Use this dashboard to:
- Monitor recent user activities, track user locations, and find out the top users affected by alerts.
- Determine user classifications by browsers, devices, operating system (OS).
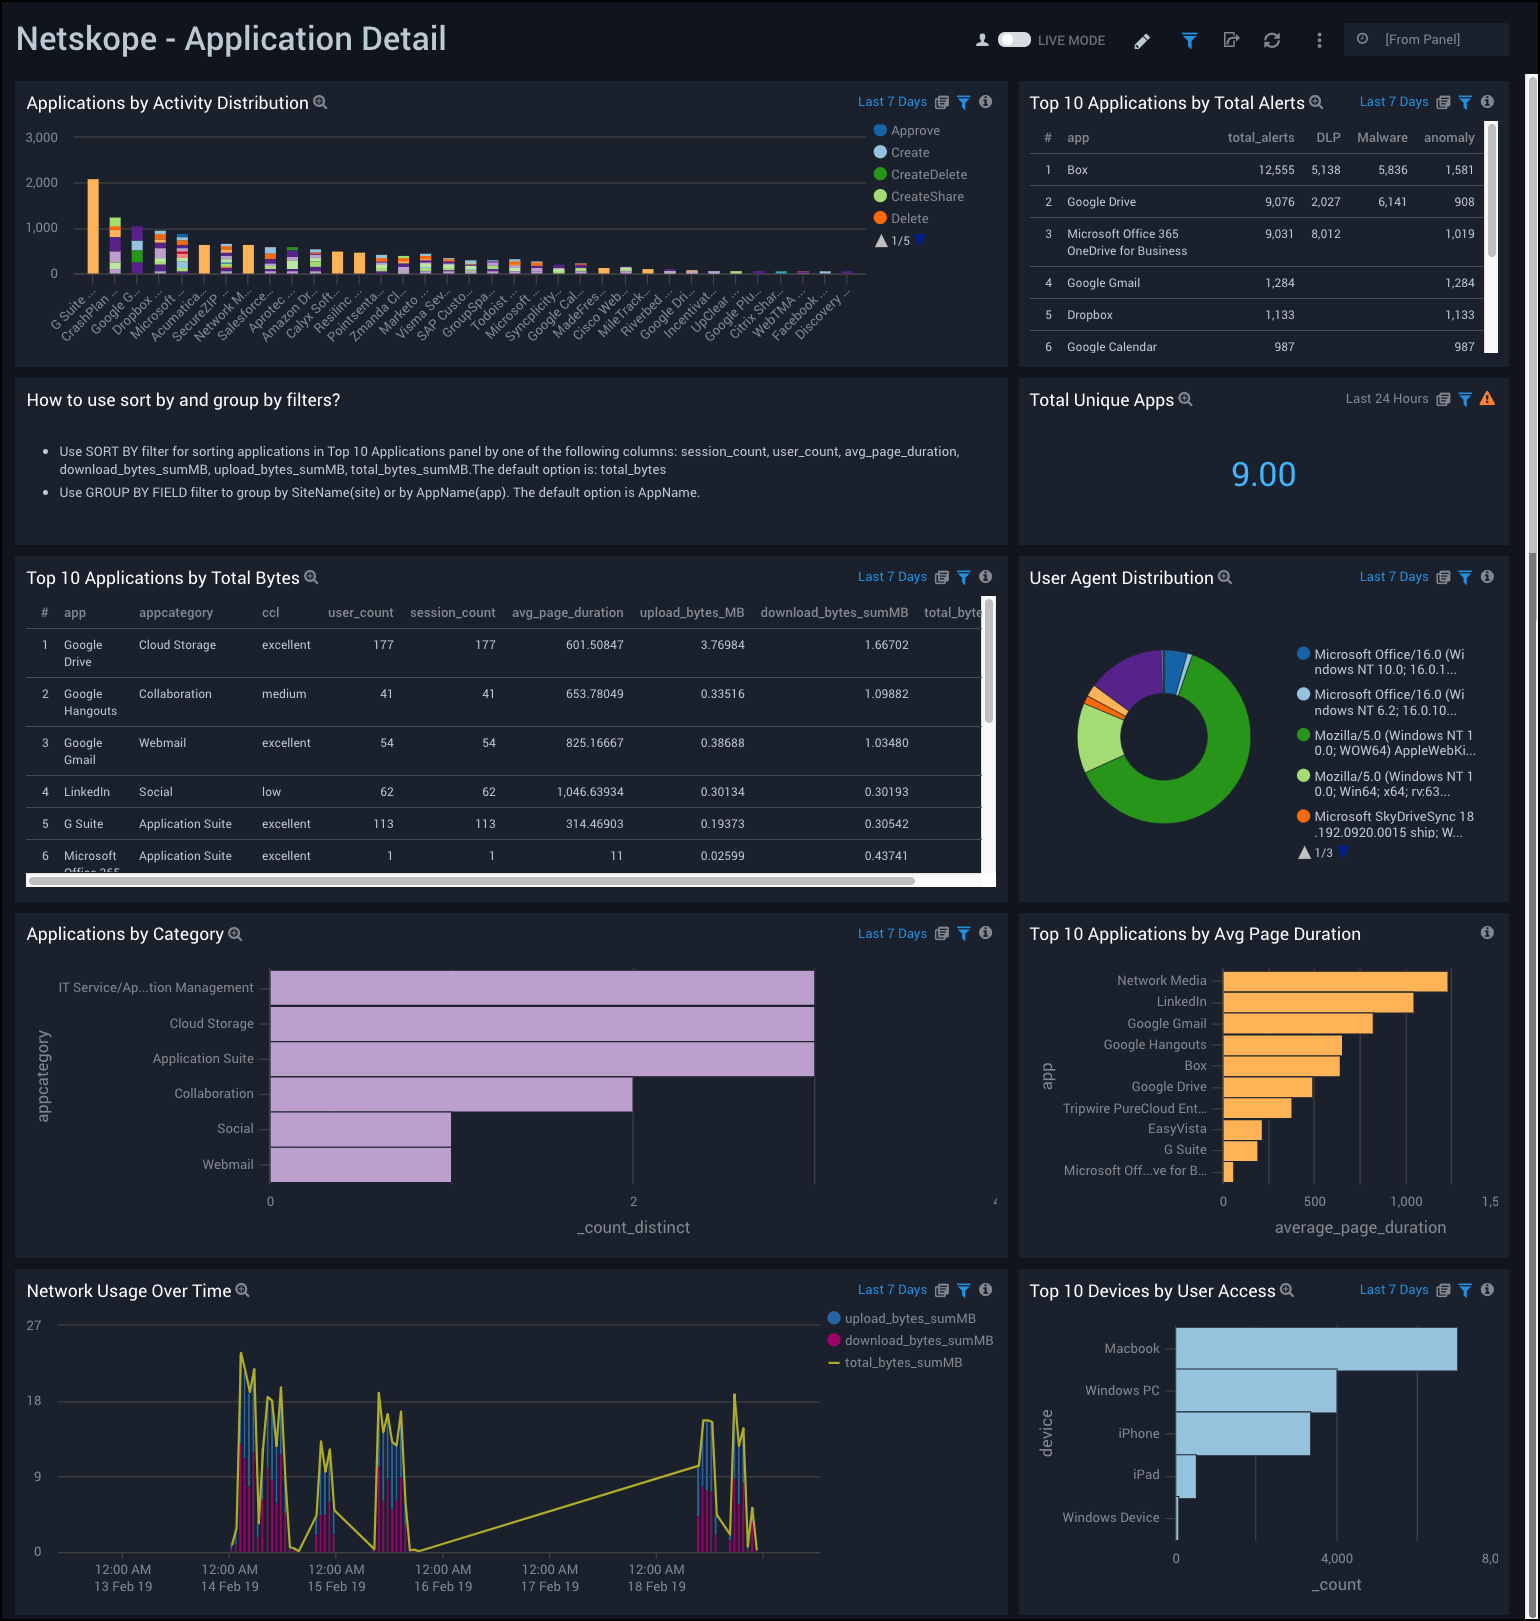
Application Details
Netskope - Application Details Dashboard provides a high-level view of data for unique applications used, as well as top applications by alerts, bytes, and average page duration. This dashboard also provides a visual breakdown of applications by category, devices by user access, and network usage over time.
Use this dashboard to:
- Monitor the top applications generating alerts.
- Find out detailed information about application usage in terms of page duration, user counts, upload and download bytes.
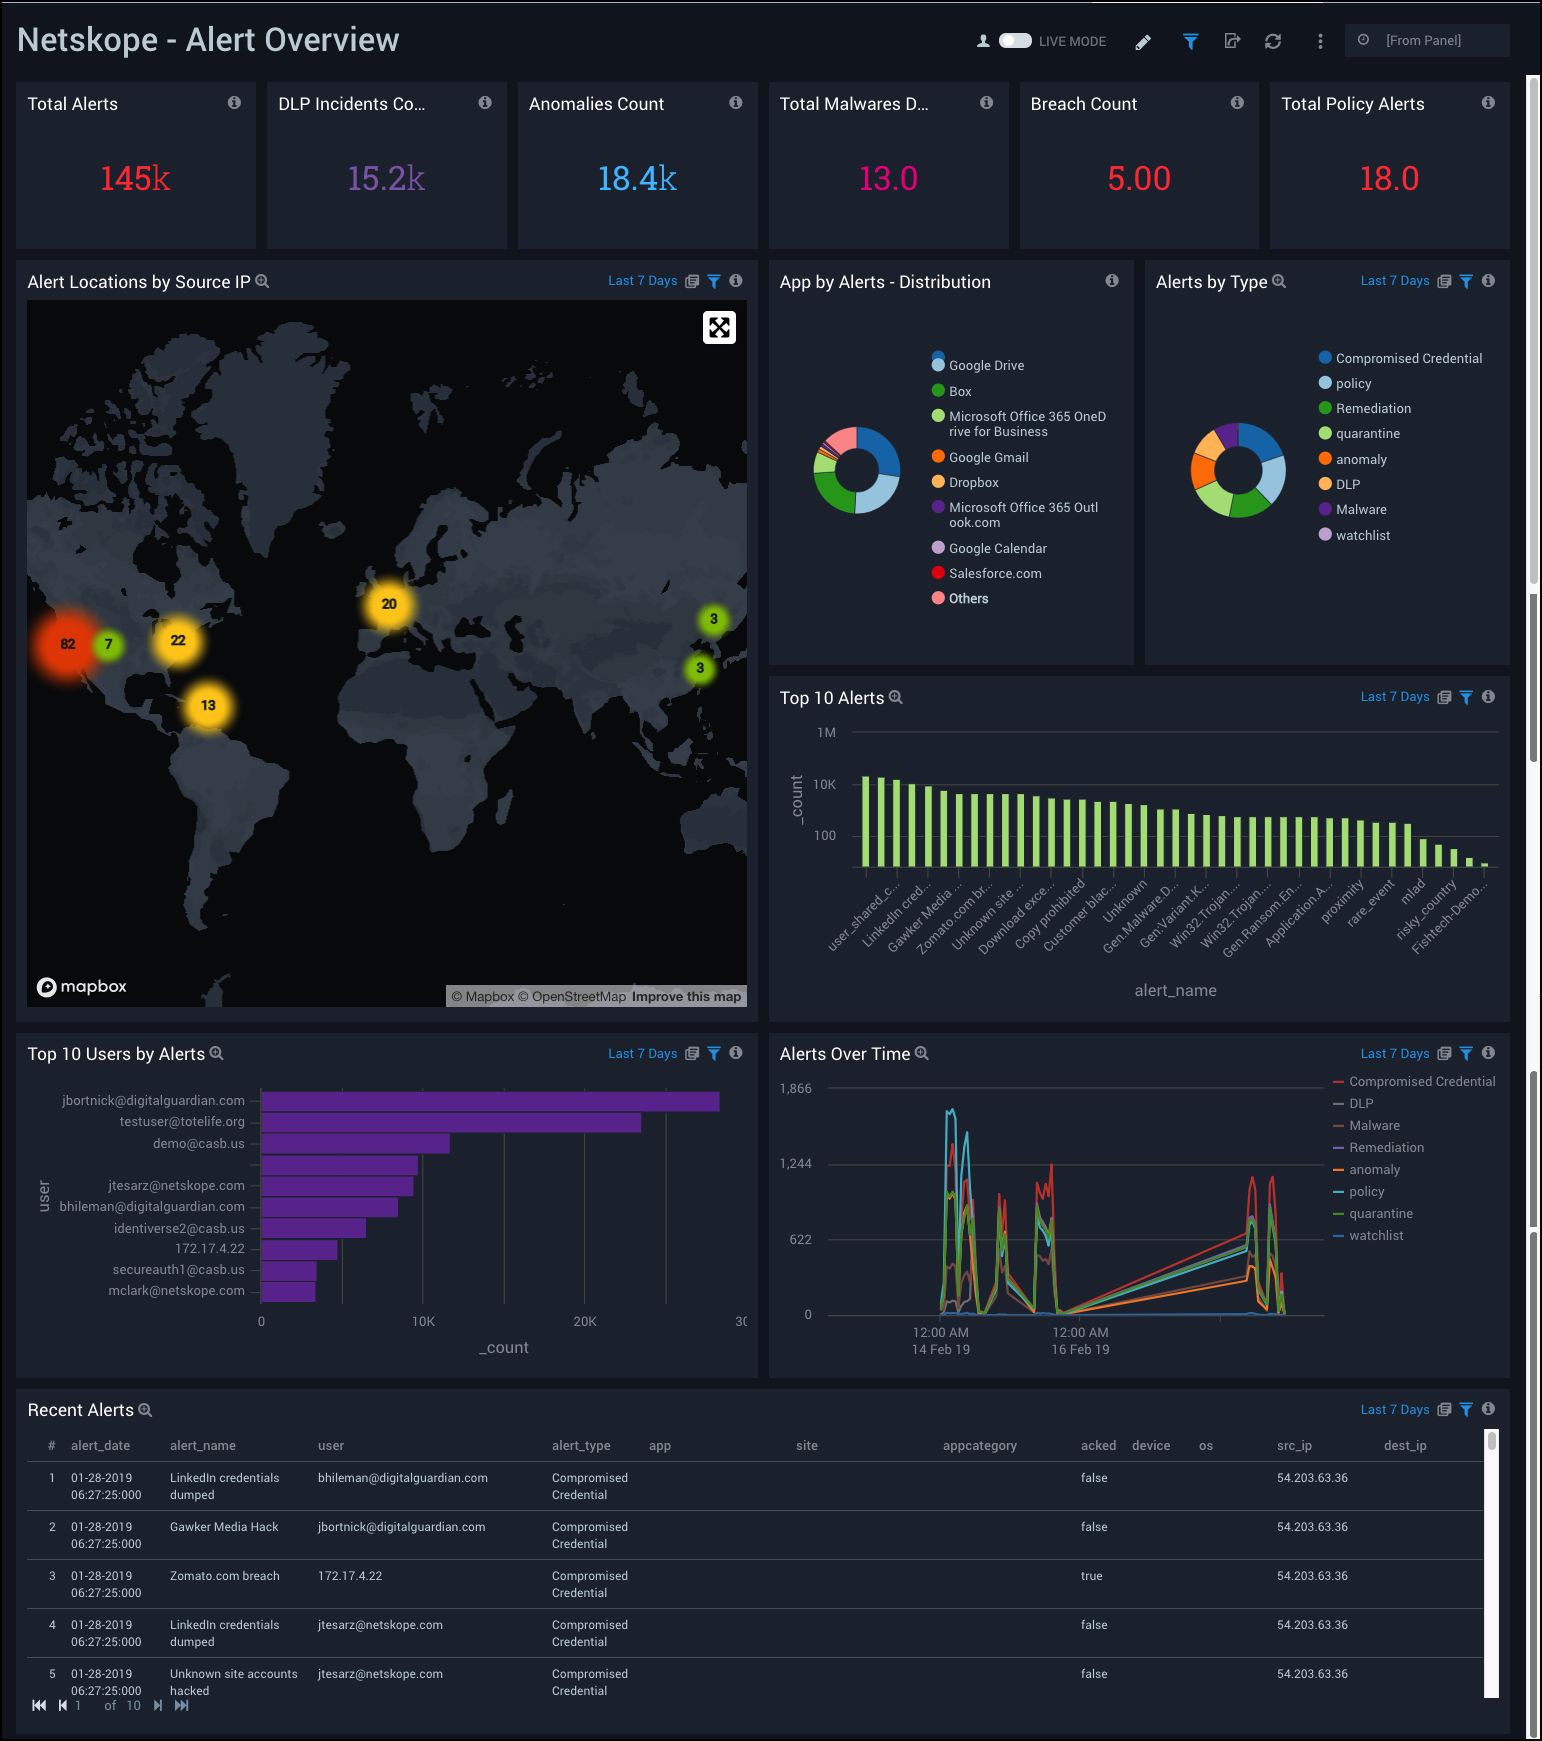
Alert Overview
Netskope - Alert Overview Dashboard provides a high-level view of your alert data by type, geographic location of source IPs, total and top alerts, alerts by user, recent alerts, and alert trends over time.
Use this dashboard to:
- Track users affected by alerts.
- Monitor abnormal spikes, alert locations, and recent alerts.
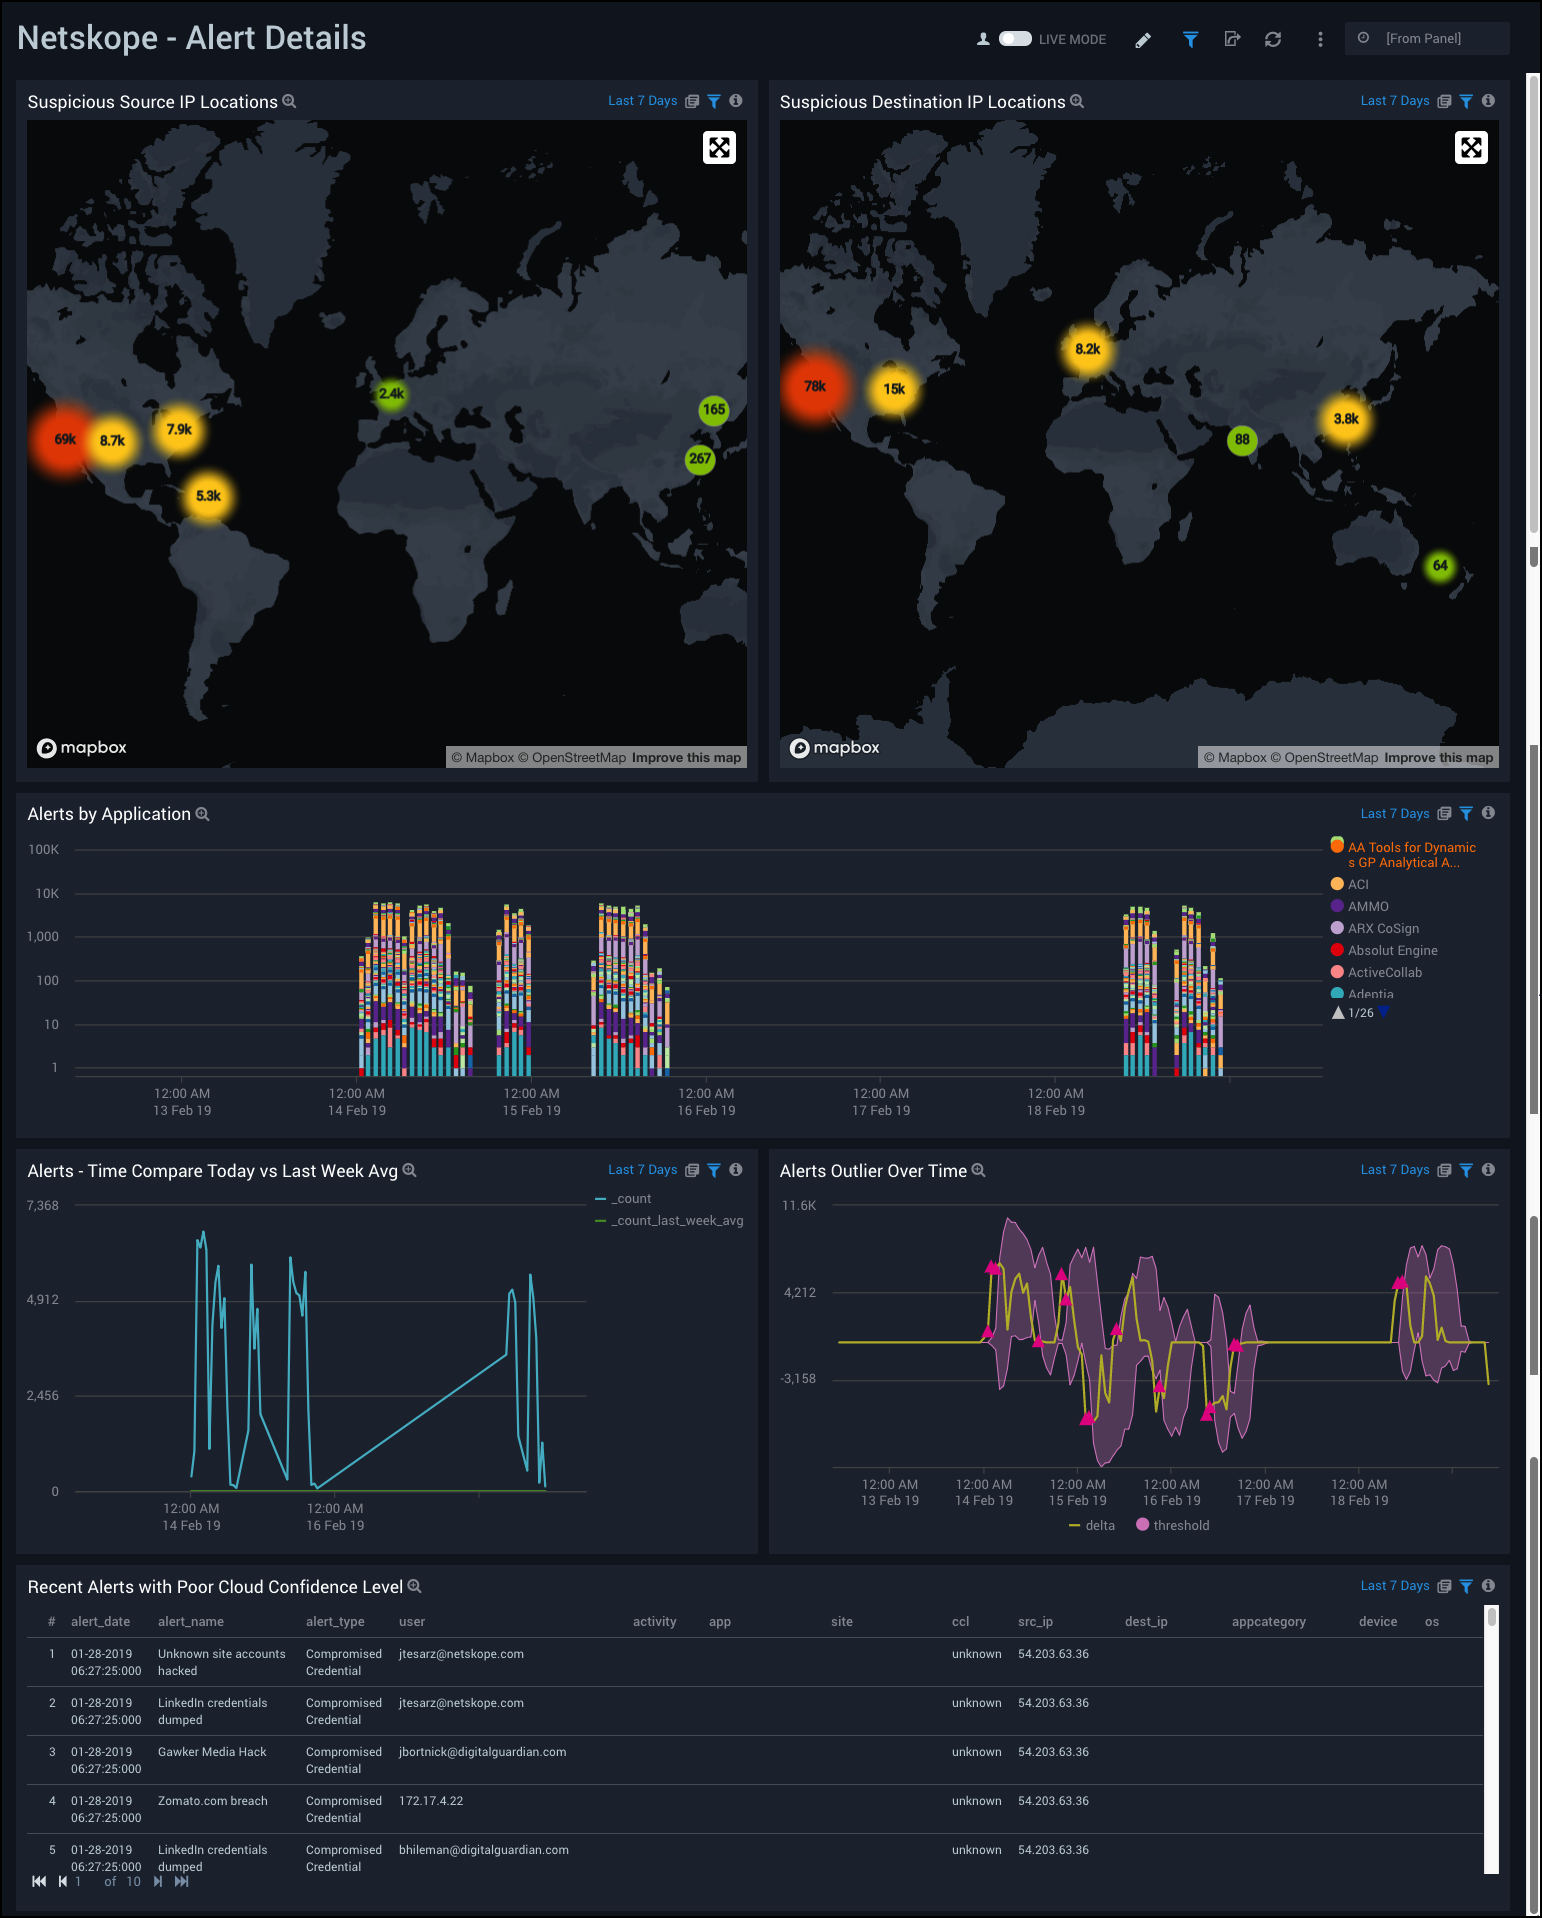
Alert Details
Netskope - Alert Details Dashboard provides a visual presentation of alert analytics, including the geographic locations of suspicious source and destination IPs, a time compare of alters, alert outlier trends over time, alerts by application, and recent alerts with a poor cloud confidence level.
Use this dashboard to:
- Compare alerts over time and anomalies in alert rates.
- Track which applications are producing the most alerts over time.
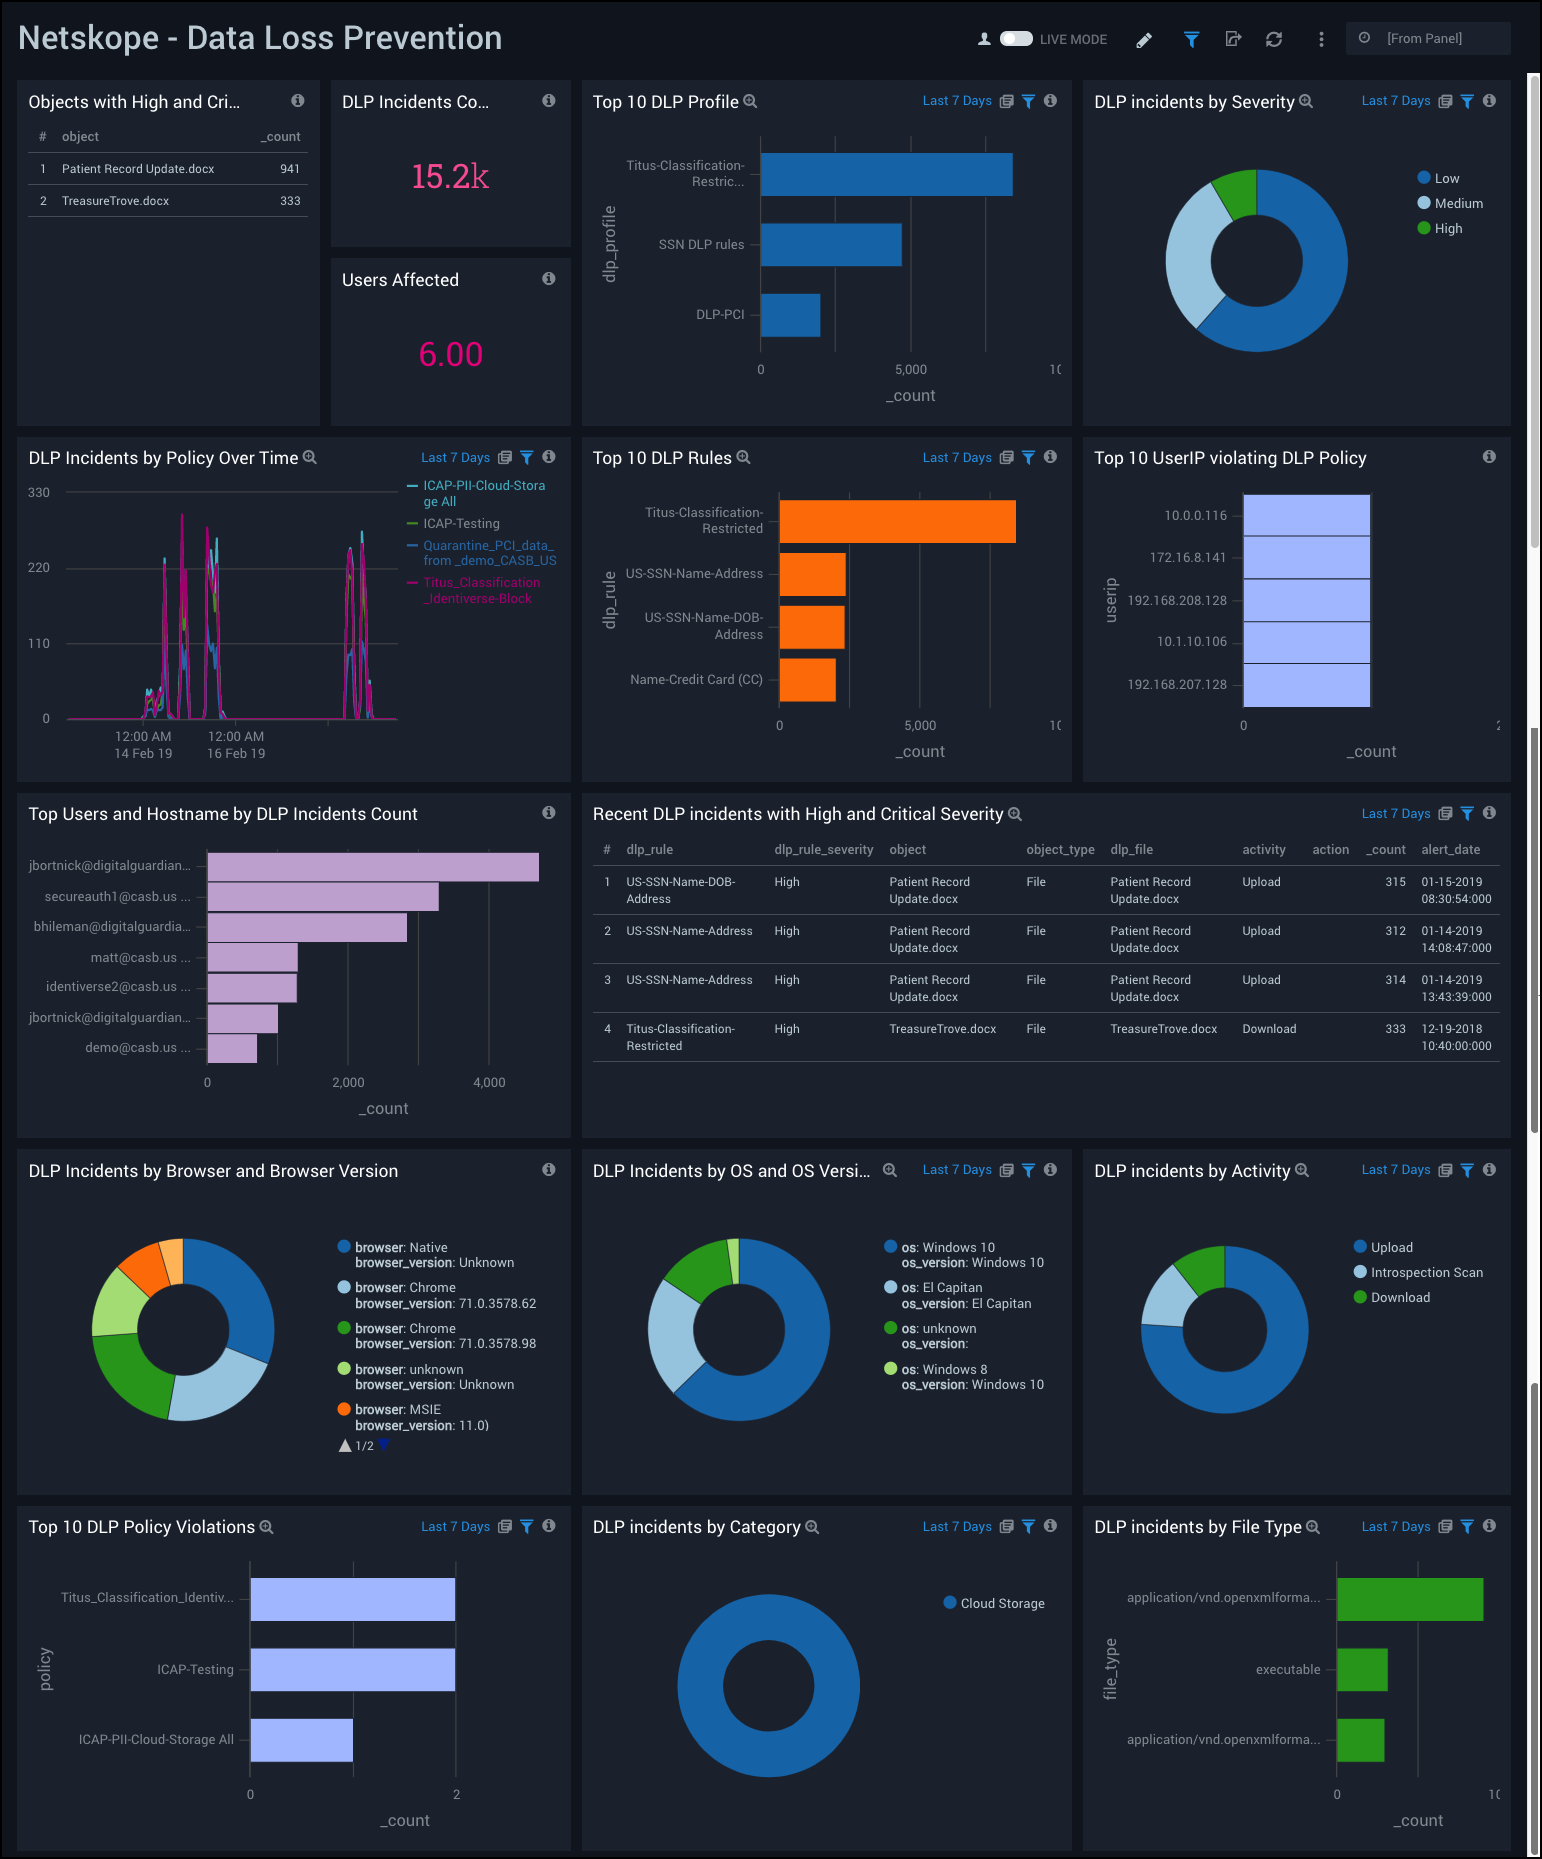
Data Loss Prevention
Netskope - Data Loss Prevention Dashboard provides a high-level view of data loss prevention (DLP) analytics, including incidents by policy over time, incidents by severity and application, incidents by operating system (OS) and browser. This dashboard also shows data on DLP rules, top profiles, incident count, and users affected.
Use this dashboard to:
- Track users and applications affected by DLP incidents.
- Monitor High Severity DLP incidents.
- Determine objects with critical severity.
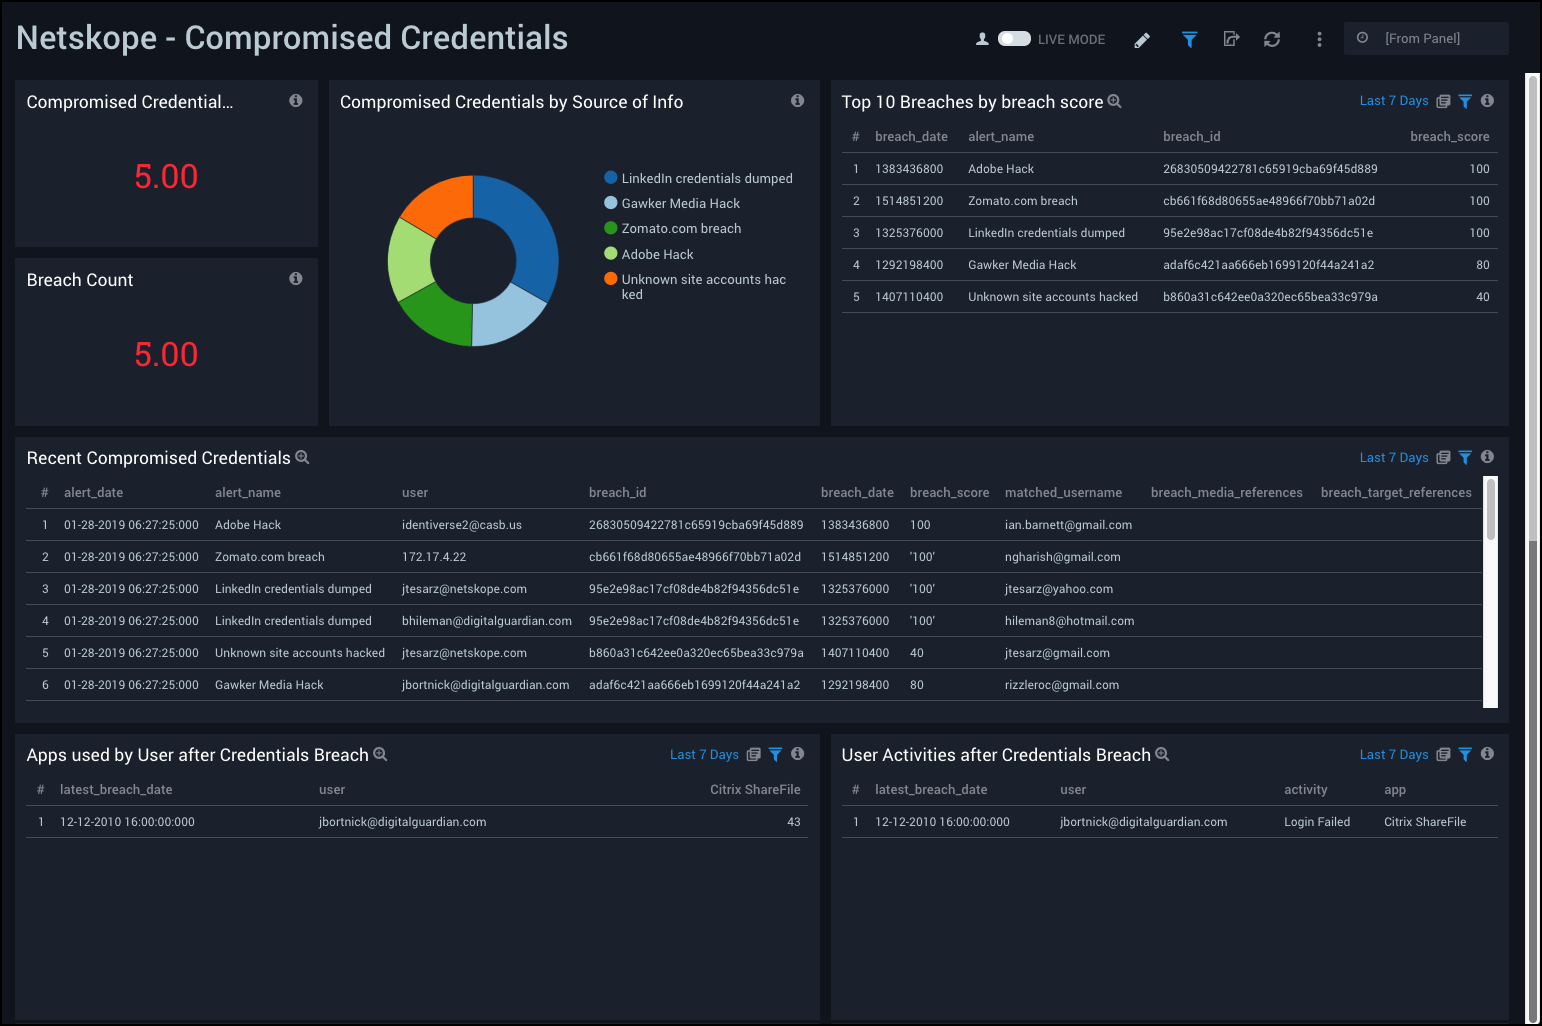
Compromised Credentials
Netskope - Compromised Credentials Dashboard provides easily accessible analytics on compromised credentials, including the number of users with compromised credentials, a breach count and top breaches, and source info. This dashboard also provides data on recent compromised credentials, apps used by users after a credentials breach, and user activities after a credentials breach.
Use this dashboard to:
- Track credential breaches along with their source.
- Monitor user activities.
- Monitor application usage after credentials have been breached.
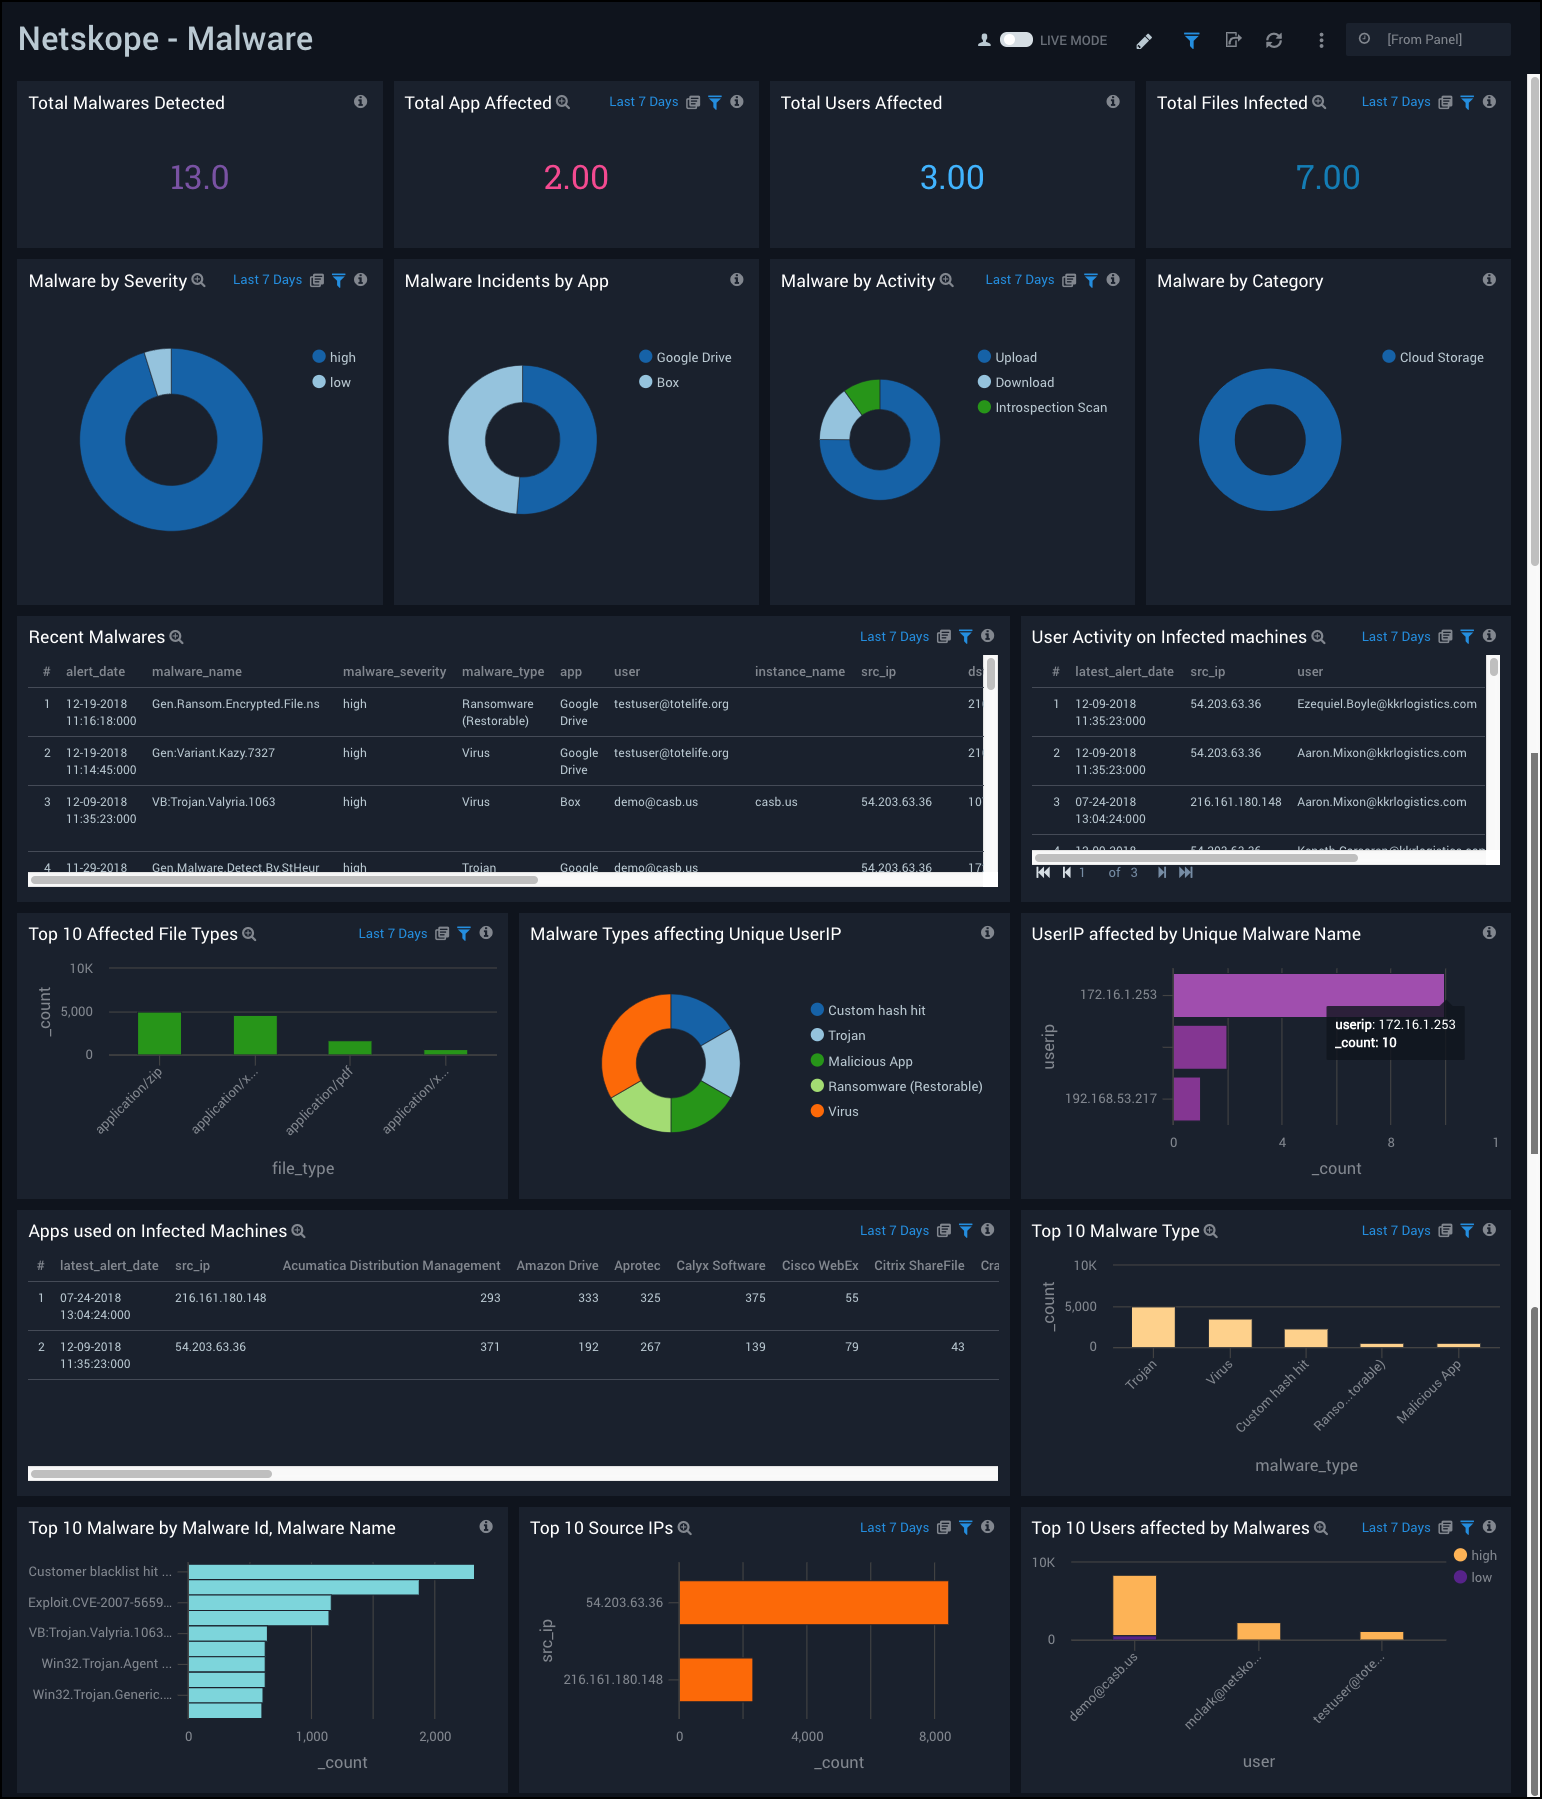
Malware
Netskope - Malware Dashboard provides a high-level view of total malwares detected, total apps and users affected, total files infected, top source IPs and malware types, and the top users affected. This dashboard also provides data malware incidents by app and severity, affected file types, apps used on infected machines, and the user activity on infected machines.
Use this dashboard to:
- Determine applications and users affected by malware.
- Monitor user activity on affected machines.
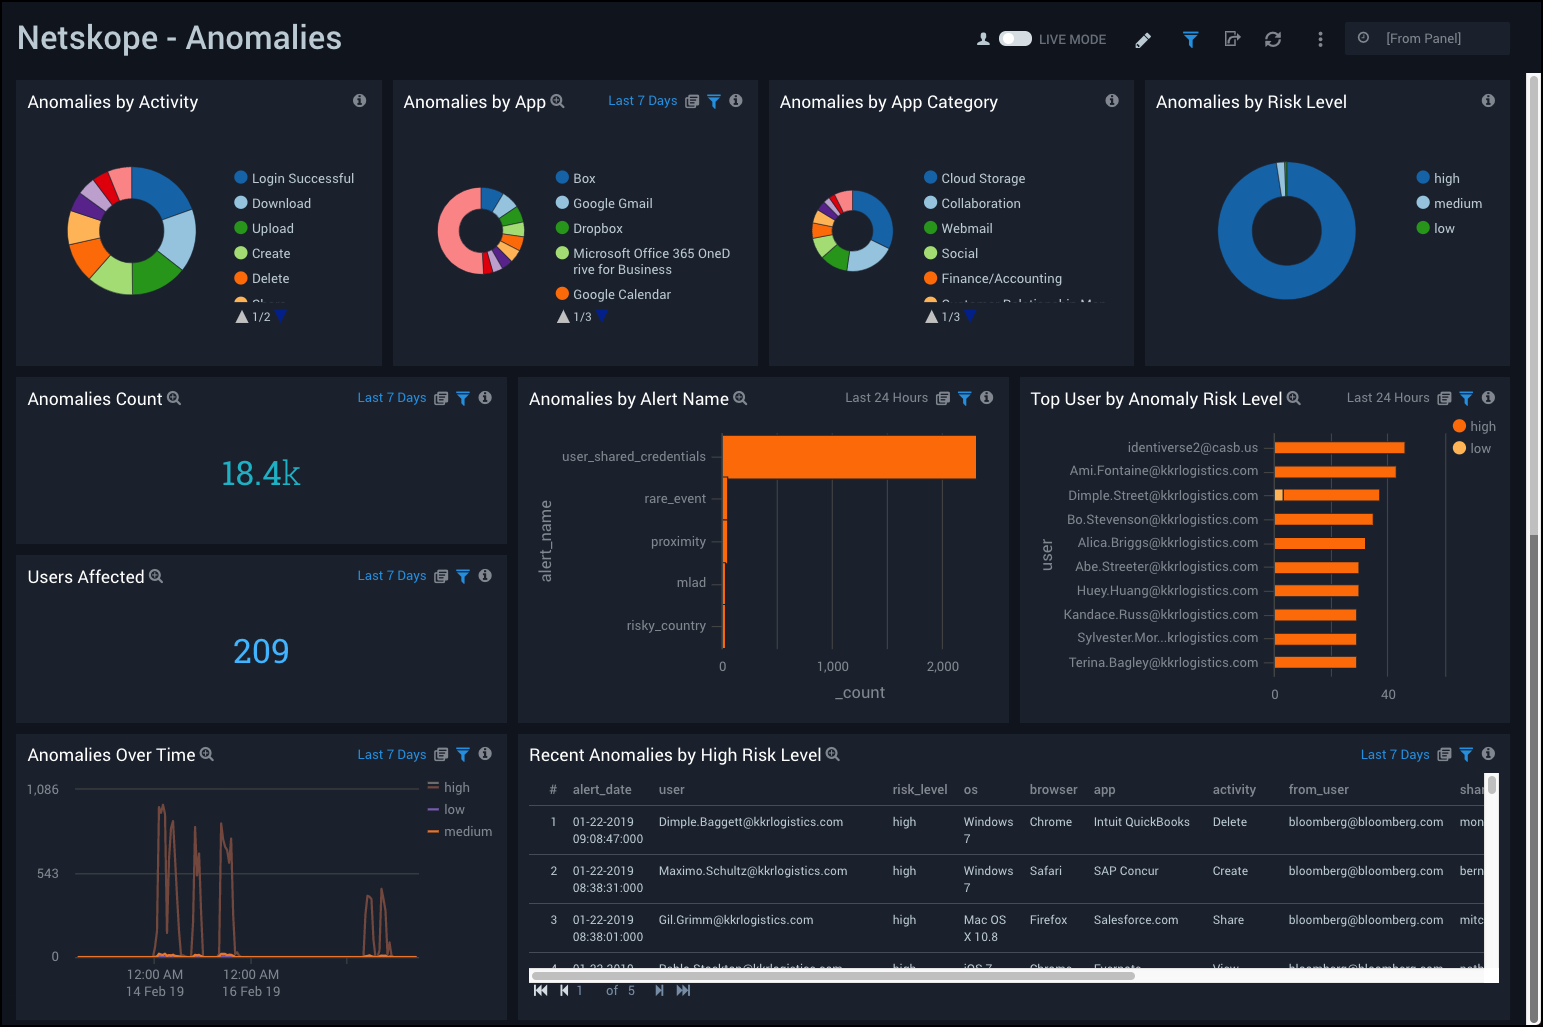
Anomalies
Netskope - Anomalies Dashboard provides an at-a-glance view of anomalies on your environment, including the number of anomalies, users affected, anomalies over time, anomalies by app, alert name, and risk level. It also includes data on top users by anomaly risk level and recent anomalies by high risk level.
Use this dashboard to:
- Monitor anomalies in users activities.
- Track anomalies with high risk levels.